

Abstract
BACKGROUND
Previously identified resting functional connectivity (FC) differences in individuals with stimulant use disorder (SUD) suggest an imbalance in neural regions that mediate behavioral aspects relevant to addiction such as emotion regulation and reward processing. There is a need to further investigate these differences across time between those that relapse and those that do not. This is the first longitudinal study of recently abstinent SUD (SUD-RA) that identifies specific FC changes in subsequent relapsers (vs abstainers). We hypothesized that (1) subsequent relapsers (vs abstainers) will show lower FC of emotion regulation regions and higher FC of reward processing regions and (2) FC differences would be more evident across time.
METHODS
We examined resting FC in 18 SUD-RAs (8 females, age: M=22.05±2.64) and 15 non-substance abusing controls (NSAC; 5 females, age: M=24.21±5.76) at Time 1 (abstinent ~5 weeks). Fourteen NSAC and 12 SUD-RAs were re-examined at Time 2 (abstinent ~13 weeks). With seed-based FC measures, we examined FC differences between SUD-RAs that abstained or relapsed over the subsequent 6 months.
RESULTS
Relapsers (vs abstainers) had higher FC between (1) nucleus accumbens (NAcc) and left frontopolar cortex (FPC), (2) NAcc and posterior cingulate gyrus and (3) subgenual anterior cingulate and left FPC at Time 1. Relapsers (vs abstainers) showed larger reduction in FC strength within these regions across time.
CONCLUSIONS
Resting FC reduction found in relapsers (vs. abstainers) from five to thirteen weeks of abstinence may be a biological marker of relapse vulnerability. These preliminary findings require replication with larger sample sizes.
Keywords: change, abstinence, functional connectivity, addiction, frontal, relapse
1. INTRODUCTION
Drug addiction is characterized by lack of control over impulsive and compulsive behaviors toward drug use. These addictive behaviors are related to a reorganization of brain functional networks that occur after repeated exposure to drugs (Koob and Volkow, 2010; Mameli and Luscher, 2011). Research suggests that chronic drug use is related to an imbalance of brain networks with enhanced engagement of regions that mediate reward processing (e.g., nucleus accumbens network) and reduced engagement of regions that mediate regulatory behavior (e.g., prefrontal cortex; Volkow et al., 2013). Resting state networks (RSNs) facilitate the examination of the temporal correlation of changes in Blood Oxygen Level Dependent (BOLD) signal across brain regions without stimuli or tasks. Temporal correlations in RSNs represent functional connectivity (FC) and index properties of brain function (Biswal et al., 1995; Fox and Greicius, 2010). FC of resting state networks reflect BOLD signal changes comparable to task-related ones (Damoiseaux et al., 2006) and have been directly associated with the quality of an individual behavioral performance (Mennes et al., 2010; Seeley et al., 2007). Resting FC properties may provide crucial information on the ability to maintain abstinence in individuals with substance use disorder (Camchong et al., 2013a).
FC differences in stimulant use disorders have been identified in resting state networks (Camchong et al., 2011; Gu et al., 2010; Kelly et al., 2011). Findings, however, are inconclusive. Inconsistencies may be related to dynamic changes in FC at different stages of use or abstinence. For example, actively using cocaine addicts (vs. controls) have shown higher resting FC between ACC and DLPFC (Camchong et al., 2011). Short-term abstinent cocaine addicts (>2 weeks abstinence) have shown lower frontal interhemispheric resting FC in inferior frontal sulcus (vs. controls; Kelly et al., 2011). Long-term abstinent (>18 months of abstinence) alcoholics with comorbid stimulant dependence have shown higher FC between sgACC and DLPFC (vs. controls; Camchong et al., 2013c). While these inconsistencies may be related to methodology differences, they may mark distinct FC differences at different stages of the disease. More importantly, these cross-sectional findings may index specific resting FC differences that mark vulnerability to relapse vs. successful abstinence.
It should be noted that short-term abstinent individuals with stimulant use disorders examined in research studies are not uniform in recovery outcome. Addicts that have less than a year of abstinence only have a 36% chance to achieve long-term abstinence (Dennis et al., 2007). Camchong et al (2013a) reported that brain FC during short-term abstinence (11 weeks of abstinence) from alcohol and stimulants is different between those who relapse vs. abstain over the next six months. Relapsers showed widespread lower FC than abstainers within various resting state networks (i.e. emotion regulation, reward processing, insular and visual networks). Task fMRI data has also identified specific differences in stimulant addicts that subsequently relapse (vs. abstain), characterized by reduced task-related activity in posterior cingulate and insula (Clark et al., 2012). These findings suggest that neural markers evident during early abstinence can differentiate between those that subsequently relapse vs. abstain.
It is important to investigate whether we can identify FC changes across time during early abstinence that are different between stimulant dependent subjects that subsequently relapse vs. abstain. To our knowledge, the present study is the first one to examine FC differences (1) across time within the same sample of recently abstinent individuals with stimulant use disorder and (2) between those that subsequently relapse or abstain.
The present study aimed to (1) identify FC differences during early stages of abstinence between subjects with stimulant dependence that relapse vs. abstain over the next six months and (2) investigate whether these FC differences change across time. We recruited recently abstinent individuals with stimulant use disorder (SUD-RA) enrolled in an abstinence-based residential intermediate care program and collected resting fMRI data at five weeks of abstinence (chosen to assure that SUD-RAs were beyond the acute withdrawal phase and had recently started the intermediate residential program) and at thirteen weeks of abstinence (chosen to examine FC changes at a later point in abstinence in which SUD-RAs were still in the intermediate residential program – patients usually stay 2–3 months after enrollment). After 6 months, SUD-RAs were contacted to inquire whether they remained abstinent or relapsed.
The present study focused on examining FC differences within reward and emotion regulation networks and behavioral aspects relevant to addiction and abstinence. The nucleus accumbens (NAcc) plays a key role in processing the rewarding effects of drugs (Everitt and Robbins, 2005; Koob and Le Moal, 1997). Repeated exposure to drugs generates long-lasting synaptic changes in NAcc, reorganizing its connections with reward processing regions (Lee and Dong, 2011). Dysfunctional emotion regulation in addicted individuals has been associated with differences in FC (Albein-Urios et al., 2012). The subgenual anterior cingulate (sgACC) plays a key role in cognitive evaluation and decision making associated with emotion (Etkin et al., 2011; Kelly et al., 2009). Individuals with addiction have shown reduced activity in this region when processing emotion (Salloum et al., 2007). Camchong et al (2013a) have reported that alcoholics with comorbid stimulant use disorder that subsequently relapse (over a period of six months) show lower FC of both NAcc and sgACC during early abstinence when compared to those that remain abstinent. The present study examined FC of both NAcc and sgACC in SUD-RA without alcohol use disorder.
Based on our previous findings and reports of poor prefrontal regulation and FC (Camchong et al., 2013a; Volkow et al., 2013), we hypothesized (a) that relapsers will have lower resting FC between sgACC seed and prefrontal regions involved in behavioral regulation at five weeks of abstinence (vs. abstainers) and (b) that this difference would be more pronounced at thirteen weeks of abstinence, as a potential precursor of relapse. Based on our previous findings (Camchong et al., 2013a) and reports of NAcc’s FC changes after repeated drug use (Lee and Dong, 2011), we hypothesized (a) that relapsers will show lower resting FC between NAcc seed and regions involved in regulating reward at five weeks of abstinence (vs. abstainers) and (b) that this difference would be more evident at thirteen weeks of abstinence as a potential precursor of relapse.
2. METHODS AND MATERIALS
2.1. Participants
A total of twenty-one recently abstinent (five weeks of abstinence) men and women with stimulant use disorders (SUD-RAs) and sixteen non-substance abusing controls (NSAC) were recruited at Time 1. One SUD-RA participant was excluded because image acquisition did not include the whole brain due to field of view misalignment. Two SUD-RAs and one NSAC were excluded due to excessive movement (see FMRI Image Analysis section). As a result, the study had usable data for assessment for 18 SUD-RAs (8 females, age: M = 22.05, SD = 2.64) and 15 NSAC (5 females, age: M = 24.21, SD = 5.76) at Time 1 (5 weeks of abstinence for SUD-RAs). NSAC were not significantly different to SUD-RA on sex (chi-square test: χ2(1, N=33)=0.52, p=0.72), age (t-test: t(1,31)=1.42, p=0.17) or total number of years of education (t-tests: t(1,26)=1.70, p=0.10). SUD-RA lifetime stimulant use ranged from 0.5 to 5 years with a mean of 2.17 years. SUD-RA subjects were recruited at the beginning of their enrollment in an intermediate care program at Hazelden’s Fellowship Club in Saint Paul, Minnesota. Only SUD-RAs that intended to stay in the program for at least 3 months were recruited (typical length of stay in the program is at least 2 months). All SUD-RA subjects were required to remain abstinent in the transitional care program (residents were subject to random screening to ensure abstinence). All SUD-RAs reported abstinence at each assessment visit.
NSAC subjects were recruited via fliers posted on community and bulletin boards throughout the University of Minnesota campus, the metro area and through an online employee newsletter. All participants provided written informed consent and received monetary compensation for the time spent participating. The consent process and all procedures were reviewed and approved by the institutional review board (IRB) at the University of Minnesota prior to initiating studies. HIPAA consent documentation was also obtained.
Participation criteria for SUD-RAs and non-substance abusing controls (NSAC): (a) 18–25 age range, (b) no MRI contraindications (heart pacemaker or defibrillator, other metal implant, claustrophobia, BMI>35, injured by a metallic object that has not been removed, braces, pregnancy, movement disorder) and (c) no DSM-IV criteria for mental retardation or Axis I bipolar or psychotic psychiatric disorder. SUD-RAs specific criteria: (a) DSM IV dependence on cocaine or amphetamines, (b) recent admission to Hazelden’s Fellowship Club following a primary residential treatment stay (28-days program) and (c) intention to stay in treatment for 3 months. NSAC specific criterion: no history of any substance use disorder.
A subset of subjects were available at Time 2 (thirteen weeks of abstinence): fourteen NSAC (4 females, age: M=22.85, SD=2.45) and 12 SUD-RAs (5 females, age: M=22.32, SD=2.79). Unavailable SUD-RAs had been released from the program. At six months of abstinence SUD-RAs were contacted to inquire about abstinence or relapse. Of the 12 SUD-RAs that remained in the study at thirteen weeks of abstinence, 5 SUD-RAs relapsed (2 females, age: M=22.73, SD=3.16) and 7 remained abstinent (3 females, age: M=22.03, SD=2.72). Of the 18 SUD-RAs that participated in the study at Time 1, 6 SUD-RAs relapsed (2 females, age: M=21.99, SD=3.36) and 12 remained abstinent (6 females, age: M=22.09, SD=2.37). Relapse was defined with a dichotomous variable: no use vs. any use.
Regarding Diagnostic screening, all subjects underwent a structured clinical interview for DSM-IV axis I conditions (SCID) administered by a trained member of the research staff (SCID I/P (patient version) for SUD-RAs and SCID I/NP (non-patient version) for NSAC.
2.2. Imaging Data Acquisition
Both at Time 1 and 2, all participants (SUD-RAs and NSAC) underwent a 6-min resting-state fMRI scan and were instructed to be as still as possible, keep their eyes closed and stay awake. Images were collected using a Siemens TIM Trio 3T scanner (Erlangen, Germany). Sequence parameters: gradient-echo echo-planar imaging (EPI) 180 volumes, repetition time (TR)=2 s, echo time (TE)=30 ms, flip angle=90°, 34 contiguous AC-PC aligned axial slices with an interleaved acquisition, voxel size=3.4×3.4×4.0 mm, matrix=64×64×34. Participants were debriefed at the end of the scan to determine if they had stayed awake. A high-resolution T1-weighted anatomical image was acquired using a magnetization prepared rapid gradient-echo sequence. A field map acquisition was collected and used to correct the fMRI data for geometric distortion caused by magnetic field inhomogeneities (TR=300 ms, TE=1.91 ms/4.37 ms, flip angle=55°, voxel size=3.4×3.4×4.0 mm).
2.3. FMRI Imaging Analysis
All individual level analyses (preprocessing and generation of FC maps) were conducted using same procedures reported in our previous study (Camchong et al., 2011). The following pre-statistics processing was applied for each subject using FEAT (FMRIB’s Software Library [FSL]): first 3 volumes deleted to account for magnetization stabilization, motion correction, B0 field map unwarping, slice-timing correction, non-brain removal, spatial smoothing (with a 6-mm full-width half-maximum kernel), grand mean scaling, high-pass temporal filtering (100 Hz) to remove correlations associated with slow trends scanner noise and registration of all images to MNI (Montreal Neurological Institute) 2×2×2 mm standard space. Probabilistic independent component analysis (PICA) was conducted for each individual to denoise individual data by removing components that represented noise such as head motion, scanner artifacts and physiological noise. Noise components were selected for removal using spatial and temporal characteristics detailed in the MELODIC (FSL) manual (http://www.fmrib.ox.ac.uk/fslcourse/lectures/melodic.pdf) and based on Kelly et al. (2011) for selection criteria of noise components. Residual (denoised) data were computed by subtracting the selected noise components from the preprocessed data. From the original set of recruited participants, two SUD-RAs and one NSAC were excluded from the study because motion correction output showed more than 1.8 mm of movement (translation) or more than 50% of the PICA components were identified as movement related.
2.3.1. ROI selection and seed generation
Because the purpose of the current study was to examine changes in resting FC of reward and emotion regulation networks regions during early abstinence, we examined FC of nucleus accumbens (NAcc) and subgenual anterior cingulate (sgACC) seeds (Figure 1). We used a spherical seed with 3.5 mm radius placed at bilateral NAcc and sgACC (Camchong et al., 2013a; Camchong et al., 2013c). We extracted the time series from these seeds for each participant by computing the mean intensity for all voxels within the seed region for each time point in the denoised residual data.
Figure 1.
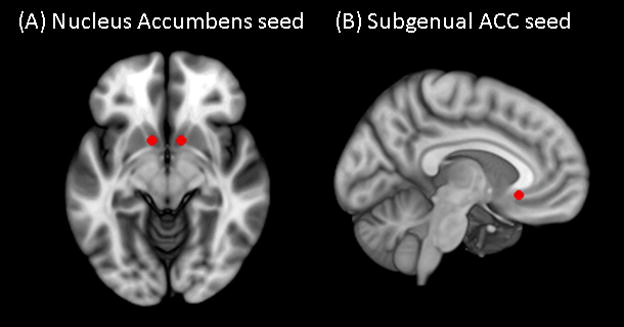
(A) Nucleus accumbens (NAcc) (x=±12, y=10, z=−9) and (B) subgenual anterior cingulate cortex (ACC) (x=5, y=25, z=−10)seeds used to examine strength of functional connectivity overlaid on Montreal Neurological Institute (MNI) brain.
2.3.2. Resting State Individual-Level Analysis
For both Time 1 and 2 data, the average time-series was extracted for each seed (sgACC and NAcc) for each participant in each group (SUD-RAs and NSACs). A multiple regression analysis on the denoised data was performed between the extracted average time-series from the seed and all voxels in the brain. This generated a map with a correlation coefficient (r) for each voxel, for each individual, for each seed, for both Time 1 and 2. Correlation coefficients (r) were transformed to standardized z values. Resulting standardized z maps showed the degree of correlations with the corresponding seed averaged time-series for each seed for each participant for both Time 1 and 2.
2.3.3. Resting State Group-Level Analysis – Time 1
To investigate brain functional organization differences in SUD-RAs at Time 1 we conducted two sets of analyses. First, because our primary goal was to directly examine FC differences related to relapse or abstinence maintenance, we examined whole-brain FC differences in each seed by performing an independent samples t-test comparing FC collected at five weeks of abstinence between SUD-RAs that relapsed vs. maintained abstinence over the next 6 months. A threshold/cluster method derived from Monte Carlo simulations (AlphaSim, AFNI) was applied to control for false positive findings. [Monte Carlo simulations (1000 iterations) accounted for the full-width half-maximum Gaussian filter (6 mm FWHM) and with a connectivity radius of 7.1mm. On the basis of these simulations, the family-wise α of 0.025 was preserved with an a priori voxel-wise probability of 0.005 and three-dimensional clusters with a minimum volume of 1536 μL (192 voxels).] Second, in order to examine how FC strength within regions where differences were identified between REL and ABS compares to the healthy control group (NSAC), we extracted mean z-scores within these clusters (Figures 2A and 4A; Table 1). Analyses of variance were conducted to compare extracted mean z-scores between ABS, REL and NSAC.
Figure 2.
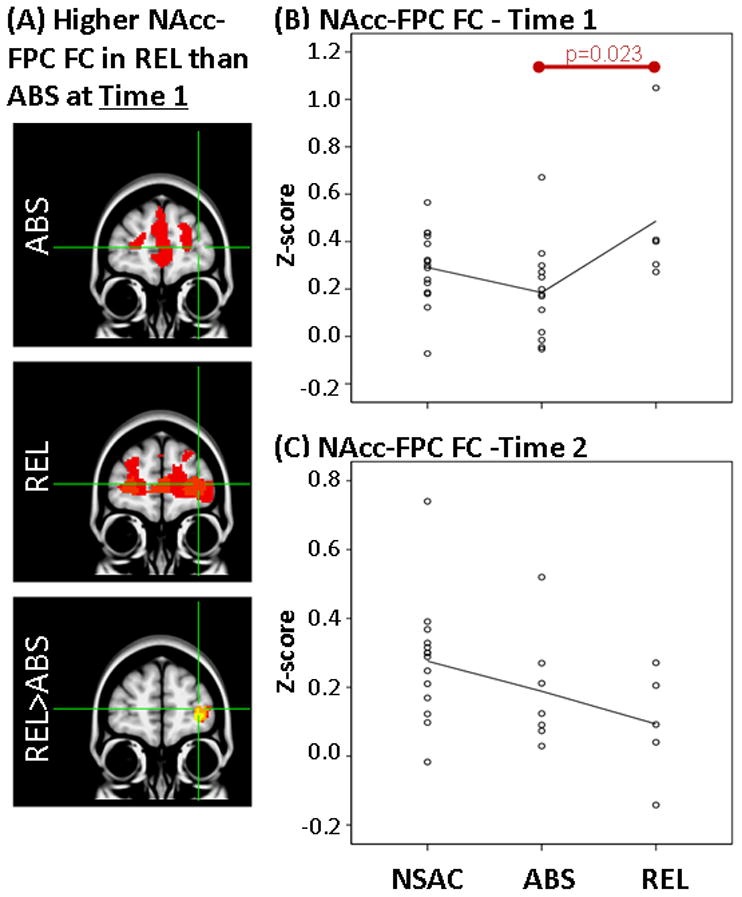
Results showing higher FC between NAcc and FPC at Time 1 but not at Time 2 in REL vs ABS. LEFT: (A) Whole-brain FC maps showing regions with significant connectivity to NAcc (p<0.025, corrected for multiple comparisons) in ABS (1st row) and REL (2nd row). Bottom row shows whole-brain independent samples t-test results in which REL had significantly higher NAcc-FPC than ABS (p<0.025, corrected for multiple comparisons). Functional maps are laid on MNI brains in radiological orientation (right is left). RIGHT: Scatter plots showing z-scores representing strength of NAcc-FPC FC in the NSAC, ABS and REL groups at Time 1 (B) and Time 2 (C). Each dot represents an individual subject’s average z-score within the FPC cluster. Red bar shows significant difference between groups. FC, functional connectivity; NAcc, nucleus accumbens; FPC, frontopolar cortex; REL, stimulant addicts that relapsed over six months; ABS, stimulant addicts that remained abstinent over six months; MNI, Montreal Neurological Institute; NSAC, non-substance abusing controls.
Figure 4.
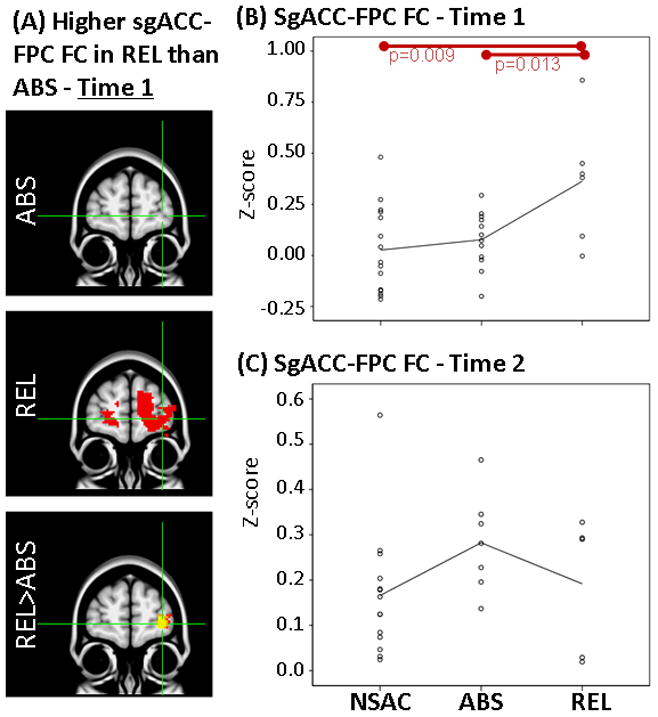
Results showing higher FC between sgACC and FPC at Time 1 but not at Time 2 in REL when compared to ABS. LEFT: (A) Whole-brain FC maps showing regions with significant connectivity to sgACC (p<0.025, corrected for multiple comparisons) in ABS (1st row) and REL (2nd row). Bottom row shows whole-brain independent samples t-test results in which REL had significantly higher sgACC-FPC than ABS (p<0.025, corrected for multiple comparisons). Functional maps are laid on MNI brains in radiological orientation (right is left). RIGHT: Scatter plots showing z-scores representing strength of sgACC-FPC FC in the NSAC, ABS and REL groups at Time 1 (B) and Time 2 (C). Each dot represents an individual subject’s average z-score within the FPC cluster. Red bars show significant difference between groups. FC, functional connectivity; sgACC, subgenual anterior cingulate; FPC, frontopolar cortex; REL, stimulant addicts that relapsed over six months; ABS, stimulant addicts that remained abstinent over six months; MNI, Montreal Neurological Institute; NSAC, non-substance abusing controls.
Table 1.
Identification of anatomy, hemispheric location (L/R), coordinates (x,y,z) in MNI space (mm), analysis of covariance results statistics, and effect size for the difference within clusters in which relapsers showed significantly higher FC than abstainers within the (A) NAcc FC map and (B) sgACC FC map at Time 1 (~5 weeks of abstinence).
| Anatomy of regions within identified clusters | L/R | x | y | z | Higher FC in REL at Time 1 (REL>ABS) | Larger reduction of FC in REL across time (Time 2 -Time 1) (REL>ABS) | ||||
|---|---|---|---|---|---|---|---|---|---|---|
|
| ||||||||||
| F | p | Effect size partial η2 | F | p | Effect size partial η2 | |||||
| (A) NAcc network differences | ||||||||||
| Frontopolar prefrontal cortex (FP-PFC) | L | −30 | 62 | 0 | 6.3 | 0.02 | 2.8 | 5.8 | 0.04 | 3.7 |
| Posterior cingulate cortex (PCG) | L/R | −2 | −76 | 20 | 5.4 | 0.03 | 2.5 | 9.3 | 0.01 | 4.8 |
| (B) SgACC network differences | ||||||||||
| Frontopolar prefrontal cortex (FP-PFC) | L | −24 | 62 | −4 | 7.8 | 0.01 | 3.3 | 7.0 | 0.02 | 4.1 |
2.3.4. Resting State Group-Level Analysis – Time 2
As in Time 1 analysis, we first examined whole-brain FC differences related to relapse or abstinence maintenance, by conducting an independent samples t-test comparing FC collected at thirteen weeks of abstinence between SUD-RAs that relapsed vs. abstained over the next 6 months (for each seed). Same correction for multiple comparisons described in Time 1 was conducted. Second, to investigate whether group differences in FC identified in Time 1 (Table 1) were still evident at later stages of abstinence, we extracted z-scores within identified clusters (Table 1) from the Time 2 data and used analysis of variance to compare these FC values between groups.
2.3.5. Change in FC between Time 1 and 2
To investigate whether ABS and REL had difference patterns of FC change across time, we obtained the difference between z-scores in clusters shown in Table 1 (difference=Time2-Time1). We then conducted an analysis of variance to compare changes in FC between groups. Post-hoc Tukey tests were performed to examine specific differences between ABS, REL and NSAC.
2.3.6. Supplementary Statistical Analyses
Non-parametric statistical tests to address small sample size and potential outliers confirmed results reported below and can be found in Supplementary Material1.
3. RESULTS
3.1. Functional Connectivity (FC) Results Time 1
3.1.1. Higher FC in relapsing vs. abstaining SUD-RAs at five weeks of abstinence (Table 1)
First, independent samples t-tests on whole-brain z-score FC maps showed that relapsers (REL; N=6) when compared to abstainers (ABS; N=12), had higher FC (1) between NAcc seed and left frontopolar cortex (FPC; Figures 2A, 2B), (2) between NAcc seed and posterior cingulate gyrus (PCC; Figure 3A, 3B) and (3) between sgACC seed and left FPC (Figures 4A, 4B) at Time 1.
Figure 3.
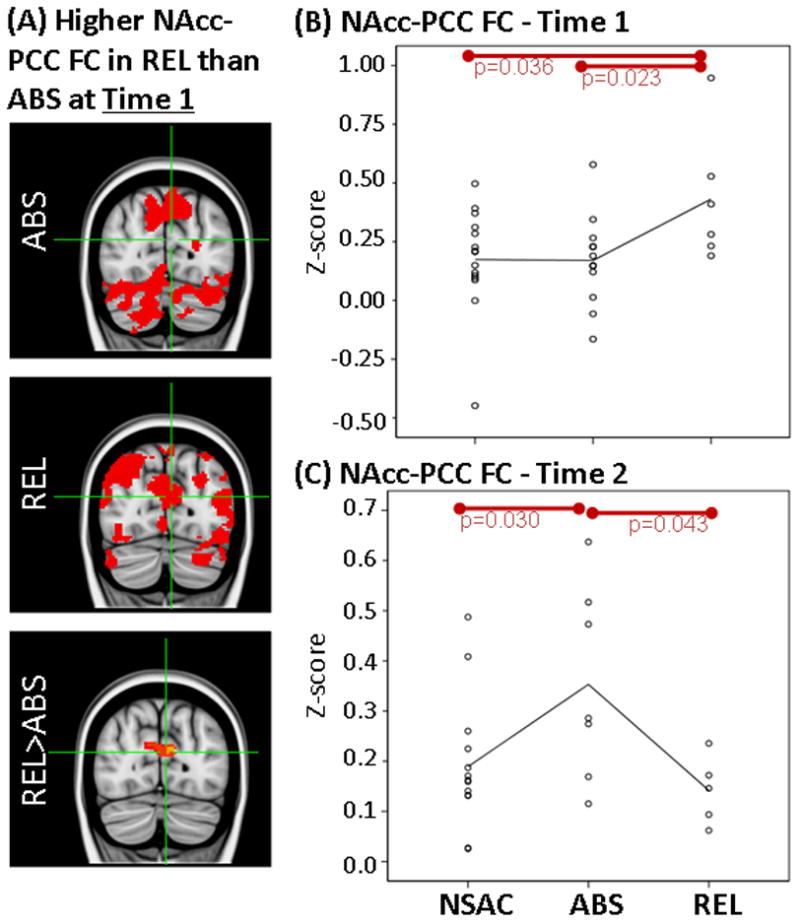
Results showing higher FC between NAcc and PCC at Time 1 but not at Time 2 in REL vs ABS. LEFT: (A) Whole-brain FC maps showing regions with significant connectivity to NAcc (p<0.025, corrected for multiple comparisons) in ABS (1st row) and REL (2nd row). Bottom row shows whole-brain independent samples t-test results in which REL had significantly higher NAcc-PCC than ABS (p<0.025, corrected for multiple comparisons). Functional maps are laid on MNI brains in radiological orientation (right is left). RIGHT: Scatter plots showing z-scores representing strength of NAcc-PCC FC in the NSAC, ABS and REL groups at Time 1 (B) and Time 2 (C). Each dot represents an individual subject’s average z-score within the PCC cluster. Red bars show significant difference between groups. FC, functional connectivity; NAcc, nucleus accumbens; PCC, posterior cingulate cortex; REL, stimulant addicts that relapsed over six months; ABS, stimulant addicts that remained abstinent over six months; MNI, Montreal Neurological Institute; NSAC, non-substance abusing controls.
Second, as stated in the Methods section, mean z-scores were extracted for each individual subject within regions where FC differences were identified between REL and ABS (Table 1). These mean z-scores were used to examine how FC in REL and ABS compare to NSAC. Analysis of variance on extracted mean z-scores showed a significant overall difference between REL, ABS and NSAC in NAcc-FPC FC (F(2,30)=4.3, p=0.023), NAcc-PCC FC (F(2,30)=3.4, p=0.048) and sgACC-FPC FC (F(2,30)=5.8, p=0.007). Paired comparisons showed higher FC in REL than NSAC in NAcc-PCC FC (p=0.035) and sgACC-FPC FC (p=0.009). There were no significant FC differences between ABS and NSAC at Time 1 (Figures 2B, 3B and 4B).
3.2. Functional Connectivity (FC) Results – Time 2
3.2.1. FC in REL at thirteen weeks of abstinence
Independent samples t-tests on whole-brain z-score FC maps showed no significant differences at Time 2 between abstainers (ABS; N=7) and relapsers (REL; N=5) after correction for multiple comparisons (same as Time 1). When only examining clusters in which significant FC differences were identified at Time 1 (Table 1), independent samples t-tests showed that higher FC previously observed at Time 1 in the REL group (vs. ABS) were not found at Time 2 between NAcc seed and left FPC (Figure 2C; t(1,10)=0.9, p=0.35) and between sgACC seed and left FPC (Figure 4C; t(1,10)=1.2, p=0.26). In addition, when compared to ABS, REL had significantly lower FC between NAcc seed and PCC (Figure 3C; t(1,10)=2.3, p=0.04).
3.3. Change in FC between Time 1 and Time 2 (Figure 5)
Figure 5.
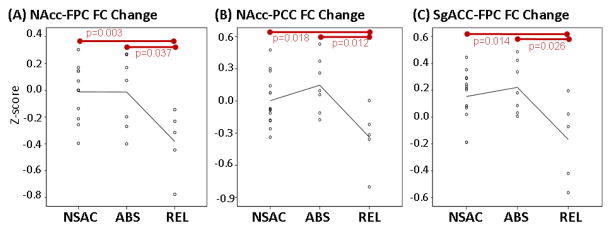
Scatter plots showing change in FC between (A) NAcc and FPC, (B) NAcc and PCC and (C) sgACC and FPC. Each dot represents FC change in an individual subject (Time 2 z-score minus Time 1 z-scores). Red bars show significant difference between groups. NAcc, nucleus accumbens; FPC, frontopolar cortex; PCC, posterior cingulate cortex; sgACC, subgenual anterior cingulate; REL, stimulant addicts that relapsed over six months; ABS, stimulant addicts that remained abstinent over six months; FC, functional connectivity.
Analysis of variance revealed significant overall differences in FC change between Time 1 and 2 between groups within clusters examined. When compared to ABS (n=7), REL (n=5) showed larger reduction in FC strength between Time 1 and 2 between (1) NAcc and FPC (Figure 5A; p=0.025), (2) NAcc and PCC (Figure 5B; p=0.008) and (3) sgACC and FPC (Figure 5C; p=0.015). Similarly, when compared to NSAC, REL showed larger reduction in FC strength between (1) NAcc and FPC (Figure 5A; p=0.011), (2) NAcc and PCC (Figure 5B; p=0.040) and (3) sgACC and FPC (Figure 5C; p=0.024) between Time 1 and 2. NSAC and ABS did not show significant differences in FC change.
4. DISCUSSION
While previous studies have examined brain functional connectivity (FC) in stimulant dependent subjects at a single point in time (Camchong et al., 2011, 2013a; Gu et al., 2010; Kelly et al., 2011), there is no report on how identified differences between those that subsequently relapse vs. abstain change across time. To address this, the current study had two crucial goals. First, to identify relevant resting FC differences during early abstinence (five weeks of abstinence) between stimulant dependent subjects who subsequently relapse vs. abstain. Second, to explore whether identified resting FC differences between relapsers or abstainers change across time, between five and thirteen weeks of abstinence. Although findings are preliminary and need to be replicated in studies with larger sample sizes, they highlight distinct resting FC differences between individuals with stimulant use disorder that subsequently relapse vs. abstain.
Based on previous findings (Camchong et al., 2013a), we hypothesized that REL (vs. ABS and NSAC) in the present study would have higher resting FC connectivity between NAcc and other reward processing regions (e.g. caudate or putamen) at five or thirteen weeks of abstinence. We did not find evidence to support this hypothesis at five or thirteen weeks of abstinence. Given this, we believe that an overactive reward network (Volkow et al., 2013) is not a marker of relapse vulnerability.
We also hypothesized that REL would have lower resting FC between NAcc and sgACC and top-down processing regions. Resting FC data at five weeks of abstinence did not support this hypothesis. We found higher resting FC in REL when compared to ABS (and NSAC) at five weeks of abstinence.
At five weeks of abstinence, we noticed a convergence in resting FC results, REL compared to ABS had higher FC between both seeds and frontopolar cortex (FPC) and higher sgACC-FPC FC when compared to NSAC. FPC plays a key role in higher-level executive functioning, particularly in decision making aspects such as value-based decision-making (Glascher et al., 2012), unconscious intentions before awareness of decisions (Bode et al., 2011; Soon et al., 2008) and cognitive flexibility (Koechlin and Hyafil, 2007). This literature suggests that REL had higher FC between regions that mediate decision making (FPC), emotion regulation (sgACC) and reward (NAcc) processing at five weeks of abstinence (vs. ABS). Higher FC found in REL (vs. ABS) at five weeks of abstinence, however, is not present at thirteen weeks of abstinence. REL compared with ABS had a significantly larger reduction in NAcc-FPC and sgACC-FPC FC between five and thirteen weeks of abstinence. A similar finding of lower FC of Nacc and sgACC in REL (vs. ABS) was reported in a previous study with a larger sample at eleven weeks of abstinence (Camchong et al., 2013a). Given present and previous findings, we propose that a reduction in resting FC from five weeks of abstinence to thirteen weeks of abstinence may play a role in REL’s inability to maintain abstinence over the next 6 months. It should be noted that this interpretation is speculative and needs to be supported by future longitudinal research with larger sample sizes.
At five weeks of abstinence, REL (vs. ABS) also had higher resting FC between NAcc and posterior cingulate cortex (PCC), which dramatically decreased at thirteen weeks of abstinence. At thirteen weeks of abstinence, NAcc-PCC FC was significantly lower in REL when compared to ABS (Figure 3). These results are in line with findings from our previous study, with larger sample sizes, that reported that lower resting FC at 11 weeks of abstinence (days abstinent: M=73.90±18.53; (Camchong et al., 2013a)) could predict subsequent relapse within a 6-month follow-up period (with 85.5% accuracy). Interestingly, ABS at thirteen weeks of abstinence showed significantly higher levels of NAcc-PCC FC when compared to NSAC and REL (Figures 3 and 5). Higher resting FC when compared to controls is consistent with a pattern identified in long-term abstinent alcoholics with stimulant comorbidity (seven years of abstinence; Camchong et al., 2013c). Thus, higher resting FC at thirteen weeks found in ABS may represent the beginning of potential compensatory mechanisms previously associated with achieving long-term abstinence (Camchong et al., 2013b, 2013c). A task fMRI study reported that higher PCC activity during a selective attention task was associated with the ability to maintain abstinence in individuals with stimulant use disorder (Clark et al 2012). Present findings highlight the possibility that there are dynamic changes in resting FC during abstinence that mark both vulnerability to relapse (initial higher FC at five weeks and lower FC at thirteen weeks in REL vs. ABS) and long-term abstinence potential (higher FC at thirteen weeks in ABS vs. REL). Future studies with larger sample sizes need to be conducted to confirm this relationship to further characterize the trajectory of dynamic changes in FC during abstinence.
Based on present findings, we propose that resting FC reduction found in REL between five and thirteen weeks of abstinence is a potential biological marker of relapse vulnerability. This claim, however, has potential caveats that need to be further examined. Due to the small sample size, FC reduction between five weeks and thirteen weeks of abstinence found in REL could be related to (a) attrition (n=18 at five weeks and n=12 at thirteen weeks of abstinence) or (b) regression to the mean. Several observations argue against this. First, we found lower resting FC at eleven weeks abstinence in a larger sample (n=29 relapsers vs. n=40 abstainers) of alcoholics with stimulant comorbidity (Camchong et al., 2013a); lower resting FC at eleven weeks of abstinence could accurately predict relapse within the subsequent six months (with 85.5% accuracy; Camchong et al., 2013a). Second, even with the reduced sample size of n=12, our within subject analysis found a significantly larger resting FC reduction in REL than in ABS.
Taken together, this preliminary study suggests that at five weeks of abstinence, those that subsequently relapse had higher resting FC of regions known to be involved in decision making, emotion regulation and reward processing; this higher resting FC is not present at thirteen weeks of abstinence. This reduction in resting FC from five weeks to thirteen weeks may be a biological marker of relapse vulnerability. These preliminary findings require replication with larger sample sizes.
Supplementary Material
Footnotes
Supplementary material can be found by accessing the online version of this paper at http://dx.doi.org and by entering doi:...
Supplementary material can be found by accessing the online version of this paper at http://dx.doi.org and by entering doi:...
Publisher's Disclaimer: This is a PDF file of an unedited manuscript that has been accepted for publication. As a service to our customers we are providing this early version of the manuscript. The manuscript will undergo copyediting, typesetting, and review of the resulting proof before it is published in its final citable form. Please note that during the production process errors may be discovered which could affect the content, and all legal disclaimers that apply to the journal pertain.
References
- Albein-Urios N, Verdejo-Roman J, Asensio S, Soriano-Mas C, Martinez-Gonzalez JM, Verdejo-Garcia A. Re-appraisal of negative emotions in cocaine dependence: dysfunctional corticolimbic activation andconnectivity. Addict Biol. 2012 doi: 10.1111/j.1369-1600.2012.00497.x. in press. [DOI] [PubMed] [Google Scholar]
- Biswal B, Yetkin FZ, Haughton VM, Hyde JS. Functional connectivity in the motor cortex of resting human brain using echo-planar MRI. Magn Reson Med. 1995;34:537–541. doi: 10.1002/mrm.1910340409. [DOI] [PubMed] [Google Scholar]
- Bode S, He AH, Soon CS, Trampel R, Turner R, Haynes JD. Tracking the unconscious generation of free decisions using ultra-high field fMRI. PLoS One. 2011;6:e21612. doi: 10.1371/journal.pone.0021612. [DOI] [PMC free article] [PubMed] [Google Scholar]
- Camchong J, MacDonald AW, 3rd, Nelson B, Bell C, Mueller BA, Specker S, et al. Frontal hyperconnectivity related to discounting and reversal learning in cocaine subjects. Biol Psychiatry. 2011;69:1117–1123. doi: 10.1016/j.biopsych.2011.01.008. [DOI] [PMC free article] [PubMed] [Google Scholar]
- Camchong J, Stenger A, Fein G. Resting-state synchrony during early alcohol abstinence can predict subsequent relapse. Cereb Cortex. 2013a;23:2086–2099. doi: 10.1093/cercor/bhs190. [DOI] [PMC free article] [PubMed] [Google Scholar]
- Camchong J, Stenger A, Fein G. Resting-state synchrony in long-term abstinent alcoholics. Alcohol Clin Exp Res. 2013b;37:75–85. doi: 10.1111/j.1530-0277.2012.01859.x. [DOI] [PMC free article] [PubMed] [Google Scholar]
- Camchong J, Stenger VA, Fein G. Resting state synchrony in long-term abstinent alcoholics with versus without comorbid drug dependence. Drug Alcohol Depend. 2013c;131:56–65. doi: 10.1016/j.drugalcdep.2013.04.002. [DOI] [PMC free article] [PubMed] [Google Scholar]
- Clark VP, Beatty GK, Anderson RE, Kodituwakku P, Phillips JP, Lane TD, Kiehl KA, Calhoun VD. Reduced fMRI activity predicts relapse in patients recovering from stimulant dependence. Hum Brain Mapp. 2012;35:414–428. doi: 10.1002/hbm.22184. [DOI] [PMC free article] [PubMed] [Google Scholar]
- Damoiseaux JS, Rombouts SA, Barkhof F, Scheltens P, Stam CJ, Smith SM, Beckmann CF. Consistent resting-state networks across healthy subjects. Proc Natl Acad Sci U S A. 2006;103:13848–13853. doi: 10.1073/pnas.0601417103. [DOI] [PMC free article] [PubMed] [Google Scholar]
- Dennis ML, Foss MA, Scott CK. An eight-year perspective on the relationship between the duration of abstinence and other aspects of recovery. Eval Rev. 2007;31:585–612. doi: 10.1177/0193841X07307771. [DOI] [PubMed] [Google Scholar]
- Etkin A, Egner T, Kalisch R. Emotional processing in anterior cingulate and medial prefrontal cortex. Trends Cogn Sci. 2011;15:85–93. doi: 10.1016/j.tics.2010.11.004. [DOI] [PMC free article] [PubMed] [Google Scholar]
- Everitt BJ, Robbins TW. Neural systems of reinforcement for drug addiction: from actions to habits to compulsion. Nat Neurosci. 2005;8:1481–1489. doi: 10.1038/nn1579. [DOI] [PubMed] [Google Scholar]
- Fox MD, Greicius M. Clinical applications of resting state functional connectivity. Front Syst Neurosci. 2010;4:19. doi: 10.3389/fnsys.2010.00019. [DOI] [PMC free article] [PubMed] [Google Scholar]
- Glascher J, Adolphs R, Damasio H, Bechara A, Rudrauf D, Calamia M, Paul LK, Tranel D. Lesion mapping of cognitive control and value-based decision making in the prefrontal cortex. Proc Natl Acad Sci U S A. 2012;109:14681–14686. doi: 10.1073/pnas.1206608109. [DOI] [PMC free article] [PubMed] [Google Scholar]
- Gu H, Salmeron BJ, Ross TJ, Geng X, Zhan W, Stein EA, Yang Y. Mesocorticolimbic circuits are impaired in chronic cocaine users as demonstrated by resting-state functional connectivity. Neuroimage. 2010;53:593–601. doi: 10.1016/j.neuroimage.2010.06.066. [DOI] [PMC free article] [PubMed] [Google Scholar]
- Kelly AM, Di Martino A, Uddin LQ, Shehzad Z, Gee DG, Reiss PT, Margulies DS, Castellanos FX, Milham MP. Development of anterior cingulate functional connectivity from late childhood to early adulthood. Cereb Cortex. 2009;19:640–657. doi: 10.1093/cercor/bhn117. [DOI] [PubMed] [Google Scholar]
- Kelly C, Zuo XN, Gotimer K, Cox CL, Lynch L, Brock D, Imperati D, Garavan H, Rotrosen J, Castellanos FX, Milham MP. Reduced interhemispheric resting state functional connectivity in cocaine addiction. Biol Psychiatry. 2011;69:684–692. doi: 10.1016/j.biopsych.2010.11.022. [DOI] [PMC free article] [PubMed] [Google Scholar]
- Koechlin E, Hyafil A. Anterior prefrontal function and the limits of human decision-making. Science. 2007;318:594–598. doi: 10.1126/science.1142995. [DOI] [PubMed] [Google Scholar]
- Koob GF, Le Moal M. Drug abuse: hedonic homeostatic dysregulation. Science. 1997;278:52–58. doi: 10.1126/science.278.5335.52. [DOI] [PubMed] [Google Scholar]
- Koob GF, Volkow ND. Neurocircuitry of addiction. Neuropsychopharmacology. 2010;35:217–238. doi: 10.1038/npp.2009.110. [DOI] [PMC free article] [PubMed] [Google Scholar]
- Lee BR, Dong Y. Cocaine-induced metaplasticity in the nucleus accumbens: silent synapse and beyond. Neuropharmacology. 2011;61:1060–1069. doi: 10.1016/j.neuropharm.2010.12.033. [DOI] [PMC free article] [PubMed] [Google Scholar]
- Mameli M, Luscher C. Synaptic plasticity and addiction: learning mechanisms gone awry. Neuropharmacology. 2011;61:1052–1059. doi: 10.1016/j.neuropharm.2011.01.036. [DOI] [PubMed] [Google Scholar]
- Mennes M, Kelly C, Zuo XN, Di Martino A, Biswal BB, Castellanos FX, Milham MP. Inter-individual differences in resting-state functional connectivity predict task-induced BOLD activity. Neuroimage. 2010;50:1690–1701. doi: 10.1016/j.neuroimage.2010.01.002. [DOI] [PMC free article] [PubMed] [Google Scholar]
- Salloum JB, Ramchandani VA, Bodurka J, Rawlings R, Momenan R, George D, Hommer DW. Blunted rostral anterior cingulate response during a simplified decoding task of negative emotional facial expressions in alcoholic patients. Alcohol Clin Exp Res. 2007;31:1490–1504. doi: 10.1111/j.1530-0277.2007.00447.x. [DOI] [PubMed] [Google Scholar]
- Seeley WW, Menon V, Schatzberg AF, Keller J, Glover GH, Kenna H, Reiss AL, Greicius MD. Dissociable intrinsic connectivity networks for salience processing and executive control. J Neurosci. 2007;27:2349–2356. doi: 10.1523/JNEUROSCI.5587-06.2007. [DOI] [PMC free article] [PubMed] [Google Scholar]
- Soon CS, Brass M, Heinze HJ, Haynes JD. Unconscious determinants of free decisions in the human brain. Nat Neurosci. 2008;11:543–545. doi: 10.1038/nn.2112. [DOI] [PubMed] [Google Scholar]
- Volkow ND, Wang GJ, Tomasi D, Baler RD. Unbalanced neuronal circuits in addiction. Curr Opin Neurobiol. 2013;23:639–648. doi: 10.1016/j.conb.2013.01.002. [DOI] [PMC free article] [PubMed] [Google Scholar]
Associated Data
This section collects any data citations, data availability statements, or supplementary materials included in this article.