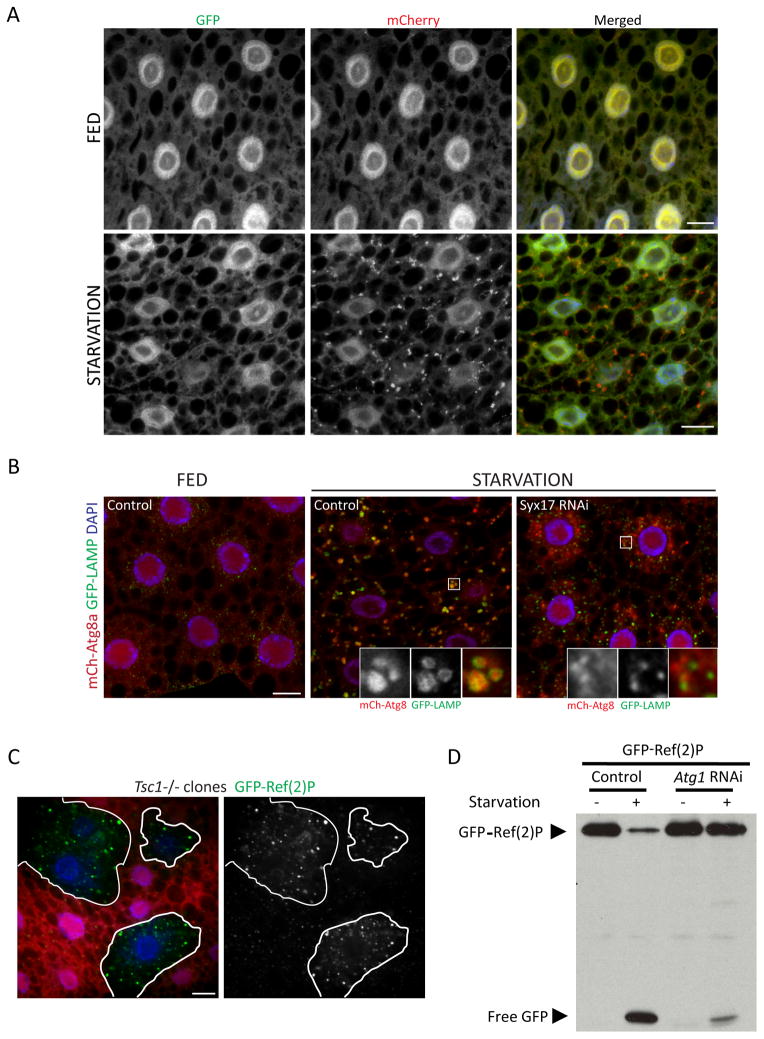
Figure 3. Assays of autophagic flux in the larval fat body.
A. Tandem-tagged GFP-mCherry-Atg8a can reveal fusion of autophagosomes with lysosomes. Under fed conditions, the green and red fluorescence of this marker display a nearly identical diffuse pattern. Upon autophagy induction by starvation, localization of this marker to punctate autophagic vesicles is evident in the red channel but not in the green channel, due to quenching of GFP fluorescence within the acidic autolysosome. Scale bars, 10μm.
B. Co-localization of Atg8a with the lysosomal marker GFP-LAMP can also be used to assess autophagosome-lysosome fusion. In these images, induction of autophagy by starvation results in accumulation of mCherry-Atg8a within vesicles marked with GFP-LAMP. Co-localization of these markers is inhibited by depletion of Syntaxin 17, a SNARE required for autophagosome-lysosome fusion. Scale bar, 10μm.
C. Accumulation of the autophagy substrate Ref(2)P can reveal a disruption of autophagy. The level of GFP-Ref(2)P within clones of Tsc1 mutant cells (marked by lack of dsRed marker; outlined in white) is increased relative to surrounding control cells, reflecting autophagy suppression in response to activated TOR signaling. Scale bar, 10μm.
D. Autophagy-dependent proteolytic cleavage of GFP-Ref(2)P, assayed by anti-GFP immunoblotting of fat body extracts. Starvation-induced autophagy results in a loss of full-length GFP-Ref(2)P and a concomitant accumulation of free GFP. Both responses are inhibited in cells depleted of Atg1.

