

Abstract
A variety of attention-related effects have been demonstrated in primary auditory cortex (A1). However, an understanding of the functional role of higher auditory cortical areas in guiding attention to acoustic stimuli has been elusive. We recorded from neurons in two tonotopic cortical belt areas in the dorsal posterior ectosylvian gyrus (dPEG) of ferrets trained on a simple auditory discrimination task. Neurons in dPEG showed similar basic auditory tuning properties to A1, but during behavior we observed marked differences between these areas. In the belt areas, changes in neuronal firing rate and response dynamics greatly enhanced responses to target stimuli relative to distractors, allowing for greater attentional selection during active listening. Consistent with existing anatomical evidence, the pattern of sensory tuning and behavioral modulation in auditory belt cortex links the spectro-temporal representation of the whole acoustic scene in A1 to a more abstracted representation of task-relevant stimuli observed in frontal cortex.
Introduction
Although a hierarchy of cortical areas has been described in the neuroanatomy of the mammalian auditory system (Hackett, 2011; Winer and Schreiner, 2010), there has been less progress in elucidating the functional role of different cortical areas in this hierarchy. Studies in the visual system have suggested that the activity of neurons in higher areas in the sensory processing hierarchy shows a greater influence of attention during task performance (Kastner and Pinsk, 2004; Maunsell and Cook, 2002). Here we investigate whether a similar hierarchy of attention exists in the auditory system and how that hierarchy extracts behaviorally relevant information from incoming sounds.
Previously, we have characterized the effects of attention at two points in the auditory cortical hierarchy of the ferret: primary auditory cortex (A1, Fritz et al., 2003) and dorsolateral frontal cortex (dlFC, Fritz et al., 2010). These findings suggest that attention selectively highlights foreground stimuli by initiating rapid, reversible changes in sensory tuning. Consistent with findings in other sensory systems (Feldman, 2009), A1 neurons undergo rapid, short-term task-dependent changes of their sensory tuning properties when an animal engages in a new auditory task that requires discrimination between spectro-temporal sound features (Edeline et al., 1993; Fritz et al., 2003). Tuning properties do not reshape completely during behavior, but instead they change in such a way as to enhance contrast between task relevant stimulus classes (David et al., 2012), and thus presumably enhance behavioral performance with the benefit of cortical filters re-tuned to the relevant task stimuli.
In contrast to primary sensory areas, responses in dlFC encode a more dynamic, abstract representation of task-relevant stimuli and other task events (Miller and Cohen, 2001). For example, dlFC activity during an auditory discrimination task reflects primarily the behavioral meaning of the signals (e.g., a warning of danger) and less their physical attributes (e.g., frequency or loudness of a tone, Fritz et al., 2010). Such frontal activity may guide behavioral decisions and motor actions and could in principle, provide the top-down signals that induce the task-related receptive field changes observed in A1 (Ahissar et al., 2009).
Observations of the qualitative difference in the nature of auditory representations in A1 and dlFC motivated us to examine neurophysiological activity in auditory cortical belt areas in the dorsal posterior ectosylvian gyrus (dPEG) of the ferret. Previous neurophysiological mapping studies of the auditory cortex in the anesthetized ferret (Bizley et al., 2005, 2007; Nelken et al., 2008) suggested the presence of two adjacent tonotopic areas (PPF and PSF) ventral to A1. Neuroanatomical studies indicate that these two tonotopic belt areas are reciprocally connected with the primary field A1 and project to higher-order auditory cortical fields, such as VP (Bizley et al., 2007; Pallas and Sur, 1993). In this study we confirmed the basic sensory tuning properties that have previously been reported in dPEG.
To explore whether the auditory representations in the two tonotopic dPEG areas in the awake, behaving ferret are intermediate between the more veridical A1 and abstract dlFC representations, we measured behaviorally-driven response plasticity in the dPEG fields as ferrets actively engaged in an auditory task that required them to distinguish between noisy sounds and pure tones. Rather than measuring behaviorally-driven changes in spectro-temporal receptive fields, as in previous studies of attention-driven plasticity in A1 (Atiani et al., 2009; David et al., 2012; Fritz et al., 2003, 2005, 2007), in this study we measured behaviorally-driven changes directly in evoked responses to task-relevant acoustic stimuli (Fritz et al., 2010). We compared these data to single-unit recordings from A1 and dlFC using the same task and stimuli for a direct comparison across areas. We found that neurons in dPEG exhibit a mixture of the sensory responses and task-related plasticity observed in A1 and dlFC, suggesting that dPEG does in fact lie at a critical stage of transformation between a faithful representation of physical stimulus properties and a representation of abstracted task-relevant categories.
Results
In order to study changes in representation across the auditory system, we recorded single-unit activity in two non-primary auditory tonotopic fields (Fig. 1) in the ferret dPEG (Bizley et al., 2005), the posterior pseudosylvian field (PPF) and posterior suprasylvian field (PSF). Neural activity was recorded in dPEG during passive listening (n=1156, 8 animals) and during an auditory task requiring the discrimination between noise and pure-tone stimuli (n=260, 7 animals, Fritz et al., 2003). We compared these data to recordings from a primary auditory area, A1, during presentation of the same stimuli (n=2448, 20 animals) and the same auditory discrimination behavior (n=283, 10 animals). Some of the A1 data was recorded for previous studies (David et al., 2012; Fritz et al., 2003, 2005) and pooled with new A1 recordings from animals in the dPEG data set.
Figure 1.
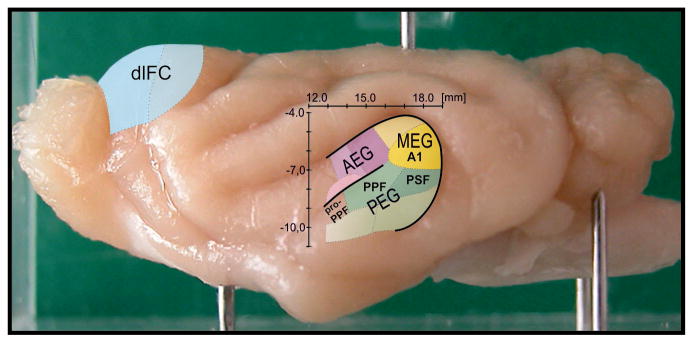
Ferret auditory and dorsolateral frontal cortex. Lateral view of the whole ferret (atlas) brain indicating location of dorsolateral frontal cortex (dlFC) and auditory cortex (AC) on the anterior, middle and posterior ectosylvian gyri (AEG, MEG and PEG). A1 is situated in posterior MEG, PPF and PSF are located in the dorsal PEG (dPEG), and pro-PPF neighbors PPF rostrally. Scales indicate stereotaxic rostrocaudal and dorsoventral position of AC in the brain. The whole ferret AC extends over ∼6 mm rostrocaudally and ∼7 mm dorsoventrally.
To study representations across the auditory processing hierarchy, we also compared task-dependent modulation of activity in the auditory cortical neurons with that of neurons in the dlFC of ferrets performing the same tone detection task. For this comparison we re-analyzed data (n=534, 5 animals) from a previously published study (Fritz et al., 2010).
Anatomical location of auditory cortical recordings
The two tonotopic auditory belt fields in dPEG are located ventral to A1 in ferret and share a common low frequency border with A1 (Bizley et al., 2005). The relative locations of PPF and PSF were functionally distinguished by an additional low frequency boundary, running roughly perpendicular to the A1 border and dorso-ventrally between the two regions (Bizley et al., 2005). Frequency reversals indicated boundaries between the three cortical fields (Fig. S1) in addition to transitions in tuning observed between A1 and dPEG (Fig. 2). The two dorsal tonotopic areas, PSF and PPF, extend approximately 2-3 mm ventral from the common low frequency border with A1 to VP, another non-primary field in auditory cortex (Bizley et al., 2007; Pallas and Sur, 1993). The posterior borders of A1 and PSF were characterized by the absence of auditory tuning and the presence of visual responses (from bordering visual cortex). Tonotopic mapping of A1, PPF and PSF allowed us to delineate areal borders that were marked with lesions for subsequent histology to confirm the location of our physiological recordings (see Methods and Fig. S1).
Figure 2.

Comparison of basic auditory tuning properties in A1 and dPEG (pooled PPF and PSF). Each histogram plots the fraction of neurons with tuning at the value specified on the horizontal axis in A1 (black) and dPEG (gray). Bars at the top in corresponding shades indicate one standard error around the mean for each area. For subplots a-c and e, all neurons with measurable auditory evoked responses were included (A1: n=2317/2532, dPEG: n=918/1130, p<0.05, jackknifed t-test). For subplots d and f, only neurons with significant phase-locking to TORCs, as measured in e, were included (A1: n=1466, dPEG n=280, SNR>0.3) (a) Best frequency. Mean A1: 4330 Hz, dPEG: 3773 Hz, p>0.1, jackknifed t-test. (b) Frequency tuning bandwidth. Mean A1: 0.95 oct, dPEG: 1.41 oct, p<0.01. (c) Onset latency. Mean A1: 15 ms, dPEG: 25 ms, p<0.0001. (d) Response duration. Mean A1: 33 ms, dPEG: 36 ms, p>0.01. (e) Signal-to-noise ratio (SNR) measured as trial-to-trial phase-locking to broadband TORC stimuli. Mean A1: 1.07, dPEG: 0.40, p<0.01. (f) STRF sparseness index, reflecting the ratio of peak magnitude to average magnitude of the STRF. Low SNR can also decrease sparseness index values; thus mean sparseness values binned by SNR, as measured in e. Error bars indicate one standard error on the mean, measured by jackknifing. Mean A1: 2.98, dPEG: 1.41, p<0.0001.
Passive auditory tuning properties
We compared auditory responses in A1 and in the dPEG fields during passive stimulus presentation to awake, quiescent ferrets. Across the entire population of cells studied, many responded reliably to tone and/or noise stimuli during passive auditory stimulation (A1, n=2317/2532; dPEG, n=918/1130, firing rate modulated from spontaneous, p<0.05, jack-knifed t-test). Passive and behaviorally modulated activity was not significantly different in the two tonotopic fields in dPEG, and hence recordings from those areas were grouped together for analysis. These results were consistent with earlier neurophysiological studies in the anesthetized ferret that found no differences in basic auditory properties between these two dPEG fields (Bizley et al., 2005).
In general, there was overlap of very basic tuning properties between A1 and dPEG, such as a similar distribution of frequency tuning in each area (Fig. 2a). However, for most of the measured tuning properties, dPEG neurons tended to span a wider range of extreme values, lending heavier tails to their distribution histograms. Thus, because a small number of neurons had very broad frequency tuning in dPEG, the average tuning bandwidth was slightly broader on average compared to A1 (Fig. 2b, p<0.01, jackknifed t-test). More substantial differences between A1 and dPEG were observed in their temporal dynamics. Overall, dPEG neurons were more sluggish than those in A1, having a propensity for longer onset latencies (Fig. 2c, p<0.0001, jackknifed t-test) and a tendency toward longer response duration (Fig. 2d, p<0.01, jackknifed t-test).
Neurons in dPEG were also less likely to produce reliable, phase-locked responses to broadband rippled noise stimuli. We measured phase-locking by a signal-to-noise ratio (SNR) of the time-varying response to temporally orthogonal ripple combinations (TORCs) commonly used to characterize spectro-temporal tuning in A1 (Klein et al., 2006). Neurons with high SNR tend to be driven reliably by the modulations in the TORC stimuli, permitting estimation of spectro-temporal receptive fields (STRFs). Compared to A1, where 58% of the cells had a signal-to-noise ratio greater than 0.3 (Fig. 2e), the proportion of neurons with the same SNR was far smaller in dPEG (25%, p<0.001, jackknifed t-test). For dPEG neurons that showed reliable phase-locked responses to TORCs, spectro-temporal receptive fields were likely to be more complex and less compact (see examples in Fig. S2). We quantified this difference by computing a sparseness index for each STRF, measured as the ratio of the peak amplitude of the STRF to the standard deviation of all STRF parameters. Because A1 STRFs tended to have more zero coefficients and thus smaller standard deviation, sparseness index values were higher in A1 than in PEG, even after controlling for differences in SNR between areas (Fig. 2f, p<0.001, jackknifed t-test).
One consequence of weaker phase-locking to TORCs was that the percentage of sound-responsive units that yielded an interpretable STRF in dPEG (25%) was far lower than in A1 (58%). Because of the relative paucity of linear responses in dPEG, it was difficult to measure STRF changes as indicators of rapid plasticity in dPEG cells, as was previously done in A1 (Fritz et al., 2003). Instead, we measured task-dependent changes in the amplitude and dynamics of PSTH responses to the reference and target sounds, as in previous studies in the frontal cortex (Fritz et al., 2010). We were able to measure tuning changes more reliably using narrowband noise as a reference stimulus in a small set of neurons (see below).
Target enhancement in PEG during behavior
We recorded the activity of a subset of auditory-responsive cells (A1, n=283; dPEG, n=260) while animals performed an auditory task in which they signaled, though avoidance behavior, the presence of a target tone in a sequence of broadband TORCs or narrowband noise stimuli (Fritz et al., 2003, 2010). Responses from each unit were recorded during behavior as well as in a passive state pre- and post-behavior. The effects of behavior were measured by comparing the PSTH response to the task stimuli between passive and behaving conditions.
When animals engaged in the task, 42% (110/260) of dPEG cells exhibited a significant change in their PSTH response to the target (red) and/or reference (blue) stimuli (p<0.05, jackknifed t-test). Among these significantly modulated neurons, changes in responses to the task stimuli varied substantially in their selectivity and magnitude, but the common trend was to enhance target responses and/or suppress reference responses (Fig. S3). The changes in some cells matched the overall trend in the population. For example, a cell that gave only weak transient responses to both reference and target stimuli during passive listening (Fig. 3a, left panel), responded less to reference sounds but gave a strong sustained response to targets during behavior (Fig. 3a, middle panel). Other cells showed effects on the response to one or the other stimulus, reducing responses to the reference (Fig. 3b) or enhancing responses to the target (Fig. 3c). Responses generally returned to their pre-passive baseline after behavior was complete (Fig. 3a,b).
Figure 3.

Raster plot comparing target (red) and reference responses (blue) for three PEG neurons, before (left column, “pre-passive”), during (middle, “active”) and after behavior (right, “post-passive”). Dashed green lines indicate sound onset and offset. Curves below the rasters show the PSTH response averaged across all target or reference sounds and using 50 ms bins (shading indicates one standard error on the mean computed by jackknifing). Gray horizontal shading in rasters indicate incorrect trials where the artifact from the punishment period was removed. (a) In this example, the neuron gave a transient response to the target tone and a sustained response to the reference noise during passive listening. During behavior, the target response became sustained and increased in overall spike rate relative to the spontaneous baseline (77%) while the reference response decreased and became slightly suppressed after the initial transient (-15%). This resulted in an overall enhancement in the target response relative to the reference response. (b) This neuron produced a positive sustained response to reference sounds but was slightly suppressed by targets during passive listening. During behavior, the target response increased slightly, but the reference response decreased substantially across the entire period of stimulation by about 40%. (c) For a third neuron, reference and target sounds produced a strong response during passive listening. During behavior, the target response increased (18%) while the reference response was slightly suppressed (-3%).
Increasing target enhancement across the auditory processing hierarchy
To contrast the patterns of rapid plasticity in dPEG and A1, we compared the activity of the 110 dPEG neurons and 155 A1 neurons that showed significant changes in their response to task stimuli (reference and/or target) during behavior (p<0.05, jackknifed t-test). Population PSTH responses were computed by normalizing each neuron's response according to its maximum magnitude and sign (enhancement or suppression relative to a spontaneous baseline averaged across all stimuli and behavior states) and then averaging PSTHs from each behavior condition across neurons in each brain area. We also computed population average PSTHs for 266 auditory neurons recorded in dlFC during the identical task (Fritz et al., 2010). Note that normalizing by sign provided a simple way to measure the magnitude of stimulus-driven responses, independent of whether they were enhanced or suppressed relative to baseline. This normalization primarily affected PSTH measurements in dlFC, for which about half the neurons (47%) were suppressed from baseline by the target sound (Fritz et al., 2010). Fewer A1 (17%) and dPEG (14%) neurons were suppressed relative to their spontaneous rate by the task stimuli, and the influence of sign normalization in these areas was minimal (Fig. S4).
The PSTH response to task stimuli showed progressively larger behaviorally-induced changes across A1, dPEG, and dlFC. In A1, there was almost no net change in the average target response during behavior (Fig. 4a), while reference responses were slightly suppressed. In dPEG (Fig. 4b), target and reference responses changed more appreciably during behavior but in opposite directions (enhancing target response and diminishing reference response), thus increasing the contrast between them. This change in contrast became nearly absolute in the dlFC, where neurons rarely responded to any stimuli during passive listening, but responded selectively only to targets during behavior (Fig. 4c). The same patterns can also be observed in individual neuron responses in the different cortical areas (Fig. S3).
Figure 4.

(a) Average behavior-dependent change in reference and target responses in A1. Left panel plots pre-passive (dashed) versus active (solid) normalized PSTH response to reference noise across all neurons that underwent a significant change in evoked response during behavior (n=155 neurons significantly modulated during behavior). The average reference response decreases slightly in these neurons. Right panel compares the average PSTH response to target tones for the same set of A1 neurons. The average target response does not change significantly during behavior. (b) Target and reference PSTH comparison for dPEG, plotted as in a (n=110). In addition to a slightly larger decrease in reference response during behavior in dPEG (right panel) than observed in A1, the average target response also increases in dPEG. (c) Target and reference PSTH comparison for dlFC (n=266). Here both the sign and magnitude of responses has been normalized so that suppression of activity by target or reference, which occurs in about 40% of cells, is plotted as a positive modulation. In dlFC, neurons show consistently very little response during passive listening and respond only to the target during behavior.
The simultaneous enhancement of target responses and suppression of reference responses produces a pattern of enhanced contrast between target and reference stimuli. To quantify changes for individual neurons, we plotted the difference between each neuron's target and reference response in the passive versus active states (Fig. 5, left column). If there was no change in contrast, e.g., if overall firing rate simply changed due to increased or decreased arousal, then all points (neurons) would lie along the diagonal line of unity slope. Instead, points tended to lie above the diagonal, reflecting an increased response to target sounds relative to reference sounds during behavior. Although some individual A1 neurons showed large changes, the overall population shift was relatively small for A1 units. The population shift was substantially larger in dPEG (three points in red in Fig. 5b correspond to the examples in Fig. 3). The behaviorally-induced change in target versus reference response was even greater in dlFC, as can be seen in the progressively shifted distributions (Fig. 5, right column). In A1, the relative selectivity to target tones increased by about 12% during behavior (n=155/283 neurons undergoing significant behavioral modulation), a change that consistent with earlier reports from STRF measurements in A1 (David et al., 2012). Using the same response measures, neurons dPEG exhibited a nearly 2-fold larger increase in selectivity (21.5%, n=110/260 modulated neurons), significantly larger than in A1 (p<0.01, jackknifed t-test). Neurons in dlFC showed a shift of about 70% (n=266/534 modulated neurons), significantly larger again than in dPEG (p<0.001, jackknifed t-test).
Figure 5.

(a) Average behavior-dependent change in reference and target responses in A1. Left panel compares the average target preference (i.e., target minus reference response) for each A1 neuron during passive listening (horizontal axis) and during behavior (vertical axis). Units that underwent significant changes in response during behavior are plotted in black (n=155/283, p<0.05, jackknifed t-test). Overlap of black and gray points reflects the fact that significance was tested by a z-score (i.e., change in mean firing rate normalized by the standard error on the mean) so that small absolute changes in firing rate can be significant if response variability is small. Right panel shows a histogram of the change in the relative target preference between passive and active conditions (i.e., distance from the diagonal in the left panel). Units with significant increases/decreases are plotted in light/dark purple. The average change in target preference during behavior in A1 was 11.9%, significantly greater than expected by chance (p<0.001, jackknifed t-test). (b) Task-dependent target versus reference changes in dPEG, plotted as in a (n=110/260 significantly modulated neurons). Together these changes lead to an overall average change in target preference of 21.5% during behavior (p<0.001, jackknifed t-test). (c) Task-dependent target versus reference changes in dlFC (n=266/530 significantly modulated neurons). Neurons in this areas undergo a much larger change, averaging a +69.8% change in target preference, reflecting the strong target-selective response that appears only during behavior (p<0.001, jackknifed t-test).
Dependence of plasticity on BF and target frequency
Contrast enhancement between target and reference responses across the neural population was dependent on baseline auditory tuning. The difference between a neuron's BF and the target tone frequency (TF) varied across recordings. When the change in target versus reference response (see Fig. 5b) is plotted as a function of the difference between each neuron's BF and TF (Fig. 6a,b), the majority of points lie above zero, reflecting the overall relative enhancement of target responses. In both areas, this change was slightly larger for neurons with BF near the target. In A1 this trend was not significant (r=-0.08), but in dPEG the negative correlation between BF-TF distance and target enhancement was significant (r=-0.23, p<0.05, jackknifed t-test).
Figure 6.

Influence of similarity between target frequency (TF) and neuronal best frequency (BF) on behavior effects. (a) Change in target preference for each A1 unit during behavior (vertical axis), plotted as a function of difference between the TF and the BF. Units that underwent significant changes in response during behavior are plotted in black (n=155/283). Smaller differences between TF and BF showed a weak trend toward greater increases in target preference (r=-0.08, p>0.05, jackknifed t-test). (b) Scatter plot of changes in dPEG, plotted as in a (n=110/260 significantly modulated neurons, r=-0.23, p<0.05, jackknifed t-test). (c) Average target enhancement index in A1 and dPEG for all neurons and after grouping according to the difference between BF and task target frequency. Error bars indicate one standard error on the mean, computed by jackknifing. In both areas, target enhancement was slightly larger for neurons with BF very similar to TF (<0.15 octave difference). Target enhancement was significantly stronger for neurons with BF-TF difference >0.15 octaves in dPEG (p<0.05) compared to A1. (d) Average fraction change in target responses for A1 and dPEG neurons, plotted as in c. Increases in target responses were greater in dPEG for the group of neurons with BF within 0.15-0.8 octaves of TF (p<0.01), suggesting that a larger pool of neurons participates in the target enhancement compared to A1. (e) Average fraction change in reference responses for A1 and dPEG neurons. Reference responses tended to decrease regardless of the BF-TF difference in both areas.
Target enhancement in both A1 and dPEG were particularly large for neurons with BF less than one-quarter of an octave from the target tone frequency (Fig. 6c). In order to understand the separate contribution of reference and target responses to the target enhancement, we considered average changes in responses to these stimulus categories after grouping neurons into equally-sized bins according to the octave distance between neuronal BF and task target frequency. This grouping revealed that changes in normalized target response depend on both the area and neuronal tuning. In A1, only neurons with BF less than 0.15 octave from TF showed significantly enhanced target responses relative to the reference response (Fig. 6d, p<0.05, jackknifed t-test). In dPEG, a larger pool of neurons, with BF less than 0.8 octave from TF, showed increased target responses (Fig. 6d, p<0.01 for both 0.15 and 0.8 oct groups, jackknifed t-test). Thus while tone-target enhancement was similar in A1 and PEG for the near-target group, the increase in tone-target response was significantly greater for the middle group in dPEG (p<0.01, jackknifed t-test). As expected, changes in broadband TORC reference responses showed no dependence on tuning. In both areas, the decrease in reference response was similar, regardless of the BF-TF difference (Fig. 6e).
Global suppression and selective target enhancement during behavior
Our comparison of auditory responses during passive listening and behavior revealed successively larger enhancement of target responses relative to reference responses through A1, dPEG, and dlFC (Fig. 5). The relatively increased response to tonal targets took place in the context of a global decrease of responses in auditory cortex during behavior, consistent with previous studies (Atiani et al., 2009; Otazu et al., 2009).
Although we were unable to recover reliable measures of spectro-temporal tuning with the TORC stimuli for most dPEG neurons, we were able to measure spectral tuning curves for a subset of dPEG cells for which we used narrowband noise as a reference sound (n=55). Data collected using this stimulus showed the same pattern of target enhancement as when TORCs were used as references, with about 35% of neurons significantly modulated during behavior (19/55, p<0.05, jackknifed t-test). In these cells, we were able to measure frequency tuning from responses to the bandpass noise reference stimuli and could determine whether task-dependent changes in frequency tuning showed any influence of the target tone frequency (Fig. 7a,b). As in the case of TORCs, the response to bandpass noise was generally suppressed during behavior. However, this suppression was significantly less for the noise band at the target frequency (Fig.7c,d). Thus, while reference responses were overall weaker during behavior, they were less suppressed (i.e., relatively larger) at the target frequency compared to other frequencies. Hence, in the behavioral state, suppressive sculpting of the response relatively spared the frequency region near the target, thus enhancing the effective contrast between target and reference. This relative enhancement is presumably what accounts for the STRF enhancement at the target frequency reported earlier in A1 (Fritz et al., 2003).
Figure 7.

(a) An example neuron showing frequency tuning for pre-passive, active behavior, and post-passive states. In this example, reference stimuli were quarter-octave bandpass noise, centered at the frequencies shown on the y-axis. During behavior, responses were suppressed overall to the reference noise, but the suppression was weaker for noise centered at the target tone frequency. (b) Tuning curves, measured from the average firing rate response from each stimulus onset to offset, show a shift in the peak of the tuning curve toward the target frequency during behavior (red line). (c) Average reference response change between behavior and passive listening for each neuron at target frequency (vertical axis) versus average response change away from the target frequency (horizontal axis) shows a significant relative enhancement at the target frequency (p<0.02, jackknifed t-test). Black dots are cells (n=19/55) that show significant target versus reference enhancement (p<0.05, jackknifed t-test). (d) Average reference and target responses during passive listening and behavior for the 19 significant cells in c.
Discussion
Receptive fields in A1 undergo rapid spectral and temporal changes during behavior that enhance the representation of acoustic features relevant to the task at hand (Edeline et al., 1993; Fritz et al., 2003, 2005). This study aimed to expand the investigation of rapid task-related plasticity into higher-order auditory areas as possible intervening stages for transforming sensory representations between A1 and the frontal cortex (Fritz et al., 2003, 2010) and to explore the process of selective attention in which representation of foreground events and features are enhanced and background events are suppressed so as to enhance sensory perception (Froemke et al., 2013). Our main finding is that a similar form of rapid task-induced plasticity occurs in the cortical belt areas in dPEG as in A1, but with much larger magnitude. The difference in the magnitude of plasticity is driven largely by a selective increase in dPEG response firing rates to target tones during behavior. This pattern of distractor suppression and selective target enhancement suggests a general mechanism by which top-down control circuits could gradually extract behaviorally relevant sensory features through a hierarchy of brain areas (Ahissar et al., 2009).
Extensive studies in the visual system have revealed a pattern of successively larger attention effects through the ascending visual cortical hierarchy (Kastner and Pinsk, 2004). A similar hierarchy of subjective sensory experience has been described in the somatosensory system, with increasing proportions of neurons in higher areas correctly predicting behavioral responses of the animal (de Lafuente and Romo, 2006). A small number of studies in the auditory system have investigated the modulatory effects of attention and behavior on responses in non-primary auditory areas in the rat (Polley et al., 2006; Takahashi et al., 2010, 2011), cat (Diamond and Weinberger, 1984), rhesus monkey (Niwa et al., 2013; Tsunada et al., 2011), and humans (Mesgarani and Chang, 2012) and found changes in receptive field plasticity that are typically greater in quantity or different in quality than observed in A1. However, direct comparisons between areas have been limited and less conclusive. By comparing the effects of an identical behavior between three different areas (A1, dPEG, and dlFC) our data suggest that the auditory, visual and somatosensory systems may have a similar hierarchical structure, in which primary areas provide veridical information about sensory inputs, while task-irrelevant (background or distracting) information to the current task is gradually suppressed as signals are transmitted through higher-order sensory areas to frontal executive areas.
Consistent with the view that perceptual decisions are represented in the frontal cortex, recent studies of premotor and prefrontal cortical neurons found distinct populations of neurons selectively encoding ‘stimulus presence’ and ‘stimulus absence’ decisions (de Lafuente and Romo, 2006; Merten and Nieder, 2012). In the go/no-go behavioral paradigm used in this study, it is crucial for the animal to rapidly identify the target stimulus and quickly cease licking after the target appears in order to avoid shock. Thus, on each trial, animals were required to make a perceptual decision about whether, or when, a target stimulus was present. As we have shown, dPEG neurons play an important role in this process of enhancing relevant target stimuli and suppressing irrelevant noisy stimuli, consistent with a model in which the critical behavioral decision is about the presence or absence of the target.
Our finding of a functional hierarchy in neurophysiological responses in a pathway leading from core auditory areas to frontal cortex is consistent with neuroanatomical data. Previous neuroanatomical studies have shown ascending projections from the primary A1 and AAF to both adjacent tonotopic belt areas PPF and PSF and from these to VP (Bizley et al., 2007; Pallas and Sur, 1993). Our preliminary neuroanatomical tracing studies suggest that the presumed parabelt areas (VP and PSSC) in turn connect to the dlFC (data not shown). Thus the functional hierarchy observed from A1 through PEG to dlFC may be mirrored in neuroanatomical pathways and projections between these areas.
We note that in addition to this auditory-to-frontal cortex pathway, there are other important parallel, linked pathways that mediate auditory attention and related cognitive processes involved in learning and decision-making. For example, the parietal cortex is known to play a key role in attention in tandem with frontal cortex (Swaminathan and Freedman, 2012). Also, the striatum is closely linked to both sensory, motor and prefrontal areas (Ding and Gold, 2010) and displays corticostriatal plasticity that enables encoding and learning of stimulus-response associations (Kreitzer and Malenka, 2008). A recent optogenetic study (Znamenskiy and Zador, 2013) has emphasized the role of the auditory-striatal projection in carrying audio-motor information that drives behavioral choices in auditory discrimination. The relative contributions of these parallel pathways in auditory attention, learning and behavioral decision-making remains to be delineated. In this study, our focus is on attention-driven, state-dependent changes in sensory tuning of neurons in auditory cortex arising when attention is focused on specific acoustic features or objects known from previously learned tasks.
In this study, the enhanced target response was accompanied by an overall decrease in responsiveness across all stimuli, regardless of neural tuning (Fig. 6). Such a global drop in firing rate is comparable to that seen earlier in similar experiments in the auditory cortex (Atiani et al., 2009; Otazu et al., 2009) and also in the somatosensory cortex (Castro-Alamancos, 2004; Fanselow and Nicolelis, 1999). Therefore, while absolute target firing rates often decreased during behavior, this drop was usually accompanied by a larger decrease in reference responses. The smaller decrease in the target response during behavior enhanced the target response relative to the reference response by about 12% in A1, and by about twice as much in dPEG (21.5%). This relative enhanced selectivity in the target frequency band is observed directly in the responses to the narrowband noise and is consistent with the STRF enhancement at the target frequency reported earlier in A1 (Fritz et al., 2003).
While the magnitude of target enhancement in A1 and dPEG can be partially explained by BF-TF distance, other factors are likely to play a role in determining behaviorally-driven effects that could not be measured significantly in the current data set. These include sensory properties such as bandwidth tuning that might predispose neurons to respond preferentially to narrowband targets or broadband references. Alternatively, top-down circuits may preferentially modulate a subset of neurons independent of their baseline tuning properties. In contrast to the sensory areas A1 and dPEG, dlFC did not show an overall decrease in firing rate during behavior, but rather a change of about 70% (increased or decreased spike rate) that was selective exclusively for target stimuli.
Previous studies of sensory activity in auditory cortical belt areas in humans (Woods et al., 2010) and in a variety of other animals including mouse (Geissler and Ehret, 2004; Stiebler et al., 1997); rat (Polley et al., 2007), bat (Kanwal and Rauschecker, 2007; Suga et al., 1990), birds (George et al., 2008), cat (Dong et al., 2013; Las et al., 2008; Lee and Middlebrooks, 2013), ferret (Bizley et al., 2005), and monkey (Kikuchi et al., 2010; Perrodin et al., 2011) have reported a wide range of complex responses and receptive fields, generally exhibiting longer response latencies and more complex response dynamics than A1. However, some of these studies (particularly those conducted in anesthetized or awake, quiescent animals) have emphasized the extensive overlap in response properties in non-primary fields and concluded that “similarities outweigh differences” (Eggermont, 1998). A few studies of auditory non-primary areas have emphasized various differences in aspects of higher-level representation, including information-bearing parameters in bat biosonar (Suga et al., 1990), pitch (Bendor and Wang, 2008), broadband versus narrowband stimuli (Rauschecker et al., 1995), “what”, “where” and/or “who” features (Las et al., 2008; Rauschecker et al., 1995; Wang, 2000), functional classes of complex signals (Cousillas et al., 2008), gestalt features (Caretta et al., 1999), and emotional association and long-term memory (Sacco and Sacchetti, 2010).
Although studies of sensory tuning in the non-behaving animal have provided a wealth of information about auditory cortex, in order to understand dynamic context-specific cortical processing it is essential to record neuronal responses in the behaviorally trained and actively behaving animal. To this end, there has also been considerable interest in describing behavioral and context-dependent plasticity of cortical receptive fields. Most previous studies of auditory cortical plasticity have focused on changes in A1, where auditory experience can have profound effects by reshaping cortical maps (Polley et al., 2006; Recanzone et al., 1993; Rutkowski and Weinberger, 2005) and transforming receptive field properties of neurons in A1 (Atiani et al., 2009; David et al., 2012; Diamond and Weinberger, 1986; Fritz et al., 2003, 2005, 2007). The precise form of this plasticity is determined by the spectral and temporal characteristics of the salient acoustic stimuli as well as task design, reward structure, motivation, training history, and state of the animal (Dahmen and King, 2007; Fritz et al., 2012; Weinberger, 2007).
Most relevant to the current study are earlier findings that cortical plasticity in non-primary auditory cortical areas may be different in form, magnitude or prevalence compared to A1 plasticity (Diamond and Weinberger, 1984; Polley et al., 2006; Puckett et al., 2007; Weinberger et al., 1984). The present study builds on a pioneering set of studies that compared receptive field plasticity in primary and non-primary fields after classical conditioning (Diamond and Weinberger, 1984, 1986; Weinberger et al., 1984) and is the first to compare real-time receptive field plasticity of individual neurons in auditory primary and belt cortex in animals performing an instrumental task. Our results are also consistent with a recent study that compared activity across ferret auditory cortex during a pitch discrimination task (Bizley et al., 2013). This study found that activity throughout auditory cortex encoded information about both stimulus acoustics and the animal's impending decision, but activity in dPEG predicted behavioral choice significantly better than activity in other areas (including primary auditory cortical areas). The accuracy with which neural activity predicted behavioral choice increased with time after stimulus onset (Bizley et al., 2013), consistent with our observation that enhancement in the target response occurs well after stimulus onset (see Fig 4b -target). Our results are also in accord with results of another recent paper on behavioral modulation of neural encoding in primary and non-primary auditory cortex (Dong et al., 2013). In agreement with our findings, this study also reaches the conclusion that the difference in representational salience between the passive and active listening conditions is stronger in higher-order auditory cortical areas, where they observed higher temporal encoding precision and neural discriminability of the task stimuli (click trains) during behavior. These behaviorally-driven changes in the temporal domain in cat non-primary auditory cortex complement our findings, which demonstrate behaviorally-driven changes in encoding in a spectral task in ferret auditory belt cortex.
In conclusion, the response properties of neurons in PEG, and their rapid plasticity during behavior, are consistent with a role for PEG as an intermediate cortical stage of attentional modulation between A1 and dlFC. Like neurons in A1, neurons in PEG continue to represent the physical characteristics of incoming acoustic stimuli, responding best to a limited range of frequencies and displaying behaviorally-driven plasticity that is strongly dependent on the proximity of the target tone frequency to the neuron's BF. At the same time, PEG neurons share properties with dlFC, representing the behavioral meaning of the sound by substantially enhancing the contrast between responses to task target and reference stimuli and hence better encoding the presence or absence of a target. These dual properties are consistent with a role for PEG as an area of converging bottom-up and top-down influences, which is functionally intermediate between A1 and dlFC, in a pathway where sounds are transformed from their acoustics to their meaning.
Experimental Procedures
Experiments probed the auditory response properties of single neurons in cortical brain areas of awake ferrets during passive listening and during performance of a discrimination task. Some data from prior recordings in primary auditory cortex (A1, n=4/12 animals) and dorsolateral frontal cortex (dlFC, n=5/5 animals) have been published previously and were reanalyzed for comparison with the data collected for this study (David et al., 2012; Fritz et al., 2003, 2010). All experimental procedures were approved by the University of Maryland Animal Care and Use Committee and conformed to standards specified by the National Institutes of Health.
Training paradigm and behavioral tasks
Adult female ferrets (n=8 for the present study, n=2 for earlier A1 studies, (Fritz et al., 2003), n=5 for an earlier dlFC study, Fritz et al., 2010) were trained on a pure tone detection task using a conditioned avoidance procedure (Fritz et al., 2003; Heffner and Heffner, 1995). Ferrets could freely lick water continuously flowing from a spout during a variable number of reference noise stimuli until they heard a pure tone (warning) target. Animals were trained to briefly stop licking after tone offset (for a minimum of 400 ms), in order to avoid a mild tail shock. Target carrier frequency varied between experiments but was held fixed during a single behavioral block. Reference signals were composed of broadband rippled noise (Klein et al., 2000) or narrowband noise stimuli.
The level (60-75 dB) and duration of reference and target sounds was the same in a single experiment. For most of training and all recording sessions, the stimulus length was 1.0 or 1.5 seconds (same duration for reference and target and fixed for a single experiment) with a 1.2 second inter-stimulus interval. Animals were trained on the task until they reached criterion, defined as consistent performance for two sessions with >80% hit rate accuracy and <20% false alarm rate for a discrimination rate > 0.65 (Fritz et al., 2003, 2010). During neurophysiological recordings, the identical set of reference and target stimuli was presented while the animal was passively listening and not engaged in a task.
Surgery
To secure stability for electrophysiological recording, a stainless steel headpost was surgically implanted on the skull. During surgery, ferrets were anaesthetized with a combination of Ketamine-Xylazine for induction and isoflurane (1-2%) for maintenance of deep anesthesia throughout the surgery. Using sterile procedure, the skull was surgically exposed and the headpost was mounted using stainless steel screws and bone cement, leaving access to auditory cortex in both hemispheres. Antibiotics and post-surgery analgesics were administered as needed following surgery.
After recovery from head-post implantation (2 weeks), the ferrets were habituated to head restraint in a customized Lucite horizontal cylindrical holder over a period of 1-2 weeks, and then re-trained to criterion on the task for an additional 2-3 weeks while restrained in the holder (Fritz et al., 2003). In addition to the ten animals that were trained on the task, additional auditory data was collected from two task-naive control ferrets. These animals received no behavioral training on the task, but like the other head-post implanted ferrets also were habituated to head restraint in the holder before physiological recording commenced.
Neurophysiological recording
Experiments were conducted in a double-walled, sound-attenuating chamber. Small craniotomies (1-2 mm diameter) were made over auditory cortex prior to recording sessions that lasted 6-8 hours. We used high impedance (2-6 MΩ) tungsten electrodes (FHC) for the neurophysiological recordings. A typical recording session used 1-4 independently moveable recording electrodes (Alpha-Omega), separated by ∼500 microns from their nearest neighbor. Electrodes were advanced until good isolation was found on the majority of the electrodes. Single units (1-2 neurons per electrode) were isolated by k-means clustering using custom MATLAB software (David et al., 2009).
Auditory field localization and connectivity analysis
Before recording activity in the non-primary (belt) tonotopic fields of the dorsal posterior ectosylvian gyrus (dPEG), initial recordings were directed to A1 by making craniotomies using external skull landmarks (for female ferrets, the approximate location of the center of A1 was 16 mm anterior to the occipital midline crest and 12 mm lateral to the mid-line). Initial measurements of BF were made using pure tones 100ms in duration, presented with a 1 second inter-stimulus interval and randomly varied in frequency to cover the tuning range of the current recording sites (3-7 octaves). Neurons were then confirmed to be in A1 based on distinctive physiological characteristics, such as latency and tuning and by their organization in a characteristic dorsal-to-ventral, high-to-low frequency tonotopic map (Bizley et al., 2005; Shamma et al., 1993).
The location and extent of the two tonotopic fields in dPEG (PPF and PSF, Bizley et al., 2005) was then determined by neurophysiological mapping. The dorsal border of the tonotopic fields was located by extending the A1 craniotomy on its ventral edge and tracing the tonotopic gradient of A1 best frequency from high to low along the dorsoventral axis until the gradient reversed and best frequency started increasing (Fig. S1). This A1/dPEG tonotopic gradient reversal coincided with a graded transition in the response properties of neurons, with generally longer latencies, greater sustained responses and weaker envelope phase-locking in dPEG than in A1 (Fig. 2), in agreement with earlier studies (Bizley et al., 2005). As previously described, the boundary along the dorsoventral axis between the more anterior field (PPF) and the more posterior field (PSF) was generally marked by another low frequency zone (Bizley et al., 2005; Nelken et al., 2008).
Consistent with previous work in the anesthetized ferret (Bizley et al., 2005), we observed similar response properties and behavioral effects in PPF and PSF in both passive and active behavioral conditions. Thus for the purposes of the present study we pooled neurons recorded from these fields into a single dPEG data set.
We marked the location of our recording sites and auditory cortical boundaries by electrolytic lesions on the low-frequency borders of A1 and the adjacent tonotopic dPEG fields (see Fig. S1, lesion sites #6,7,9). We also marked the most ventral boundaries of the PEG tonotopic fields with other adjacent auditory cortical areas in the PEG (VP) at sites where high frequency tuning abruptly jumped to low frequency tuning (see Fig. S1, lesion sites #2-5, 8). Finally, we marked a region anterior to PPF (Pro-PPF) defined by rapidly changing BFs and broad tuning (see Fig. S1, lesion site #1). Our histology confirmed the location of these sites and showed that the dorsoventral tonotopic reversal coincided with the transition from A1 to tonotopic fields PPF and PSF. Based on the histology, most of our recordings were in A1 and the two tonotopic fields PPF and PSF, although in a few cases we also recorded auditory responses in more ventral PEG areas VPc and VPr (caudal and rostral Ventral Posterior areas) and in more anterior Pro-PPF.
Stimuli
In a given block of trials, reference sounds used during behavior consisted either of temporally orthogonal ripple combinations (TORCs, Klein et al., 2000) or narrowband noise (NBN, in a smaller number of experiments n=55). In all experiments, target sounds used during behavior consisted of pure tones. TORCs were randomly chosen from a set of 30 TORCs, each was a 5 octave wide broadband noise with a dynamic spectro-temporal profile that was the superposition of the envelopes of 6 temporally orthogonal ripples. Ripples composing the TORCs had linear sinusoidal spectral profiles, with peaks equally spaced at 0 (flat) to 1.2 cycles-per-octave; the envelope drifted temporally up or down the logarithmic frequency axis at a constant velocity (4-48 Hz) (Depireux et al., 2001; Klein et al., 2000). The 5-octave TORCs varied in range over 125 Hz-4 kHz, 250 Hz-8 kHz, or 500 Hz-16 kHz, chosen to span the BFs of currently recorded neurons.
Narrowband noise (NBN) reference stimuli were constructed by logarithmically tiling a range of frequencies encompassing the BFs of neurons at the current recording sites with noise samples having either half, quarter, or eighth-octave bandwidth, and hence the NBN stimuli varied in center frequency. Each of the NBN stimuli were constructed by summing 10 to 100 tones logarithmically spaced in the desired frequency bands, rather than filtering white noise. The number of unique noise bands depended on the overall frequency range probed (typically 4-5 octaves) and the bandwidth of the noise band chosen for each experiment, and no systematic effects were observed with changes in the bandwidth of the individual noise samples.
Data Analysis
Basic auditory tuning properties were measuring using standard techniques that have been described elsewhere (David et al., 2009). Best frequency was determined by measuring the neural response to a sequence of 50-300 tones with randomly varying frequency (100 ms duration, 1 sec inter-tone interval). A Gaussian function was fit to the average spike rate during 100 ms after tone onset, as a function of tone frequency. Best frequency was taken to be the mean of that Gaussian. Response latency was computed by measuring the peri-stimulus time histogram (PSTH) response following the onset of all tones, binned at 1 ms. For other tuning properties, spectro-temporal receptive fields (STRFs) were measured from the response to passively presented TORCs by reverse correlation (Klein et al., 2000). Only neurons with significantly tuned STRFs (phase-locking index > 0.3) were analyzed for these tuning measurements. The STRF was positively rectified and averaged over time. Bandwidth was measured as the width at half-height around BF of the resulting frequency tuning curve. Response duration, similarly, was measured as the width at half-height of the rectified STRF after averaging over frequency.
Neural responses to task stimuli were measured by computing the PSTH response to stimulus sound categories, averaging across all reference noise sounds or target tones. For consistent analysis, only the first 1.0 sec of responses was considered, even when longer stimuli were used. Responses were binned at 30 bins/s and standard error on the mean PSTH was computed by jackknifing. A neuron was considered to show auditory responses if the PSTH for either stimulus class was significantly modulated from baseline firing rate (measured over 500 ms preceding sound onset) during at least two time bins (p<0.05, jackknifed t-test). For within-cell significance testing, jackknifing was performed by successively excluding different subsets of experimental trials.
A normalized response was computed by subtracting the baseline firing rate from the PSTH, dividing by the magnitude and sign of maximum modulation of the PSTH from the spontaneous baseline (either enhancement or suppression during behavior or during passive listening), and averaging over time (0-1 sec following stimulus onset). Normalization by the sign of the neural response was intended primarily to account for the large number of auditory-responsive dlFC neurons (108/266) whose firing rate was decreased from baseline by target sounds (Fritz et al., 2010). Task-dependent changes were computed as the difference in the normalized response between behavior and passive listening conditions. This produced the percent change in response as a fraction of the maximum stimulus modulation. The change was considered significant if the average spike rate was significantly different between passive listening and behavior across trials (p<0.05, jackknifed t-test).
In order to quantify the overall enhancement of target responses relative to reference responses, the target enhancement index was computed as the difference between task-dependent changes for target and reference sounds,
A value of D>0 indicated that target responses increased relative to reference responses during behavior, even if the overall response to both stimuli decreased during behavior. Population-level significance was tested by a jackknifed t-test in which successive (5%) subsets of neurons were excluded before calculating the relevant statistic.
Supplementary Material
Acknowledgments
This research was funded by grants from the US National Institutes of Health (R01 DC005779, R00 DC010439) and a grant from the Office for Naval Research (N000141210855).
Footnotes
Author Contributions: S.A., S.V.D., J.B.F. designed behavioral physiological experiments. S.A., S.V.D., D.E., M.L., J.B.F. conducted neurophysiological recordings, S.V.D. and S.A. analyzed data. J.B.F., S.V.D. and S.A.S. evaluated results. S.R.-S. processed all histological tissue, analyzed neuroanatomical results and made neuroanatomical figures. S.V.D. made all other figures. S.A., S.V.D., S.A.S. and J.B.F. wrote the manuscript.
Competing Financial Interests: The authors declare no competing financial interests.
Publisher's Disclaimer: This is a PDF file of an unedited manuscript that has been accepted for publication. As a service to our customers we are providing this early version of the manuscript. The manuscript will undergo copyediting, typesetting, and review of the resulting proof before it is published in its final citable form. Please note that during the production process errors may be discovered which could affect the content, and all legal disclaimers that apply to the journal pertain.
References
- Ahissar M, Nahum M, Nelken I, Hochstein S. Reverse hierarchies and sensory learning. Philos Trans R Soc Lond B Biol Sci. 2009;364:285–299. doi: 10.1098/rstb.2008.0253. [DOI] [PMC free article] [PubMed] [Google Scholar]
- Atiani S, Elhilali M, David SV, Fritz JB, Shamma SA. Task difficulty and performance induce diverse adaptive patterns in gain and shape of primary auditory cortical receptive fields. Neuron. 2009;61:467–480. doi: 10.1016/j.neuron.2008.12.027. [DOI] [PMC free article] [PubMed] [Google Scholar]
- Bendor D, Wang X. Neural response properties of primary, rostral, and rostrotemporal core fields in the auditory cortex of marmoset monkeys. J Neurophysiol. 2008;100:888–906. doi: 10.1152/jn.00884.2007. [DOI] [PMC free article] [PubMed] [Google Scholar]
- Bizley JK, Nodal FR, Nelken I, King AJ. Functional organization of ferret auditory cortex. Cereb Cortex. 2005;15:1637–1653. doi: 10.1093/cercor/bhi042. [DOI] [PubMed] [Google Scholar]
- Bizley JK, Nodal FR, Bajo VM, Nelken I, King AJ. Physiological and anatomical evidence for multisensory interactions in auditory cortex. Cereb Cortex. 2007;17:2172–2189. doi: 10.1093/cercor/bhl128. [DOI] [PMC free article] [PubMed] [Google Scholar]
- Bizley JK, Walker KMM, Nodal FR, King AJ, Schnupp JWH. Auditory cortex represents both pitch judgments and the corresponding acoustic cues. Curr Biol. 2013;23:620–625. doi: 10.1016/j.cub.2013.03.003. [DOI] [PMC free article] [PubMed] [Google Scholar]
- Castro-Alamancos MA. Absence of rapid sensory adaptation in neocortex during information processing states. Neuron. 2004;41:455–464. doi: 10.1016/s0896-6273(03)00853-5. [DOI] [PubMed] [Google Scholar]
- Cousillas H, George I, Henry L, Richard JP, Hausberger M. Linking social and vocal brains: could social segregation prevent a proper development of a central auditory area in a female songbird? PLoS One. 2008;3:e2194. doi: 10.1371/journal.pone.0002194. [DOI] [PMC free article] [PubMed] [Google Scholar]
- Dahmen JC, King AJ. Learning to hear: plasticity of auditory cortical processing. Curr Opin Neurobiol. 2007;17:456–464. doi: 10.1016/j.conb.2007.07.004. [DOI] [PubMed] [Google Scholar]
- David SV, Mesgarani N, Fritz JB, Shamma SA. Rapid synaptic depression explains nonlinear modulation of spectro-temporal tuning in primary auditory cortex by natural stimuli. J Neurosci. 2009;29:3374–3386. doi: 10.1523/JNEUROSCI.5249-08.2009. [DOI] [PMC free article] [PubMed] [Google Scholar]
- David SV, Fritz JB, Shamma SA. Task reward structure shapes rapid receptive field plasticity in auditory cortex. Proc Natl Acad Sci USA. 2012;109:2150–2155. doi: 10.1073/pnas.1117717109. [DOI] [PMC free article] [PubMed] [Google Scholar]
- Depireux DA, Simon JZ, Klein DJ, Shamma SA. Spectro-temporal response field characterization with dynamic ripples in ferret primary auditory cortex. J Neurophysiol. 2001;85:1220–1234. doi: 10.1152/jn.2001.85.3.1220. [DOI] [PubMed] [Google Scholar]
- Diamond DM, Weinberger NM. Physiological plasticity of single neurons in auditory cortex of the cat during acquisition of the pupillary conditioned response: II. Secondary field (AII) Behav Neurosci. 1984;98:189–210. [PubMed] [Google Scholar]
- Diamond DM, Weinberger NM. Classical conditioning rapidly induces specific changes in frequency receptive fields of single neurons in secondary and ventral ectosylvian auditory cortical fields. Brain Res. 1986;372:357–360. doi: 10.1016/0006-8993(86)91144-3. [DOI] [PubMed] [Google Scholar]
- Ding L, Gold JI. Caudate encodes multiple computations for perceptual decisions. J Neurosci. 2010;30:15747–15759. doi: 10.1523/JNEUROSCI.2894-10.2010. [DOI] [PMC free article] [PubMed] [Google Scholar]
- Dong C, Qin L, Zhao Z, Zhong R, Sato Y. Behavioral modulation of neural encoding of click-trains in the primary and nonprimary auditory cortex of cats. J Neurosci. 2013;33:13126–13137. doi: 10.1523/JNEUROSCI.1724-13.2013. [DOI] [PMC free article] [PubMed] [Google Scholar]
- Edeline JM, Pham P, Weinberger NM. Rapid development of learning-induced receptive field plasticity in the auditory cortex. Behav Neurosci. 1993;107:539–551. doi: 10.1037//0735-7044.107.4.539. [DOI] [PubMed] [Google Scholar]
- Eggermont JJ. Representation of spectral and temporal sound features in three cortical fields of the cat Similarities outweigh differences. J Neurophysiol. 1998;80:2743–2764. doi: 10.1152/jn.1998.80.5.2743. [DOI] [PubMed] [Google Scholar]
- Fanselow EE, Nicolelis MA. Behavioral modulation of tactile responses in the rat somatosensory system. J Neurosci. 1999;19:7603–7616. doi: 10.1523/JNEUROSCI.19-17-07603.1999. [DOI] [PMC free article] [PubMed] [Google Scholar]
- Feldman DE. Synaptic mechanisms for plasticity in neocortex. Annu Rev Neurosci. 2009;32:33–55. doi: 10.1146/annurev.neuro.051508.135516. [DOI] [PMC free article] [PubMed] [Google Scholar]
- Fritz JB, Shamma SA, Elhilali M, Klein D. Rapid task-related plasticity of spectrotemporal receptive fields in primary auditory cortex. Nat Neurosci. 2003;6:1216–1223. doi: 10.1038/nn1141. [DOI] [PubMed] [Google Scholar]
- Fritz JB, Elhilali M, Shamma SA. Differential dynamic plasticity of A1 receptive fields during multiple spectral tasks. J Neurosci. 2005;25:7623–7635. doi: 10.1523/JNEUROSCI.1318-05.2005. [DOI] [PMC free article] [PubMed] [Google Scholar]
- Fritz JB, Elhilali M, Shamma SA. Adaptive changes in cortical receptive fields induced by attention to complex sounds. J Neurophysiol. 2007;98:2337–2346. doi: 10.1152/jn.00552.2007. [DOI] [PubMed] [Google Scholar]
- Fritz JB, David SV, Radtke-Schuller S, Yin P, Shamma SA, Elhilali M. Adaptive, behaviorally gated, persistent encoding of task-relevant auditory information in ferret frontal cortex. Nat Neurosci. 2010;13:1011–1019. doi: 10.1038/nn.2598. [DOI] [PMC free article] [PubMed] [Google Scholar]
- Fritz JB, David SV, Shamma SA. Attention and dynamic, task-related receptive field plasticity in adult auditory cortex. In: Cohen Y, Fay R, Popper A, editors. Springer Handbook of Auditory Research, Volume: Neural Correlates of Auditory Cognition. New York: Springer; 2012. pp. 251–292. [Google Scholar]
- Froemke RC, Carcea I, Barker AJ, Yuan K, Seybold BA, Martins ARO, Zaika N, Bernstein H, Wachs M, Levis PA, et al. Long-term modification of cortical synapses improves sensory perception. Nat Neurosci. 2013;16:79–88. doi: 10.1038/nn.3274. [DOI] [PMC free article] [PubMed] [Google Scholar]
- Geissler DB, Ehret G. Auditory perception vs. recognition representation of complex communication sounds in the mouse auditory cortical fields. Eur J Neurosci. 2004;19:1027–1040. doi: 10.1111/j.1460-9568.2004.03205.x. [DOI] [PubMed] [Google Scholar]
- George I, Cousillas H, Richard JP, Hausberger M. A potential neural substrate for processing functional classes of complex acoustic signals. PLoS One. 2008;3:e2203. doi: 10.1371/journal.pone.0002203. [DOI] [PMC free article] [PubMed] [Google Scholar]
- Hackett TA. Information flow in the auditory cortical network. Hear Res. 2011;271:133–146. doi: 10.1016/j.heares.2010.01.011. [DOI] [PMC free article] [PubMed] [Google Scholar]
- Heffner HE, Heffner RS. Conditioned Avoidance. In: Klump GM, Dooling RJ, Fay RR, Stebbins WC, editors. Methods in Comparative Psychoacoustics. Basel: Birkhauser Verlag; 1995. [Google Scholar]
- Kanwal JS, Rauschecker JP. Auditory cortex of bats and primates: managing species-specific calls for social communication. Front Biosci. 2007;12:4621–4640. doi: 10.2741/2413. [DOI] [PMC free article] [PubMed] [Google Scholar]
- Kastner S, Pinsk MA. Visual attention as a multilevel selection process. Cogn Affect Behav Neurosci. 2004;4:483–500. doi: 10.3758/cabn.4.4.483. [DOI] [PubMed] [Google Scholar]
- Kikuchi Y, Horwitz B, Mishkin M. Hierarchical auditory processing directed rostrally along the monkey's supratemporal plane. J Neurosci. 2010;30:13021–13030. doi: 10.1523/JNEUROSCI.2267-10.2010. [DOI] [PMC free article] [PubMed] [Google Scholar]
- Klein DJ, Depireux DA, Simon JZ, Shamma SA. Robust spectrotemporal reverse correlation for the auditory system Optimizing stimulus design. J Comput Neurosci. 2000;9:85–111. doi: 10.1023/a:1008990412183. [DOI] [PubMed] [Google Scholar]
- Klein DJ, Simon JZ, Depireux DA, Shamma SA. Stimulus-invariant processing and spectrotemporal reverse correlation in primary auditory cortex. J Comput Neurosci. 2006;20:111–136. doi: 10.1007/s10827-005-3589-4. [DOI] [PubMed] [Google Scholar]
- Kreitzer AC, Malenka RC. Striatal plasticity and basal ganglia circuit function. Neuron. 2008;60:543–554. doi: 10.1016/j.neuron.2008.11.005. [DOI] [PMC free article] [PubMed] [Google Scholar]
- De Lafuente V, Romo R. Neural correlate of subjective sensory experience gradually builds up across cortical areas. Proc Natl Acad Sci U S A. 2006;103:14266–14271. doi: 10.1073/pnas.0605826103. [DOI] [PMC free article] [PubMed] [Google Scholar]
- Las L, Shapira AH, Nelken I. Functional gradients of auditory sensitivity along the anterior ectosylvian sulcus of the cat. J Neurosci. 2008;28:3657–3667. doi: 10.1523/JNEUROSCI.4539-07.2008. [DOI] [PMC free article] [PubMed] [Google Scholar]
- Lee CC, Middlebrooks JC. Specialization for sound localization in fields A1, DZ and PAF of cat auditory cortex. J Assoc Res Otolaryngol. 2013;14:61–82. doi: 10.1007/s10162-012-0357-9. [DOI] [PMC free article] [PubMed] [Google Scholar]
- Maunsell JHR, Cook EP. The role of attention in visual processing. Philos Trans R Soc Lond B Biol Sci. 2002;357:1063–1072. doi: 10.1098/rstb.2002.1107. [DOI] [PMC free article] [PubMed] [Google Scholar]
- Merten K, Nieder A. Active encoding of decisions about stimulus absence in primate prefrontal cortex neurons. Proc Natl Acad Sci U S A. 2012;109:6289–6294. doi: 10.1073/pnas.1121084109. [DOI] [PMC free article] [PubMed] [Google Scholar]
- Mesgarani N, Chang EF. Selective cortical representation of attended speaker in multi-talker speech perception. Nature. 2012;485:233–236. doi: 10.1038/nature11020. [DOI] [PMC free article] [PubMed] [Google Scholar]
- Miller EK, Cohen JD. An integrative theory of prefrontal cortex function. Annu Rev Neurosci. 2001;24:167–202. doi: 10.1146/annurev.neuro.24.1.167. [DOI] [PubMed] [Google Scholar]
- Nelken I, Bizley JK, Nodal FR, Ahmed B, King AJ, Schnupp JWH. Responses of auditory cortex to complex stimuli functional organization revealed using intrinsic optical signals. J Neurophysiol. 2008;99:1928–1941. doi: 10.1152/jn.00469.2007. [DOI] [PMC free article] [PubMed] [Google Scholar]
- Niwa M, Johnson JS, O'Connor KN, Sutter ML. Differences between Primary Auditory Cortex and Auditory Belt Related to Encoding and Choice for AM Sounds. J Neurosci. 2013;33:8378–8395. doi: 10.1523/JNEUROSCI.2672-12.2013. [DOI] [PMC free article] [PubMed] [Google Scholar]
- Otazu GH, Tai LH, Yang Y, Zador AM. Engaging in an auditory task suppresses responses in auditory cortex. Nat Neurosci. 2009;12:646–654. doi: 10.1038/nn.2306. [DOI] [PMC free article] [PubMed] [Google Scholar]
- Pallas SL, Sur M. Visual projections induced into the auditory pathway of ferrets II Corticocortical connections of primary auditory cortex. J Comp Neurol. 1993;337:317–333. doi: 10.1002/cne.903370212. [DOI] [PubMed] [Google Scholar]
- Perrodin C, Kayser C, Logothetis NK, Petkov CI. Voice cells in the primate temporal lobe. Curr Biol. 2011;21:1408–1415. doi: 10.1016/j.cub.2011.07.028. [DOI] [PMC free article] [PubMed] [Google Scholar]
- Polley DB, Steinberg EE, Merzenich MM. Perceptual learning directs auditory cortical map reorganization through top-down influences. J Neurosci. 2006;26:4970–4982. doi: 10.1523/JNEUROSCI.3771-05.2006. [DOI] [PMC free article] [PubMed] [Google Scholar]
- Polley DB, Read HL, Storace DA, Merzenich MM. Multiparametric auditory receptive field organization across five cortical fields in the albino rat. J Neurophysiol. 2007;97:3621–3638. doi: 10.1152/jn.01298.2006. [DOI] [PubMed] [Google Scholar]
- Puckett AC, Pandya PK, Moucha R, Dai W, Kilgard MP. Plasticity in the rat posterior auditory field following nucleus basalis stimulation. J Neurophysiol. 2007;98:253–265. doi: 10.1152/jn.01309.2006. [DOI] [PubMed] [Google Scholar]
- Rauschecker JP, Tian B, Hauser M. Processing of complex sounds in the macaque nonprimary auditory cortex. Science. 1995;268:111–114. doi: 10.1126/science.7701330. [DOI] [PubMed] [Google Scholar]
- Recanzone GH, Schreiner CE, Merzenich MM. Plasticity in the frequency representation of primary auditory cortex following discrimination training in adult owl monkeys. J Neurosci. 1993;13:87–103. doi: 10.1523/JNEUROSCI.13-01-00087.1993. [DOI] [PMC free article] [PubMed] [Google Scholar]
- Rutkowski RG, Weinberger NM. Encoding of learned importance of sound by magnitude of representational area in primary auditory cortex. Proc Natl Acad Sci U S A. 2005;102:13664–13669. doi: 10.1073/pnas.0506838102. [DOI] [PMC free article] [PubMed] [Google Scholar]
- Sacco T, Sacchetti B. Role of secondary sensory cortices in emotional memory storage and retrieval in rats. Science. 2010;329:649–656. doi: 10.1126/science.1183165. [DOI] [PubMed] [Google Scholar]
- Shamma SA, Fleshman JW, Wiser PR, Versnel H. Organization of response areas in ferret primary auditory cortex. J Neurophysiol. 1993;69:367–383. doi: 10.1152/jn.1993.69.2.367. [DOI] [PubMed] [Google Scholar]
- Stiebler I, Neulist R, Fichtel I, Ehret G. The auditory cortex of the house mouse: left-right differences tonotopic organization and quantitative analysis of frequency representation. J Comp Physiol A. 1997;181:559–571. doi: 10.1007/s003590050140. [DOI] [PubMed] [Google Scholar]
- Suga N, Olsen JF, Butman JA. Specialized subsystems for processing biologically important complex sounds: cross-correlation analysis for ranging in the bat's brain Cold Spring. Harb Symp Quant Biol. 1990;55:585–597. doi: 10.1101/sqb.1990.055.01.056. [DOI] [PubMed] [Google Scholar]
- Swaminathan SK, Freedman DJ. Preferential encoding of visual categories in parietal cortex compared with prefrontal cortex. Nat Neurosci. 2012;15:315–320. doi: 10.1038/nn.3016. [DOI] [PMC free article] [PubMed] [Google Scholar]
- Takahashi H, Funamizu A, Mitsumori Y, Kose H, Kanzaki R. Progressive plasticity of auditory cortex during appetitive operant conditioning. Biosystems. 2010;101:37–41. doi: 10.1016/j.biosystems.2010.04.003. [DOI] [PubMed] [Google Scholar]
- Takahashi H, Yokota R, Funamizu A, Kose H, Kanzaki R. Learning-stage-dependent, field-specific, map plasticity in the rat auditory cortex during appetitive operant conditioning. Neuroscience. 2011;199:243–258. doi: 10.1016/j.neuroscience.2011.09.046. [DOI] [PubMed] [Google Scholar]
- Tsunada J, Lee JH, Cohen YE. Representation of speech categories in the primate auditory cortex. J Neurophysiol. 2011;105:2634–2646. doi: 10.1152/jn.00037.2011. [DOI] [PMC free article] [PubMed] [Google Scholar]
- Wang X. On cortical coding of vocal communication sounds in primates. Proc Natl Acad Sci U S A. 2000;97:11843–11849. doi: 10.1073/pnas.97.22.11843. [DOI] [PMC free article] [PubMed] [Google Scholar]
- Weinberger NM. Auditory associative memory and representational plasticity in the primary auditory cortex. Hear Res. 2007;229:54–68. doi: 10.1016/j.heares.2007.01.004. [DOI] [PMC free article] [PubMed] [Google Scholar]
- Weinberger NM, Hopkins W, Diamond DM. Physiological plasticity of single neurons in auditory cortex of the cat during acquisition of the pupillary conditioned response: I. Primary field (AI) Behav Neurosci. 1984;98:171–188. doi: 10.1037//0735-7044.98.2.171. [DOI] [PubMed] [Google Scholar]
- Winer JA, Schreiner CE. The Auditory Cortex. New York, NY: Springer; 2010. [Google Scholar]
- Woods DL, Herron TJ, Cate AD, Yund EW, Stecker GC, Rinne T, Kang X. Functional properties of human auditory cortical fields. Front Syst Neurosci. 2010;4:155. doi: 10.3389/fnsys.2010.00155. [DOI] [PMC free article] [PubMed] [Google Scholar]
- Znamenskiy P, Zador AM. Corticostriatal neurons in auditory cortex drive decisions during auditory discrimination. Nature. 2013;497:482–485. doi: 10.1038/nature12077. [DOI] [PMC free article] [PubMed] [Google Scholar]
Associated Data
This section collects any data citations, data availability statements, or supplementary materials included in this article.