

Abstract
Fosfomycin is a broad-spectrum antibiotic that is useful against multi-drug resistant bacteria. Although its biosynthesis was first studied over 40 years ago, characterization of the penultimate methyl transfer reaction has eluded investigators. The enzyme believed to catalyze this reaction, Fom3, has been identified as a radical S-adenosyl-L-methionine (SAM) superfamily member. Radical SAM enzymes use SAM and a four-iron, four-sulfur ([4Fe-4S]) cluster to catalyze complex chemical transformations. Fom3 also belongs to a family of radical SAM enzymes that contain a putative cobalamin-binding motif, suggesting that it uses cobalamin for methylation. Here we describe the first biochemical characterization of Fom3 from Streptomyces wedmorensis. Since recombinant Fom3 is insoluble, we developed a successful refolding and iron-sulfur cluster reconstitution procedure. Spectroscopic analyses demonstrate that Fom3 binds a [4Fe-4S] cluster which undergoes a transition between a +2 “resting” state and a +1 active state characteristic of radical SAM enzymes. Site-directed mutagenesis of the cysteine residues in the radical SAM CxxxCxxC motif indicates that each residue is essential for functional cluster formation. We also provide preliminary evidence that Fom3 adds a methyl group to 2-hydroxyethylphosphonate (2- HEP) to form 2-hydroxypropylphosphonate (2-HPP) in an apparently SAM-, sodium dithionite-, and methylcobalamin-dependent manner.
Keywords: Radical S-adenosyl-L-methionine (SAM), cobalamin, iron-sulfur, fosfomycin, methylation, Streptomyces
Introduction
Fosfomycin (FM) is a clinically used broad-spectrum antibiotic that is active against several species of Gram-positive and Gram-negative bacteria. Many organisms synthesize FM, including Streptomyces wedmorensis, Streptomyces fradiae, and Pseudomonas syringae [1–3]. FM is primarily employed as a first-line single-dose treatment for uncomplicated urinary tract infections [4, 5]. However, since FM has a unique mechanism of action, it is also useful in combination therapy against multi-drug resistant microbes such as methicillin- and vancomycin-resistant strains of Staphylococcus aureus and Enterococcus [6–8].
The biosynthesis of FM was first investigated approximately 40 years ago. In Streptomyces, the pathway contains five steps which have been elucidated through genetic and biochemical studies (Scheme 1) [1, 2, 9–12]. In the penultimate step, 2-hydroxyethylphosphonate (2-HEP) is methylated at the C-2 position to generate S-2-hydroxypropylphosphonate (2-HPP) (Scheme 1, step 4). This is the only reaction in FM biosynthesis that has not yet been reconstituted in vitro. An enzyme designated Fom3 is believed to catalyze this difficult methylation reaction on the basis of both knockout studies and the characterization of other enzymes in the pathway [3, 12]. Sequencing information and experimental evidence have led to the hypothesis that the methyl group donor for the reaction is the vitamin B12 derivative, methylcobalamin (CH3-Cbl(III)) [13–15]. The Fom3 sequence contains two conserved regions of amino acids found in cobalamin (Cbl)-binding proteins such as Cbl-dependent methionine synthase (MetH), methylmalonyl-Coenzyme A mutase, and glutamate mutase, suggesting that Fom3 requires Cbl for catalysis [13]. Further evidence for the role of Cbl in the Fom3 reaction was obtained through experiments with S. wedmorensis, which indicated that CH3-Cbl(III) acts as the methyl group donor in FM biosynthesis [14, 15].
Scheme 1.

Fosfomycin biosynthetic pathway in S. wedmorensis.
Fom3 was identified as a radical S-adenosyl-L-methionine (SAM) enzyme superfamily member since it contains the radical SAM hallmark CxxxCxxC amino acid motif [13]. Radical SAM enzymes use this motif together with a molecule of SAM to bind and generate a reduced [4Fe-4S]+1 cluster that donates an electron to reductively, homolytically cleave SAM. This produces the highly reactive 5′-deoxyadenosyl radical (Ado-CH2•) which abstracts a hydrogen atom from a normally unreactive site to produce a substrate radical and initiate a difficult chemical transformation (Scheme 2) [16].
Scheme 2.
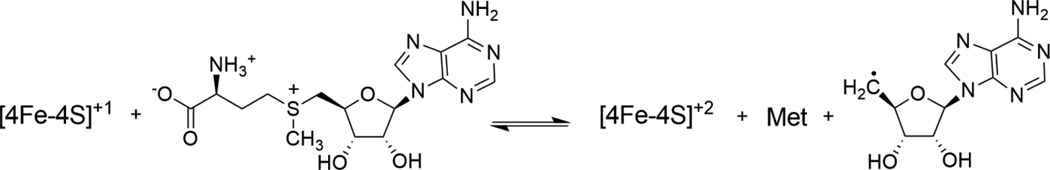
SAM reductive cleavage catalyzed by radical SAM enzymes.
Although Fom3 is believed to catalyze the methylation reaction depicted in Scheme 1, the enzyme has not yet been biochemically characterized and the precise mechanism for methylation remains unknown. Here we describe the overexpression, refolding, reconstitution, and characterization of Fom3 from S. wedmorensis. We show that the enzyme binds a [4Fe-4S] cluster that is ligated by essential residues in the radical SAM CxxxCxxC motif. In addition, we demonstrate spectroscopic evidence that purified Fom3 indeed adds a methyl group to 2-HEP in order to produce 2-HPP. The methylation activity appears to be dependent on SAM, sodium dithionite, and CH3- Cbl(III). We compare our results with those observed by our and other groups for other Cbl-dependent radical SAM methyltransferases.
Materials and Methods
Materials
All DNA-modifying enzymes with their respective buffers were from New England Biolabs (Ipswich, MA) or from Novagen/EMD Millipore/Merck KGaA (Darmstadt, Germany). Primers were purchased from Sigma-Aldrich (St. Louis, MO) or Eurofins MWG Operon (Huntsville, AL). Reagents were obtained from EMD Millipore/Merck KGaA (Darmstadt, Germany), Thermo Fisher Scientific (Waltham, MA), Research Products International Corporation (Mount Prospect, IL), Amresco (Solon, OH), Teknova (Hollister, CA), Spectrum Chemical Mfg. Corp. (Gardena, CA), Sigma- Aldrich, MP Biomedicals (Santa Ana, CA), and Cambridge Isotope Laboratories (Tewksbury, MA).
Cloning of fom3 from S. wedmorensis ( GenBank Accession BAA32490.1)
S. wedmorensis was obtained from the United States Department of Agriculture-Agricultural Research Service (USDA-ARS) Culture Collection. Genomic DNA was isolated using the Wizard Genomic DNA purification kit (Promega, Madison, WI) and the fom3 gene was amplified using the polymerase chain reaction (PCR). For subsequent ligation into the pET-30a(+) vector (EMD Millipore/Merck KGaA) for overexpresion as the “native” protein, the forward primer was 5′-AAATAT CAT ATG ACG ATC GGT T-3′ and the reverse primer was 5′-TTTT GCG GCC GC TCA GTA CTG GTT TGC-3′. The restriction sites for NdeI and NotI, respectively, are underlined in each primer. For overexpression as a hexahistidine-tagged protein from the pET-46Ek/LIC vector (EMD Millipore/Merck KGaA), the forward primer was 5′-GAC GAC GAC AAG ATG ACG ATC GGT TCT-3′ and the reverse primer was 5′-GAG GAG AAG CCC GGT CAG TAC TGG TTT GC-3′. The ligation-independent cloning (LIC) extension is underlined in each primer. Each PCR reaction included 5 µL 10x KOD Hot Start polymerase buffer, 3 µl 25 mM magnesium sulfate, 5 µL 2 mM deoxynucleotide triphosphates (dNTPs), 1.5 µL each of 10 µM stocks of the forward and reverse primers, 1 µL of KOD Hot Start polymerase, and 33 µL of molecular grade water containing S. wedmorensis genomic DNA for a final reaction volume of 50 µL. The PCR parameters consisted of an initial 2 min incubation at 95 °C followed by 40 cycles of 20 s at 95 °C, 10 s at 62 °C, and 40 s at 70 °C. The amplification products were electrophoresed on a 1% agarose gel in modified Tris-acetate-ethylenediamine tetraacetic acid (TAE) buffer (Millipore/EMD Merck KGaA) and purified using Montage gel extraction spin filters (Millipore/EMD Merck KGaA). The restriction digests and ligation of fom3 into pET-30a(+) were performed using standard molecular biology techniques. Annealing of fom3 into pET-46Ek/LIC was performed according to the manufacturer’s instructions. NovaBlue GigaSingles competent cells (EMD Millipore/Merck KGaA) were used for transformation. Plasmids were isolated with the Qiaprep Spin Miniprep Kit (Qiagen, Valencia, CA) and sequenced to confirm the correct clone.
Overexpression and purification of Fom3, His-Fom3, and His-Fom3 variants
Fom3 was overexpressed in Escherichia coli Rosetta 2 (DE3) pLysS cells (EMD/Merck KGaA) and purified by modifying previously published procedures [17, 18]. 1 L of culture yielded ~2 g cell paste, and the typical yield of Fom3 was ~8 mg/g of cell paste. Protein concentrations were estimated using the method of Waddell [19]. Fom3 was ~75% pure as estimated by sodium dodecyl sulfate-polyacrylamide gel electrophoresis (SDS-PAGE).
Overexpression of recombinant hexahistidine-tagged proteins (His-Fom3) from the plasmids denoted Fom3-pET-46, Fom3 C282A pET-46, Fom3 C286A pET-46, Fom3 C289A pET-46, and the triple mutant Fom3 C282A/C286A/C289A pET-46 was carried out as described above except that carbenicillin (100 µg/mL) was used for selection. Cell lysis and urea solubilization of His-tagged protein was performed as described elsewhere [18]. The urea supernatant was then filtered through a 0.45 micron syringe filter (Sartorius, Goettingen, Germany) and loaded onto an immobilized metal affinity column (IMAC; TSKgel Chelate-5PW, 21.5 mm×15 cm, Co2+, Tosoh Biosciences) equilibrated with 20 mM potassium (K+) 4-(2-hydroxyethyl)piperazine-1-propanesulfonic acid (EPPS) and 1 mM magnesium sulfate (Buffer A) containing 6 M urea and 300 mM sodium chloride (to give Buffer B) and connected to a high performance liquid chromatography (HPLC) instrument (LC-20AB, Shimadzu). Protein was eluted using a linear gradient over 60 min at 3 mL/min of 0–1 M imidazole in Buffer B. Fractions containing the desired protein were pooled and supplemented with SAM (0.4 μmol/g cells), ferrous ammonium sulfate (1.5 μmol/g), sodium sulfide (1.5 µmol/g), and dithiothreitol (DTT, 150 µmol/g). The mixture was diluted by adding tenfold Buffer A with 5 mM DTT and allowed to refold overnight. The protein was then concentrated using Ultrafree-15 centrifugal filter units (EMD Millipore/Merck KGaA, Darmstadt, Germany) and reconstituted as described elsewhere [18]. The typical yield of His-Fom3 using this procedure was ~5 mg from 1 g of cell paste. The protein was ~90% pure as assessed by SDS-PAGE. All proteins were frozen in the anaerobic chamber and stored in liquid nitrogen until use.
Size-exclusion chromatography (SEC)
Purified Fom3 and His-Fom3 were thawed at room temperature (20 °C) in an anaerobic chamber. A G4000SW column (21.5 mm×30 cm, Tosoh Bioscience, 2–7000 kDa calibration range) was connected to the HPLC and equilibrated in Buffer A. An isocratic elution at 2 mL/min in Buffer A was employed. Thyroglobulin (669 kDa), apoferritin (443 kDa), β-amylase (200 kDa), alcohol dehydrogenase (150 kDa), albumin (66 kDa), and carbonic anhydrase (29 kDa) standards (Sigma-Aldrich) were used to establish a standard curve.
Iron and sulfide content determination
The amount of iron and sulfide bound by recombinant proteins was determined in the anaerobic chamber using methods described elsewhere [20–22]. An 8453 spectrophotometer (Agilent Technologies, Santa Clara, CA) was used for measurements. For iron determination, a standard curve was made by treating 1–25 nmol of ferric chloride and measuring the resulting absorbances at 593 nm. 0.5–3 nmol of protein was used to determine the amount of protein-bound iron. For sulfide determination, a standard curve was generated by treating 1–10 nmol of sodium sulfide and measuring the resulting absorbances at 670 nm. ~0.5 nmol protein was used to determine the amount of protein-bound sulfide.
2-HEP and 2-HPP syntheses
2-HEP was synthesized according to a literature procedure [23]. 2-HPP was synthesized by modifying a published procedure [24]. To 1 g dimethyl (5.1 mmol) 2-oxopropylphosphonate (95%, Acros Organics) was added 30 mL methanol and 1.92 g (51 mmol) sodium borohydride. This solution was stirred at room temperature (20 °C) for 1 h before 2 mL 1M hydrochloride was added. The cloudy mixture was stirred an additional 1 h, and then the solvent was removed via rotary evaporation, leaving a white solid. This was dissolved in 20 mL water and extracted with ethyl acetate (3 X 30 mL). After concentration by rotary evaporation, 50 mL methylene chloride, 3 mL TMSBr (23 mmol), and 1 mL allyltrimethylsilane (6.3 mmol, 97%, Acros Organics) were added, and the mixture was refluxed at 50 °C for 6 h. The solvent was removed by rotary evaporation, leaving a yellow oil. To generate the ammonium salt, 10 mL water and 1.21 g (15.3 mmol) ammonium bicarbonate were added, and the water was removed by rotary evaporation. The white solid was washed with chloroform (3 X 10 mL) to give the final compound. 1H NMR (600 MHz, D2O): δ 1.25 (3H, d), δ 2.00 (2H, ddd), δ 4.15 (1H, dm). 31P NMR (242 MHz, D2O): δ 21 (s).
Electron paramagnetic resonance (EPR) sample preparation and spectral collection
Fom3 (~100 µM), His-Fom3 (~100 µM), and the His-Fom3 variants (~50 µM) were thawed in an anaerobic chamber at room temperature (~20 °C). The appropriate protein was mixed with various combinations of the following components: sodium dithionite (1–40 mM), SAM (0.5–1 mM), 2-HEP (1 mM), and/or CH3-Cbl(III) (0.5–1 mM). After ~2 h incubation, the samples were transferred to 4 mm EPR tubes (Norell, Landsville, NJ), frozen in cold isopentane (~77 K), removed from the anaerobic chamber, and stored in liquid nitrogen.
Low temperature X-band EPR spectra for untagged Fom3 were acquired on a Bruker EMXplus spectrometer equipped with a Bruker EMXpremium microwave bridge, an Oxford Instruments ESR 900 continuous flow cryostat, and an Oxford Instruments ITC503 temperature controller. Bruker Xenon software (version 1.1b50) was used to acquire and manipulate spectra (Software version 1.1b50). The following conditions were used for spectral collection: 9.379 GHz, 16 G modulation amplitude, 3400 G center field, 1000 or 5000 G sweep width, 1 mW power, 0.3 s time constant, 10K, 4 X 2 min scans. Low temperature X-band EPR spectra for His-Fom3 and the His-Fom3 mutants were obtained on a Varian Line spectrometer equipped with a Varian E102 microwave bridge, an Oxford Instruments ESR-900 continuous flow helium cryostat, and an Oxford Instruments 3120 temperature controller. The Xemr program (Jussi Eloranta, http://www.csun.edu/~jeloranta/xemr) was employed to acquire and process EPR spectra. A Varian gaussmeter was used to measure the magnetic field strength. A Hewlett-Packard 5225A frequency converter and 5245L electronic counter were used to measure the frequency. A Hewlett-Packard 432A power meter was employed to calibrate the microwave power. Spectra were recorded under the following conditions: 9.252 GHz, 16 G modulation amplitude, 3400 G center field, 1000 G sweep width, 1 mW power, 0.3 s time constant, 10K, 4 X 2 min scans.
Enzymatic assays and nuclear magnetic resonance (NMR) spectral collection
His-Fom3 was thawed in the anaerobic chamber and exchanged into Buffer A in D2O using a PD-10 desalting column (Sephadex G-25, GE Healthcare, Fairfield, CT). The protein (~100 µM) was then incubated with sodium dithionite (4–5 mM) for ~2 h. SAM (1 mM), 2-HEP (1 mM), and/or CH3-Cbl(III) (1 mM) were added to give a final reaction volume of 600–1000 µL. Control reactions were set up in which one or more of these components were omitted. Reactions were incubated for at least 18 h in the anaerobic chamber at room temperature (~20 °C) before NMR spectral collection. 1H and 31P NMR spectra were collected at the Washington State University NMR Center using a Varian 600 MHz spectrometer at 22 °C.
Results and Discussion
Here we report the first biochemical characterization of the S. wedmorensis Fom3 methyltransferase, which has been proposed to catalyze the penultimate step of FM biosynthesis. The gene encoding fom3 was amplified from S. wedmorensis genomic DNA and cloned into pET-30a and pET-46Ek/LIC for expression as both native wild-type (WT) Fom3 and N-terminal hexahistidine tagged WT His-Fom3 protein. When overexpressed in E. coli, these recombinant proteins were found exclusively in inclusion bodies. Multiple methods, including overexpression in Streptomyces lividans [25]; anaerobic overexpression in E. coli [26]; co-overexpression in E. coli with Fe-S cluster assembly proteins from the isc operon from Azotobacter vinelandii [27–30]; and overexpression in E. coli in minimal media under specific conditions to increase Cbl uptake [31, 32], were tested in an attempt to obtain soluble Fom3 from E. coli and Streptomyces lividans. The enzyme remained insoluble in all cases. Therefore, we adapted a literature procedure for the refolding of a corrinoid Fe-S protein to obtain soluble Fom3 [17]. This procedure was modified for refolding in the presence of SAM instead of CH3-Cbl(III) to avoid inadvertent cleavage of the carbon-cobalt bond and to stabilize the hypothesized [4Fe-4S] cluster [18]. After refolding and concentration, the protein was reconstituted with additional iron and sulfide to maximize cluster formation. Using these methods, 1 L of culture typically yielded ~17 mg of ~75% pure Fom3 as estimated by SDS-PAGE (Supplementary Figure 1A). To increase purity, we purified His-Fom3 under denaturing conditions with IMAC. We successfully recovered large amounts (~10 mg/mL, 5 mL/6 L culture) of ~90% pure His-Fom3 (Supplementary Figure 1B). Both Fom3 and His-Fom3 were dark brown to black in color. SEC was performed to determine the quaternary structure of the protein. Both untagged Fom3 and His-Fom3 eluted as single peaks at a rate equivalent to thyroglobulin (~669 kDa). Since the molecular weight of a Fom3 subunit is 60.4 kDa, this SEC result suggests that Fom3 exists as a large multimer, possibly a decamer or dodecamer. The use of SEC did not result in a significant increase in purity.
Spectrophotometric experiments, iron and sulfide analyses, and spectroscopic studies demonstrated that, as hypothesized, Fom3 and His-Fom3 harbor a [4Fe-4S] cluster characteristic of radical SAM enzymes. Each protein displayed a UV-Vis spectrum with a broad shoulder and an absorbance maximum at ~420 nm (Fom3) and ~400 nm (His-Fom3) (Supplementary Figure 2). Such spectra are characteristic of proteins containing a [4Fe-4S]+2 cluster [33, 34]. Iron-sulfide analyses of Fom3 (5.7 ± 0.7 mol iron/mol protein and 7.5 ± 1.0 mol sulfide/mol protein) supported the assignment of a single [4Fe-4S] cluster. In contrast, His-Fom3 unexpectedly bound sufficient iron and sulfide for four [4Fe-4S] clusters (17.2 ± 1.9 mol iron/mol protein and 15.9 ± 1.7 mol sulfide/mol protein). Low-temperature EPR studies provided additional information regarding the similarities and differences between Fom3 and His-Fom3. As-isolated His-Fom3 displayed a strong EPR signal indicative of an oxidized Fe-S cluster. Based upon the observed g-value of 2.09, this is likely either a [4Fe-4S]+3 cluster and/or is due to iron binding at the hexahistidine tag [26, 35, 36] (Figure 1A). Incubation of His-Fom3 with DTT resulted in an EPR-silent species (Figure 1B), consistent with reduction of the cluster to the resting [4Fe-4S]+2 state. In contrast, an EPR sample containing only as-purified Fom3 showed very little signal, suggesting that this enzyme ligates the complete [4Fe-4S]+2 cluster (Supplementary Figure 3A). A wide-field scan of both proteins (Supplementary Figure 4) indicates that free iron is present in both samples (g=4.28).
Figure 1.

EPR spectra of His-Fom3. A: Bottom, His-Fom3 as purified, Middle, His- Fom3 + DTT, Top, His-Fom3 + DTT + 40 mM dithionite. B: Bottom, His-Fom3 + DTT + 20 mM dithionite, Middle, His-Fom3 + DTT + 20 mM dithionite + SAM, Top, His-Fom3 + DTT + 20 mM dithionite + SAM + 2-HEP + CH3-Cbl(III).
In the presence of sodium dithionite, a chemical reductant commonly used to generate the [4Fe-4S]+1 cluster in radical SAM enzymes, both Fom3 and His-Fom3 displayed an EPR signal (centered at g=1.93 and 1.91, respectively) consistent with a [4Fe-4S]+1 cluster (Supplementary Figure 3B and Figure 1) [16, 37]. The presence of such a cluster is required by radical SAM enzymes for catalysis. Addition of SAM to either protein incubated with dithionite resulted in new features in the EPR spectrum at g=2.04 (Supplementary Figure 3C and Figure 1B). These changes in lineshape indicate that SAM resides near the cluster and affects its environment [38, 39]. When all hypothesized reaction components were included in EPR samples, decreases in the resulting spectral intensities near g=1.91 were observed (Supplementary Figure 3D and Figure 1B). These observations are consistent with loss of an electron from the [4Fe-4S]+1 cluster and support the hypothesis that Fom3 uses its Fe-S cluster for radical SAM chemistry (Scheme 2).
To determine the role and importance of the cysteine residues in the canonical radical SAM CxxxCxxC motif and to verify whether this methyltransferase binds more than one Fe-S cluster, we generated individual His-Fom3 variants. Each cysteine of the motif was separately mutated to alanine (C282A, C286A, and C289A). In addition, one triple-variant was generated in which all three cysteine residues were mutated to alanines (C282A/C286A/C289A). We overexpressed, refolded, purified, and reconstituted the four His-Fom3 variants using the same methods developed for WT His-Fom3. The variants containing a single cysteine to alanine substitution (C282A, C286A, and C289A) behaved like WT during early manipulations and appeared dark grey to black in color. However, the alanine variants precipitated considerably when concentrated. Thus, the final yield of each variant was only ~5–8 mg per 1 L of cell culture compared to ~17 mg/L for WT. The His-Fom3 C282A/C286A/C289A triple-variant was very unstable and precipitated during purification and subsequent manipulation for experiments. Interestingly, the triple-variant appeared dark grey in color even after dialysis. None of the individual cysteine-to-alanine His-Fom3 variants were able to produce the catalytic [4Fe-4S]+1 cluster as illustrated by EPR spectral collection and analysis (Figure 2). Each EPR spectrum depicts a weak signal for an oxidized or incomplete cluster while addition of dithionite results in an EPR-silent species. Furthermore, the triple-variant was EPR silent with and without dithionite, suggesting that it completely lacked the [4Fe-4S] cluster (Figure 2D). Clearly, cysteines 282, 286, and 289 in the conserved radical SAM CxxxCxxC motif are essential for cluster binding. These results also indicate that His-Fom3 only binds a single [4Fe-4S] cluster. Thus, the iron-sulfide analysis results indicating that His-Fom3 binds four times as much iron and sulfide as expected are likely due to adventitious hexahistidine binding of iron and sulfur.
Figure 2.

EPR spectra of His-Fom3 variants. Panels A: C282A, B: C286A, C: C289A, D: C282A/C286A/C289A. Bottom spectrum (A-D.): protein only. Top spectrum (A-D).: protein + dithionite.
Since our spectroscopic results supported the hypothesis that Fom3 and His- Fom3 are radical SAM enzymes, we set out to observe methylation activity in vitro. We and others hypothesize that Fom3 uses radical SAM characteristic chemistry to generate Ado-CH2•, which could subsequently abstract a hydrogen atom from the C-2 position of 2-HEP to generate a substrate radical and 5'- deoxyadenosine (Ado-CH3)(Scheme 3) [40, 41]. Under biologically relevant conditions, CH3-Cbl(III) has been shown to methylate organic radicals [42]. Therefore, the 2-HEP substrate radical could react with CH3-Cbl(III) to yield 2-HPP and Cbl(II) (Scheme 3) [40, 41]. This proposed radical SAM mechanism implies that Fom3 is a suicide enzyme in vitro, as the cluster is trapped in the resting [4Fe-4S]+2 state and CH3-Cbl(III) is converted to inactive Cbl(II) [41, 43]. In addition, distinguishing the Fom3 substrate and product, 2-HEP and 2-HPP, is difficult because these phosphonates are very chemically similar, highly charged compounds lacking ultraviolet handles. For all of these reasons, detection of Fom3 activity is particularly challenging.
Scheme 3.

Hypothesized Fom3 reaction mechanism.
To address these difficulties, we developed an in vitro system using 31P NMR spectroscopy to assess the methylation activity of these enzymes. The 31P NMR signals for 2-HEP and 2-HPP vary depending on pH. Thus, slight shifts are inevitable due to the final pD of the solution. At pD ~8, the phosphorus signal for 2-HEP is a singlet at ~19.5 ppm, while the signal for 2-HPP is a singlet at ~20.5 ppm (Figure 3A). In our hands, the level of detection is ~10 µM phosphonate, although significant background noise is observed in the presence of high concentrations of other phosphorus-containing compounds such as CH3-Cbl(III). We chose to assay His-Fom3 because it was more pure than the native protein and because our EPR studies indicated that we could reduce its [4Fe-4S] cluster to the +1 state. In order to maximize the amount of product formation in a particular reaction, we exchanged purified His- Fom3 into deuterated buffer at high concentrations. The protein was then incubated with dithionite to reduce the [4Fe-4S] cluster to the +1 state required for activity. Finally, we added SAM and the proposed substrates, 2-HEP and CH3-Cbl(III), to the reduced protein and allowed the reaction to incubate anaerobically prior to NMR analysis. To obtain maximal product formation, we routinely incubated these mixtures overnight. After an ~18 hr incubation, a 31P signal at ~20.5 ppm, corresponding to 2-HPP, was observed in a sample containing His-Fom3, dithionite, SAM, 2-HEP, and CH3-Cbl(III) (Figure 3B). Formation of the 2-HPP product was observed only in reactions which contained all hypothesized radical SAM reaction components including His-Fom3, dithionite, SAM, 2-HEP, and CH3-Cbl(III) (Figure 3B, compare Supplementary Figure 5). Although the NMR spectrum in Figure 3B appears to indicate that the amounts of 2- HEP and 2-HPP are nearly equimolar (inset, Figure 3B), this is not the case. The starting amounts of 2-HEP and CH3-Cbl(III) were both 1 mM. While the CH3-Cbl(III) peak (0 ppm 31P) remains approximately 1 mM, both the 2-HEP (19 ppm 31P) and 2- HPP (20 ppm 31P) peaks are significantly smaller. Integration of the resulting peaks indicated ~160 µM 2-HEP remained while ~60 µM 2-HPP was apparently formed. Due to the large amount of protein used (~100 µM), significant protein precipitation was observed in the sample together with loss of the substrate. All three peaks demonstrated significant broadening compared to control spectra which did not contain protein. The observed broadening is likely due in part to quenching of spectra due to binding of free high spin Fe+3 and/or Fe+2 to the phosphonate substrate and product and the phosphate group of CH3-Cbl(III). Another reason for this observed result is the high concentration of protein (~100 µM) binding the phosphonates and affecting spin relaxation times [44]. We have tried a variety of methods including acid or base treatment of the samples or HPLC in an attempt to remove the protein while retaining the small molecules in an effort to improve NMR resolution. However, none of these methods have improved detection and/or resolution. Acid precipitation of Fom3 resulted in a significant loss of substrate (and conceivably product) detectable by NMR.
Figure 3.

31P NMR spectra, pD ~8. A: Control spectrum of 2-HEP and 2-HPP; B and inset: His-Fom3 in vitro methylation activity; the signal at 0 ppm corresponds to the phosphate of CH3-Cbl(III).
These reported results remain preliminary since we have not yet observed consistent turnover. This is likely due to both low in vitro activity of Fom3 together with our relatively low-resolution assay method. For these reasons, we have been unable to determine the minimum amount of time required to produce observable product formation or to perform kinetic experiments at different time points. We are currently investigating other assay methods, including two-dimensional H-P gradient heteronuclear single quantum correlation (gHSQC) NMR spectroscopy, mass spectrometry, and coupled and/or bioassay techniques [18, 45]. To date, none of these methods have proven more useful than our original one-dimensional 31P experiment. Our collaborative attempts at mass spectrometric analyses have been hindered due to the polarity of 2-HEP and 2-HPP, which elute together in the void volume when chromatographed by reverse-phase [46]. Thus, at this time, we are unable to convincingly demonstrate catalysis by mass spectrometry. We are now focusing upon the native version of Fom3 for observation of catalysis, since the data presented above regarding the [4Fe-4S] cluster indicate that the hexahistidine-tag of Fom3 may interfere with cluster formation and subsequent activity. To date, we have not yet observed greater activity using native Fom3 compared to His-Fom3, but we continue to investigate both forms of the recombinant enzyme.
With these studies, Fom3 joins the ranks of the growing number of Cbl-dependent radical SAM methyltransferases. Members of this family that have recently been characterized include PhpK, the P-methyltransferase from Kitasatospora phosalacinea [18]; TsrM, the tryptophan methyltransferase from Streptomyces laurentii [47]; and GenK, the gentamicin X2 methyltransferase from Micromonospora echinospora [48]. Based upon sequence similarity, Fom3 is most like PhpK, which suggests that Fom3 and PhpK may share mechanistic features. However, from a chemical standpoint, Fom3 may be viewed as potentially most similar to GenK because both apparently methylate sp3-hybridized carbon atoms. GenK requires a strong reducing agent for activity and produces Ado-CH3 as a stoichiometric product [48], which provides evidence for the use of radical SAM chemistry by this enzyme family. In contrast, TsrM was unexpectedly active in the absence of dithionite or any other reductant tested [47]. These reported results conflict with the proposed mechanism for Cbl-dependent radical SAM methyltransferases and differ from all other characterized radical SAM enzymes [16, 40, 41]. The mechanism for PhpK remains unclear, as both radical chemistry and nucleophilic substitution are possibilities. Our work on Fom3 sets the stage for future studies that will shed light on these mechanistic discrepancies and ultimately add to the growing repertoire of chemical reactions known to be catalyzed by radical SAM superfamily members.
Supplementary Material
Highlights.
Purification of a 2-hydroxyethyphosphonate methyltransferase from Streptomyces
Investigation of an iron-sulfur cluster characteristic of radical SAM enzymes
Phosphorus NMR assay method
Activity depends on reducing agent, SAM, and cobalamin
Acknowledgments
We thank Dr. George Reed for the use of his EPR spectrometers, assistance with spectral collection and interpretation, and insightful discussions; Kenneth Johnson for technical assistance with EPR; Dr. William H. Johnson, Jr., for assistance with organic synthesis; Dr. Greg Helms and Dr. Kaifeng Hu for assistance with NMR; Dr. Dennis Dean for the gift of the isc gene cluster plasmid; Drs. Herng-Hsiang (Stony) Lo, Maria Person, and Gerhard Munske for mass spectroscopic assistance; and Marshall Deline, Grace Sun, and Drs. Catherine Drennan, Perry Frey, Hung-wen (Ben) Liu, Milo Westler, Christian Whitman, and Wolfgang Wohlleben for insightful discussions. The Washington State University NMR Center equipment was supported by the NIH (RR0631401 and RR12948), the NSF (CHE-9115282 and DBI-9604689), and the Murdock Charitable Trust. K.D.A. was supported by NIH Training Grant T32GM008336 and a Bank of American Poncin Trust Fellowship. This research was funded by Washington State University and a Faculty Early Career Development Award (CAREER) from the NSF to S.C.W. (CHE-0953721).
Abbreviations
- 2-HEP
2-hydroxyethylphosphonate
- 2-HPP
2-hydroxypropylphosphonate
- [4Fe-4S]
four-iron, four-sulfur
- Ado-CH2•
5′-deoxyadenosyl radical
- Ado-CH3
5′-deoxyadenosine
- 13CH3-Cbl(III)
methylcobalamin
- Cbl
cobalamin
- D2O
deuterium oxide
- dNTPs
deoxynucleotide triphosphates
- DTT
dithiothreitol
- EPPS
4-(2-hydroxyethyl)piperazine-1-propanesulfonic acid
- EPR
electron paramagnetic resonance
- Fe-S
iron-sulfur
- FM
fosfomycin
- HPLC
high performance liquid chromatography
- IMAC
immobilized metal affinity chromatography
- LIC
ligation-independent cloning
- NMR
nuclear magnetic resonance
- PCR
polymerase chain reaction
- SAH
S-adenosyl-L-homocysteine
- SAM
S-adenosyl-L-methionine
- SEC
size exclusion chromatography
- SDS-PAGE
sodium dodecyl sulfate- polyacrylamide gel electrophoresis
- TAE
tris-acetate-ethylenediamine tetraacetic acid
- TMSBr
trimethylsilylbromide
- USDA-ARS
United States Department of Agriculture Agricultural Research Service
- UV-Vis
ultraviolet-visible
- YM
yeast media
Footnotes
Publisher's Disclaimer: This is a PDF file of an unedited manuscript that has been accepted for publication. As a service to our customers we are providing this early version of the manuscript. The manuscript will undergo copyediting, typesetting, and review of the resulting proof before it is published in its final citable form. Please note that during the production process errors may be discovered which could affect the content, and all legal disclaimers that apply to the journal pertain.
Supplementary Information
The supplementary information includes additional molecular cloning details for the His- Fom3 mutants, SDS-PAGE gels for Fom3 and His-Fom3, and additional EPR and NMR spectral data.
References
- 1.Rogers TO, Birnbaum J. Antimicrob Agents Chemother. 1974;5:121–132. doi: 10.1128/aac.5.2.121. [DOI] [PMC free article] [PubMed] [Google Scholar]
- 2.Hidaka T, Goda M, Kuzuyama T, Takei N, Hidaka M, Seto H. Mol Gen Genet. 1995;249:274–280. doi: 10.1007/BF00290527. [DOI] [PubMed] [Google Scholar]
- 3.Shoji J, Kato T, Hinoo H, Hattori T, Hirooka K, Matsumoto K, Tanimoto T, Kondo E. J Antibiot (Tokyo) 1986;39:1011–1012. doi: 10.7164/antibiotics.39.1011. [DOI] [PubMed] [Google Scholar]
- 4.Schito GC. Int J Antimicrob Agents. 2003;22(Suppl 2):79–83. doi: 10.1016/s0924-8579(03)00231-0. [DOI] [PubMed] [Google Scholar]
- 5.Maraki S, Samonis G, Rafailidis PI, Vouloumanou EK, Mavromanolakis E, Falagas ME. Antimicrob Agents Chemother. 2009;53:4508–4510. doi: 10.1128/AAC.00721-09. [DOI] [PMC free article] [PubMed] [Google Scholar]
- 6.Ribes S, Taberner F, Domenech A, Cabellos C, Tubau F, Linares J, Viladrich PF, Gudiol F. J Antimicrob Chemother. 2006;57:931–936. doi: 10.1093/jac/dkl047. [DOI] [PubMed] [Google Scholar]
- 7.Falagas ME, Roussos N, Gkegkes ID, Rafailidis PI, Karageorgopoulos DE. Expert Opin Investig Drugs. 2009;18:921–944. doi: 10.1517/13543780902967624. [DOI] [PubMed] [Google Scholar]
- 8.Falagas ME, Kastoris AC, Karageorgopoulos DE, Rafailidis PI. Int J Antimicrob Agents. 2009;34:111–120. doi: 10.1016/j.ijantimicag.2009.03.009. [DOI] [PubMed] [Google Scholar]
- 9.Hidaka T, Iwakura H, Imai S, Seto H. J Antibiot (Tokyo) 1992;45:1008–1010. doi: 10.7164/antibiotics.45.1008. [DOI] [PubMed] [Google Scholar]
- 10.Liu P, Murakami K, Seki T, He X, Yeung SM, Kuzuyama T, Seto H, Liu H. J Am Chem Soc. 2001;123:4619–4620. doi: 10.1021/ja004153y. [DOI] [PubMed] [Google Scholar]
- 11.Liu P, Liu A, Yan F, Wolfe MD, Lipscomb JD, Liu HW. Biochemistry. 2003;42:11577–11586. doi: 10.1021/bi030140w. [DOI] [PubMed] [Google Scholar]
- 12.Woodyer RD, Shao Z, Thomas PM, Kelleher NL, Blodgett JA, Metcalf WW, van der Donk WA, Zhao H. Chem Biol. 2006;13:1171–1182. doi: 10.1016/j.chembiol.2006.09.007. [DOI] [PubMed] [Google Scholar]
- 13.Sofia HJ, Chen G, Hetzler BG, Reyes-Spindola JF, Miller NE. Nucleic Acids Res. 2001;29:1097–1106. doi: 10.1093/nar/29.5.1097. [DOI] [PMC free article] [PubMed] [Google Scholar]
- 14.Seto H, Hidaka T, Kuzuyama T, Shibahara S, Usui T, Sakanaka O, Imai S. J Antibiot (Tokyo) 1991;44:1286–1288. doi: 10.7164/antibiotics.44.1286. [DOI] [PubMed] [Google Scholar]
- 15.Kuzuyama T, Hidaka T, Kamigiri K, Imai S, Seto H. J Antibiot (Tokyo) 1992;45:1812–1814. doi: 10.7164/antibiotics.45.1812. [DOI] [PubMed] [Google Scholar]
- 16.Frey PA, Hegeman AD, Ruzicka FJ. Crit Rev Biochem Mol Biol. 2008;43:63–88. doi: 10.1080/10409230701829169. [DOI] [PubMed] [Google Scholar]
- 17.Lu WP, Schiau I, Cunningham JR, Ragsdale SW. J Biol Chem. 1993;268:5605–5614. [PubMed] [Google Scholar]
- 18.Werner WJ, Allen KD, Hu K, Helms GL, Chen BS, Wang SC. Biochemistry. 2011;50:8986–8988. doi: 10.1021/bi201220r. [DOI] [PMC free article] [PubMed] [Google Scholar]
- 19.Waddell WJ. J Lab Clin Med. 1956;48:311–314. [PubMed] [Google Scholar]
- 20.Beinert H. Methods Enzymol. 1978;54:435–445. doi: 10.1016/s0076-6879(78)54027-5. [DOI] [PubMed] [Google Scholar]
- 21.Kennedy MC, Kent TA, Emptage M, Merkle H, Beinert H, Munck E. J Biol Chem. 1984;259:14463–14471. [PubMed] [Google Scholar]
- 22.Beinert H. Anal Biochem. 1983;131:373–378. doi: 10.1016/0003-2697(83)90186-0. [DOI] [PubMed] [Google Scholar]
- 23.De Graaf RM, Visscher J, Schwartz AW. J Mol Evol. 1997;44:237–241. doi: 10.1007/pl00006140. [DOI] [PubMed] [Google Scholar]
- 24.Munos JW, Moon SJ, Mansoorabadi SO, Chang W, Hong L, Yan F, Liu A, Liu HW. Biochemistry. 2008;47:8726–8735. doi: 10.1021/bi800877v. [DOI] [PMC free article] [PubMed] [Google Scholar]
- 25.Kamigiri K, Hidaka T, Imai S, Murakami T, Seto H. J Antibiot (Tokyo) 1992;45:781–787. doi: 10.7164/antibiotics.45.781. [DOI] [PubMed] [Google Scholar]
- 26.Wecksler SR, Stoll S, Tran H, Magnusson OT, Wu SP, King D, Britt RD, Klinman JP. Biochemistry. 2009;48:10151–10161. doi: 10.1021/bi900918b. [DOI] [PMC free article] [PubMed] [Google Scholar]
- 27.Zheng L, Cash VL, Flint DH, Dean DR. J Biol Chem. 1998;273:13264–13272. doi: 10.1074/jbc.273.21.13264. [DOI] [PubMed] [Google Scholar]
- 28.Cicchillo RM, Lee KH, Baleanu-Gogonea C, Nesbitt NM, Krebs C, Booker SJ. Biochemistry. 2004;43:11770–11781. doi: 10.1021/bi0488505. [DOI] [PubMed] [Google Scholar]
- 29.Grove TL, Lee KH, St Clair J, Krebs C, Booker SJ. Biochemistry. 2008;47:7523–7538. doi: 10.1021/bi8004297. [DOI] [PMC free article] [PubMed] [Google Scholar]
- 30.Lanz ND, Grove TL, Gogonea CB, Lee KH, Krebs C, Booker SJ. Methods Enzymol. 2012;516:125–152. doi: 10.1016/B978-0-12-394291-3.00030-7. [DOI] [PubMed] [Google Scholar]
- 31.Blackwell CM, Turner JM. Biochem J. 1978;176:751–757. doi: 10.1042/bj1760751. [DOI] [PMC free article] [PubMed] [Google Scholar]
- 32.Bandarian V, Matthews RG. Biochemistry. 2001;40:5056–5064. doi: 10.1021/bi002801k. [DOI] [PubMed] [Google Scholar]
- 33.Kulzer R, Pils T, Kappl R, Huttermann J, Knappe J. J Biol Chem. 1998;273:4897–4903. doi: 10.1074/jbc.273.9.4897. [DOI] [PubMed] [Google Scholar]
- 34.Ugulava NB, Frederick KK, Jarrett JT. Biochemistry. 2003;42:2708–2719. doi: 10.1021/bi0261084. [DOI] [PMC free article] [PubMed] [Google Scholar]
- 35.Duschene KS, Broderick JB. FEBS Lett. 2010;584:1263–1267. doi: 10.1016/j.febslet.2010.02.041. [DOI] [PMC free article] [PubMed] [Google Scholar]
- 36.Beinert H, Kennedy MC, Stout CD. Chem Rev. 1996;96:2335–2374. doi: 10.1021/cr950040z. [DOI] [PubMed] [Google Scholar]
- 37.Chen D, Ruzicka FJ, Frey PA. Biochem J. 2000;348(Pt 3):539–549. [PMC free article] [PubMed] [Google Scholar]
- 38.Liu A, Graslund A. J Biol Chem. 2000;275:12367–12373. doi: 10.1074/jbc.275.17.12367. [DOI] [PubMed] [Google Scholar]
- 39.Walsby CJ, Ortillo D, Yang J, Nnyepi MR, Broderick WE, Hoffman BM, Broderick JB. Inorg Chem. 2005;44:727–741. doi: 10.1021/ic0484811. [DOI] [PubMed] [Google Scholar]
- 40.Zhang Q, van der Donk WA, Liu W. Acc Chem Res. 2011;45:555–564. doi: 10.1021/ar200202c. [DOI] [PMC free article] [PubMed] [Google Scholar]
- 41.Booker SJ. Curr Opin Chem Biol. 2009;13:58–73. doi: 10.1016/j.cbpa.2009.02.036. [DOI] [PMC free article] [PubMed] [Google Scholar]
- 42.Mosimann H, Krautler B. Angew Chem Int Ed Engl. 2000;39:393–395. doi: 10.1002/(sici)1521-3773(20000117)39:2<393::aid-anie393>3.0.co;2-m. [DOI] [PubMed] [Google Scholar]
- 43.Metcalf WW, van der Donk WA. Annu Rev Biochem. 2009;78:65–94. doi: 10.1146/annurev.biochem.78.091707.100215. [DOI] [PMC free article] [PubMed] [Google Scholar]
- 44.Westler WM. personal communication [Google Scholar]
- 45.Liu P, Liu A, Yan F, Wolfe MD, Lipscomb JD, Liu Hw. Biochemistry. 2003;42:11577–11586. doi: 10.1021/bi030140w. [DOI] [PubMed] [Google Scholar]
- 46.Person MD, Lo HH, Munske G. personal communications [Google Scholar]
- 47.Pierre S, Guillot A, Benjdia A, Sandstrom C, Langella P, Berteau O. Nat Chem Biol. 2012;8:957–959. doi: 10.1038/nchembio.1091. [DOI] [PubMed] [Google Scholar]
- 48.Kim HJ, McCarty RM, Ogasawara Y, Liu YN, Mansoorabadi SO, Levieux J, Liu Hw. J Am Chem Soc. 2013 doi: 10.1021/ja312641f. epub ahead of print. [DOI] [PMC free article] [PubMed] [Google Scholar]
Associated Data
This section collects any data citations, data availability statements, or supplementary materials included in this article.