

Abstract
Monolayer cultures of tumor cells and animal studies have tremendously advanced our understanding of cancer biology. However, we often lack animal models for human tumors, and cultured lines oif human cells quickly lose their cancer signatures. In recent years, simple 3D models for cancer research have emerged, including cell culture in spheroids and on biomaterial scaffolds. Here we describe a bioengineered model of human Ewing’s sarcoma that mimics the native bone tumor niche with high biological fidelity. In this model, cancer cells that have lost their transcriptional profiles after monolayer culture re-express genes related to focal adhesion and cancer pathways. The bioengineered model recovers the original hypoxic and glycolytic tumor phenotype, and enables re-expression of angiogenic and vasculogenic mimicry features that favor tumor adaptation. We propose that differentially expressed genes between the monolayer cell culture and native tumor environment are potential therapeutic targets that can be explored using the bioengineered tumor model.
Keywords: cancer, tumor niche, tissue engineering, Ewing’s sarcoma, therapeutic targets, microenvironment
1. Introduction
Both the two-dimensional (2D) culture and in vivo models of cancer have been actively used to unravel the complex mechanisms and molecular pathways of cancer pathogenesis. Cancer cells lose many of their relevant properties in 2D culture, presumably due to the lack of the native-like physiological milieu with extracellular matrix (ECM), supporting cells and regulatory factors. As a result, 2D cultures are not predictive of antitumoral drug effects in human [1, 2]. Animal models have their own limitations in representing human disease [3], necessitating the use of clinical data [4].
Bioengineering methods are just starting to enter the field of cancer research, offering simple 3D models of cancer, such as tumor spheroids, cell inserts, and cell encapsulation in hydrogels or porous scaffolds [5–7]. While these models are an advance over monolayer cultures, cancer cells still remain deprived of native tumor environments providing interactions between cancer cells, stromal and vascular cells [8]. Indeed, Bissel has convincingly demonstrated that the microenvironment can both inhibit and facilitate tumor growth and metastatis [9]. Specifically in the bone microenvironment, it has been shown that osteoblasts, osteoclasts, fibroblasts as well as mesenchymal stem cells (hMSC) play essential roles in primary tumor growth and metastasis [10, 11]. However, current approaches are far from replicating the native in vivo milieu in which tumors develop, a necessary condition for advancing cancer research and translating novel therapies into clinical practice.
In this report, our aim is to introduce substantial improvements over existing 3D models to study bone tumors by implementing advanced methods in tissue engineering. We have developed a protocol to engineer human bone tumors in their native niche. We cultured Ewing’s sarcoma (ES) spheroids within tissue engineered human bone, grown from adult hMSC capable of osteogenic differentiation using a native bone ECM as a structural and mechanical scaffold. This innovative model allows cross-talk between cancer cells and crucial bone microenvironment components, namely osteoblasts, ECM secreted by cells and native mineralized ECM. We propose this novel experimental model as a tool to determine bone tumor targets in a human organ context under conditions predictive of human physiology.
2.Materials and methods
2.1. Native tumors
Fully de-identified samples of Ewing’s sarcoma tumors were obtained from the Columbia University Tissue Bank. A total of 44 samples were used in experimental studies. Frozen tissue samples were cut into sets of contiguous 10 µm-thick sections (6 sections per sample) and homogenized in Trizol (Life technologies) for RNA extraction and subsequent gene expression analysis.
2.2. Retroviral and lentiviral transductions
A GFP line of Ewing sarcoma cells was derived from hMSCs by retroviral transductions performed using an established protocol [12]. The GFP retroviral vector (pBabe-Puro-GFP) was kindly provided by Dr. Manuel Serrano (CNIO, Madrid, Spain) [13]. The EWS-FLI-GFP expression vector was generously provided by Dr. Elizabeth R. Lawlor (University of Michigan, Ann Arbor, MI, USA). Lentiviral transductions were performed following a previously described protocol [14]. EWS-GFP cells were cultured in DMEM supplemented with 10% (v/v) Hyclone FBS and 1% penicillin/streptomycin.
2.3. Tumor cell lines
Ewing’s sarcoma cell lines SK-N-MC (HTB-10) and RD-ES (HTB-166) were purchased from the American Type Culture Collection (ATCC). According to the manufacturer’s specifications, SK-N-MC cells were cultured in ATCC-formulated Eagle’s Minimum Essential Medium (EMEM), and RD-ES cells were cultured in ATCC-formulated RPMI-1640 Medium (RPMI). Both culture media were supplemented with 10% (v/v) Hyclone FBS and 1% penicillin/streptomycin.
U2OS osteosarcoma cell line and HEK293T cell line were kindly provided by Dr. Manuel Serrano (CNIO, Madrid, Spain) and cultured in Dulbecco’s Modified Eagle Medium (DMEM) supplemented with 10% (v/v) Hyclone FBS and 1% penicillin/streptomycin).
2.4. Cultivation of human mesenchymal stem cells
Cultivation, seeding and osteogenic differentiation of human mesenchymal stem cells (hMSC) were performed as in our previous studies [15, 16]. Briefly, hMSC were cultured in basic medium (DMEM supplemented with 10% (v/v) Hyclone FBS and 1% penicillin/streptomycin) for maintenance and expansion, followed by osteogenic medium (basic medium supplemented with 1 µM dexamethasone, 10 mM β-glycerophosphate, and 50 µM ascorbic acid-2-phosphate) for osteogenic differentiation. Due to the highly osteogenic properties of the mineralized bone scaffolds used to culture the cells, the supplementation of MBP-2 was not necessary. All cells were cultured at 37°C in a humidified incubator at 5% CO2.
2.5. Tumor cell spheroids
To form tumor cell spheroids, 0.3 ×10⁶ Ewing’s sarcoma cells were centrifugated in 15 mL Falcon tubes (5 minutes at 1200 rpm), and cultured in 4mL of medium for one week at 37°C in a humidified incubator at 5% CO2.
2.6. Tissue engineered model of tumor
Cell culture scaffolds (4 mm diameter × 4 mm high plugs) were prepared from fully decellularized bone as in our previous studies [15, 16]. Each scaffold was seeded with 1.5 ×10⁶ hMSCs (passage 3) and cultured in 6 mL of osteogenic medium for 4 weeks. Medium was changed biweekly. After 4 weeks, bone tissue constricts were bisected; one half was infused with aggregates of Ewing’s sarcoma cells (3 spheroids per scaffold) (this group was termed TE-ES) and the other half of the bone tissue construct was used as a control (this group was termed TE-bone).
Tumor models were formed using each of the three tumor cell lines (RD-ES, SK-N-MC, EWS-GFP). For each tumor, TE bone without tumor cells was used as a control. TE-RD model (and their counterpart TE-bone controls) were cultured in RPMI medium; TE-SK-N-MC model (and their counterpart TE-bone controls) were cultured in EMEM; TE-EWS-GFP model (and their counterpart TE-bone controls) were cultured in DMEM.
All culture media were supplemented with 10% (v/v) Hyclone FBS and 1% penicillin/streptomycin. TE-ES and TE-bone models were cultured at 37°C in a humidified incubator at 5% CO2 for 2 and 4 weeks.
2.7. Cytometry
Surface marker analysis by FACS was carried out as described previously [16]. In brief, hMSC and ES cell lines (RD-ES, SK-N-MC and EWS-GFP) were harvested, centrifugated and incubated at 4°C for 1 h with fluorochrome conjugated antibodies APC Mouse anti-human CD13 (BD Pharmingen, 557454), APC Mouse anti-human CD44 (BD Pharmingen, 560532), APC Mouse anti-human CD73 (BD Pharmingen, 560847), APC Mouse anti-human CD90 (BD Pharmingen, 559869) and APC Mouse anti-human CD105 (BD Pharmingen, 562408). Negative control cells were stained with APC mouse IgG1, k isotype control, Clone MOPC-21 (BD Pharmingen, 555751). CD99 expression was assayed incubating cells with CD99 primary antibody (Signet antibodies, SIG-3620). FACS data were analyzed using FlowJo software version 7.6 (Tree Star Inc., Ashland, OR, USA)
2.8. Quantitative real-time PCR (qRT-PCR)
Total RNA was obtained using Trizol (Life Technologies) following the manufacturer’s instructions. RNA preparations (2 µg) were treated with “Ready-to-go you-prime first-strand beads” (GE Healthcare) to generate cDNA. Quantitative real-time PCR was performed using DNA Master SYBR Green I mix (Applied Biosystems). mRNA expression levels were quantified applying the ΔCt method, ΔCt = (Ct of gene of interest - Ct of Actin). GFP primers were selected as previously reported [17]. Other qRT-PCR primer sequences were obtained from the PrimerBank database (http://pga.mgh.harvard.edu/primerbank/) (Table 1).
Table 1.
The list of primers used in qRT-PCR of tumor cells
| Gene Description | PrimerBank ID |
|---|---|
| beta actin (Actin) | 4501885a1 |
| EWS-FLI1 fusion isoform type 8 (EWS-FLI) | 633772a1 |
| Homo sapiens NK2 homeobox 2 (NKX2-2) | 32307133b1 |
| Homo sapiens tumor protein p53 (TP53) | 371502118c1 |
| ACTN4 Homo sapiens actinin, □ 4 (ACTN4) | 316660986c2 |
| CCND2 Homo sapiens cyclin D2 (CCND2) | 209969683c1 |
| COL1A2 Homo sapiens collagen, type I, □2 (COL1A2) | 48762933c3 |
| COL3A1 Homo sapiens collagen, type III, □1 (COL3A1) | 110224482c2 |
| Homo sapiens collagen, type VI, □1 (COL6A1) | 87196338c2 |
| COL6A2 Homo sapiens collagen, type VI, □2 (COL6A2) | 115527065c1 |
| COL6A3 Homo sapiens collagen, type VI, □3 (COL6A3) | 240255534c1 |
| FLNB Homo sapiens filamin B, □ (FLNB) | 256222414c2 |
| MYLK Homo sapiens myosin light chain kinase (MYLK | 116008189c1 |
| Homo sapiens 3-phosphoinositide dependent protein kinase-1 (PDPK1) | 60498971c1 |
| Homo sapiens protein phosphatase 1, regulatory subunit 12A (PPP1R12A) | 219842213c1 |
| Homo sapiens insulin-like growth factor 1 (somatomedin C) (IGF1) | 163659898c1 |
| VCL Homo sapiens vinculin (VCL) | 50593538c1 |
| CDKN1B Homo sapiens cyclin-dependent kinase inhibitor 1B (p27, Kip1) (CDKN1B) | 207113192c3 |
| Homo sapiens C-terminal binding protein 1 (CTBP1) | 61743966c2 |
| CTBP2 Homo sapiens C-terminal binding protein 2 (CTBP2) | 145580576c1 |
| ETS1 Homo sapiens v-ets erythroblastosis virus E26 oncogene homolog 1 (avian) (ETS1) | 219689117c1 |
| c-K-ras2 protein isoform a (KRAS) | 15718763a1 |
| PIAS1 Homo sapiens protein inhibitor of activated STAT, 1 (PIAS1) | 7706636c2 |
| Homo sapiens retinoid X receptor, alpha (RXRA) | 207028087c3 |
| Homo sapiens signal transducer and activator of transcription 3 (STAT3) | 47080104c1 |
| Homo sapiens cell division cycle 42 (GTP binding protein, 25kDa) (CDC42) | 89903014c1 |
| Homo sapiens collagen, type IV, □2 (COL4A2) | 116256353c1 |
| Homo sapiens catenin (cadherin-associated protein), □1, 88kDa (CTNNB1) | 148233337c2 |
| Homo sapiens jun proto-oncogene (JUN) | 44890066c1 |
| laminin □ 4 chain (LAMA4) | 4504949a2 |
| Homo sapiens laminin, □1 (LAMB1) | 167614503c1 |
| Homo sapiens laminin, □1 (formerly LAMB2) (LAMC1) | 145309325c3 |
| Homo sapiens phosphoinositide-3-kinase, regulatory subunit 1 (□) (PIK3R1) | 335057530c3 |
| Homo sapiens phosphatase and tensin homolog (PTEN) | 110224474c2 |
| Homo sapiens hypoxia inducible factor 1, □ subunit (HIF1A) | 194473734c1 |
| Homo sapiens vascular endothelial growth factor A (VEGFA) | NM_001101 |
| Homo sapiens EPH receptor A2 (EPHA2) | 296010835c1 |
| Homo sapiens tissue factor pathway inhibitor (TFPI) | 98991770c1 |
| Homo sapiens laminin, □2 (LAMC2) | 157419139c1 |
2.9. Microarray data analysis
Expression of genes in native Ewing’s Sarcoma tumors and cell lines was studied in 11 cell lines and 44 tumors by applying the barcode method to the Affymetrix Human Genome U1332 Plus 2 gene expression data of Savola et al.[18]. A probeset was considered expressed only if detected in all cell lines/tumors. Where a gene had multiple probesets, the gene was only counted once. Genes expressed in cell lines, but not tumors, or in tumors, but not cell lines, were identified from the asymmetric differences between the two both sets.
2.10. Histology and immunohistochemistry (IHC)
TE-ES and TE-bone models were fixed in 10% formalin, embedded in paraffin, sectioned at 4 µm and stained with hematoxylin and eosin (H/E). The sections were then stained for CD99 (dilution 1:500; Signet antibodies, SIG-3620) and GLUT1 (dilution 1:500; Abcam, ab652) as previously described [16], and counterstained with Hematoxylin QS (Vector Labs). For PAS staining, periodic acid-Schiff (PAS) (from Sigma-Aldrich) was used according to the manufacturer’s instructions.
hMSC (passage 3) were plated in 24 well plates (1 × 10⁴ cells/cm2) and cultured for 3 weeks in either basic medium or osteogenic medium. At weeks 1, 2 and 3, osteogenic differentiation was analyzed by alkaline phosphatase activity (Sigma– Aldrich, St Louis, MO, USA), following the manufacturer’s instructions, and by von Kossa staining. Sections were incubated with 1% AgNO3 solution in water and exposed to a 60 W light for 1 h.
Hypoxyprobe™-1 (pimonidazole) Kit for the Detection of Tissue Hypoxia (Chemicon International, Inc., Temecula, CA, USA) was used to detect hypoxia in TE-bone according to the manufacturer’s instructions. Preparations were mounted with vectashield and Nuclei were counterstained with DAPI (Vector Labs, H-1200).
2.11. TUNEL assay
Apoptotic cells were detected by an in situ cell death detection kit - TMR red (Roche Applied Science, Mannheim, Germany) according to the manufacturer’s instructions. The assay measures DNA fragmentation by immunofluorescence using TUNEL (terminal deoxynucleotidyl transferase-mediated dUTP nick end-labeling) method at the single cell level. One hundred cells per field (n=3) in the center of the TE-ES model (n=3) were counted to quantify the percentage of apoptotic cells. Nuclei were stained with Hoechst 33342 (Molecular probes).
2.12. Enzyme-Linked Immunoabsorbent Assay (ELISA)
24-hour supernatants from TE-ES and TE-bone controls were analyzed to detect angiogenic proteins, using a Proteome Profiler Human Angiogenesis Array Kit (R&D Systems, ARY007) according to the manufacturer’s instructions.
3. Results
3.1. Generation and characterization of Ewing’s sarcoma niche components
3.1.1. Ewing’s sarcoma cell lines
Ewing’s sarcoma family of tumors (ESFT) is characterized by aggressive, undifferentiated, round cells, with strong expression of CD99, affecting mostly children and young adults [19, 20]. ESFT comprises of Ewing’s sarcoma (ES) that arises in bone, extraosseous ES (EES), peripheral primitive neuroectodermal tumors (pPNET) and Askin’s tumors with a neuroectodermal origin [21, 22]. The chromosomal translocation t(11:22)(q24:q212) is the most common mutation (~ 85–90% of cases) in ESFT and leads the formation of the EWS/FLI fusion protein which contributes to tumorigenesis in the cells of origin [19, 20]. Recent analyses of molecular signatures suggest that ESFT originate from mesenchymal and neural crest [14, 23].
Two ES-GFP cell lines, RD-ES line (primary bone tumor cell line) and SK-N-MC line (primary cells originated from an Askin’s tumor metastasizing in the supraorbital area) were used to develop the tumorigenic component of the model (Fig. 1a, b). Surface markers (characterized by flow cytometry) in RD-ES and SK-N-MC were, as expected, CD13-, CD44- and CD73- and CD90+, CD105+ and CD99+ (Fig. 1c). Surface proteins expression in EWS-GFP cell line was compared to hMSCs, exhibiting high levels of the ES-related marker CD99 and diminishing levels of the CD13, CD44 and CD73 hMSC-specific markers (Fig. 1d).
Figure 1. Characterization of Ewing’s sarcoma cell lines.
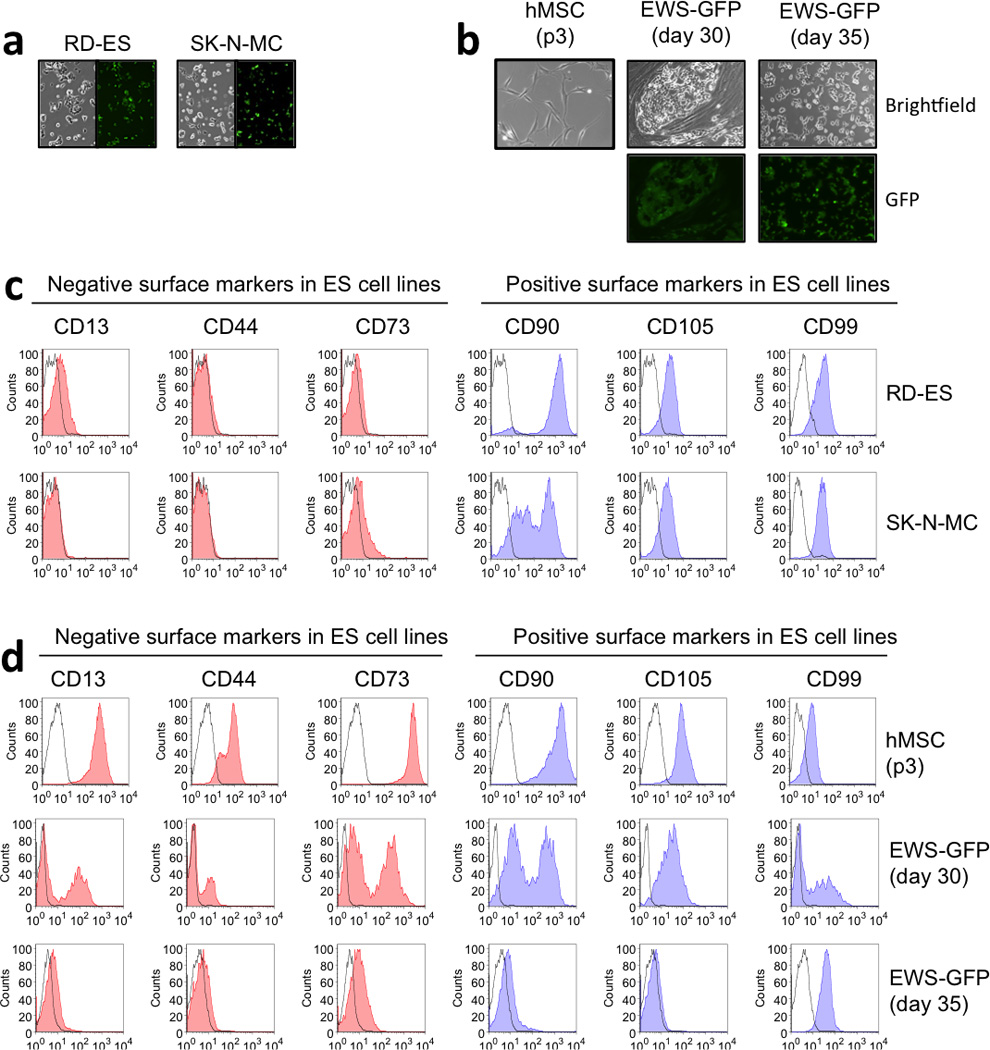
(a) Morphology of two ES cell lines, RD-ES and SK-N-MC. Left panel: bright field images showing typical small-round cell ES morphology. Right panel: GFP expression images by fluorescence microscopy. RD-ES and SK-N-MC were stably transduced with pBabe-GFP retroviral vector as described in materials and methods. (b) Top panels: Bright field images of hMSC (p3) and transduced with EWS-GFP vector at day 30 (without passage) and day 35 (p2). Low panels: GFP expression images at day 30 and 35 post-transduction. (c) FACS analysis of negative and positive surface markers in Ewing’s sarcoma cells. (d) Analysis of hMSC and ES surface markers in EW-GFP cell line. hMSC were CD13+, CD44+, CD90+ and CD105+ and expressed low levels of CD99 specific ES marker. By day 35, EWS-GFP cells lost hMSC surface proteins and acquired ES surface markers profiles, expressing high levels of CD99.
3.1.2. Tissue-engineerd bone (TE-bone)
We have previously shown that hMSCs differentiate into osteoblastic lineages and form viable, functional human bone when cultured on 3D scaffolds made of decellularized bone in osteogenic medium [16, 24, 25]. We used this approach to engineer the bone niche component for the Ewing’s sarcoma tumor model (TE-bone). First, we tested the osteogenic potential of hMSC (passage 3) after three weeks of monolayer culture in osteogenic medium. Positive alkaline phosphatase and von Kossa stainings (Fig. 2a,b), and the expression of bone markers by qRT-PCR (Fig. 2c) demonstrated bone differentiation capacity of hMSCs.
Figure 2. Characterization of tissue-engineered bone.
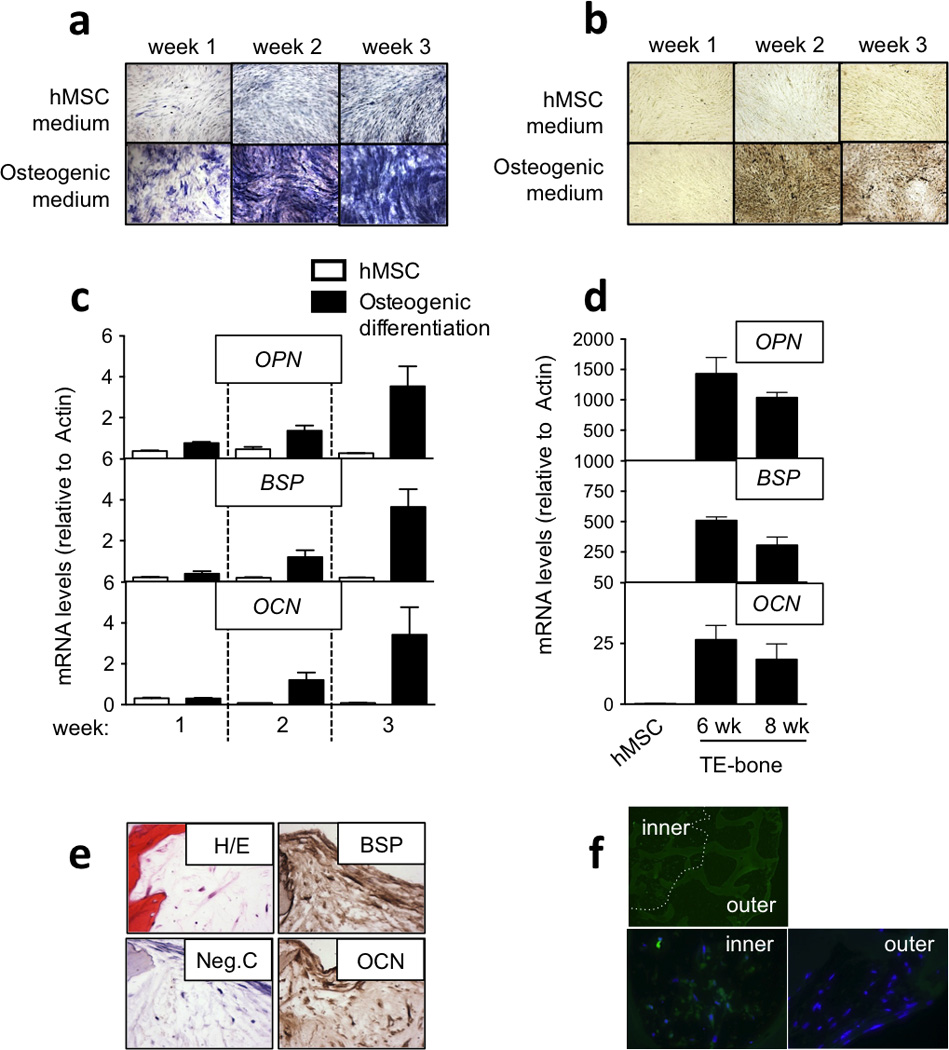
(a) Osteogenic differentiation evaluation by Alkaline Phosphatase staining. hMSCs in monolayer were cultured in hMSC medium or Osteogenic medium during 3 weeks. Alkaline Phosphatase staining was performed weekly. Differentiated stem cells positive for Alkaline Phosphatase were stained blue. Images are representative of a total analysis of three samples. (b) Mineral deposition analysis by the von Kossa method. Black stained phosphate deposits demonstrated osteogenic differentiation in hMSCs. Images are representative of a total analysis of three samples. (c) qRT-PCR analysis of bone genes during osteogenic differentiation in monolayer. mRNA levels of Osteopontin (OPN), Bone Sialoprotein (BSP), and Osteocalcin (OCN) in hMSC cultured in monolayer in hMSC medium or osteogenic differentiation medium were assessed demonstrating induction and bone differentiation. All data represent average + SD (n=3) (d) qRT-PCR analysis of bone genes during osteogenic differentiation in tissue constructs. mRNA levels of Osteopontin (OPN), Bone Sialoprotein (BSP), and Osteocalcin (OCN) in hMSC cultured in a bone constructs for 6 and 8 weeks in osteogenic differentiation medium were assessed and compared to the initial hMSCs. (e) Bone-related protein expression analysis by immunohistochemistry in TE-bone at week 8. Counterstaining was performed with hematoxylin QS (blue). Hematoxylin and Eosin stains of representative images (n=3) are shown. (f) Hypoxia analysis of TE-bone by immunofluorescence of pimonidazole-binding cells (green). Nuclei were stained with DAPI (n=3).
In parallel, we cultured 1.5×10⁶ hMSC (passage 3) in 4 × 4mm cylindrical decellularized bone scaffolds for 6 and 8 weeks, in osteogenic differentiation medium, and observed elevated expression of bone-related markers (OPN, BSP and OCN) as compared to the same cells in monolayer culture (Fig. 2d). We further confirmed bone-related protein expression by imunohistochemistry suggesting that TE-bone was generated (Fig. 2e). Because hypoxia it a pivotal microenvironmental factor for tumor development [26], we confirmed hypoxia in the middle of the TE-bone by tissue immunofluorescence of pimonidazole-binding cells (Fig. 2f).
3.2. Tissue-engineered model of Ewing’s sarcoma (TE-ES)
To generate the tumor model, Ewing’s sarcoma (ES) spheroids (providing a 3D context for local interactions of cancer cells) were introduced into the human bone niche generated by tissue engineering (TE-bone) (Fig. 3a). TE-bone plugs were cultured for 4 weeks in osteogenic differentiation medium; in parallel, tumor spheroids were cultured in ES medium for one week. TE-bone plugs were bisected through the center, and 3 ES spheroids were introduced into one half of the bone construct, generating a tissue-engineered model of Ewing’s Sarcoma (TE-ES); the other half of each TE-bone plug served as a control. TE-ES models and their control counterparts were cultured for an additional 2 or 4 weeks in ES medium (Fig. 3b). Three different TE-ES models were generated, using two existing ES cell lines (TE-RD-ES and TE-SK-N-MC) and the new line we developed in vitro (TE-EWS-GFP) (Fig. 3c).
Figure 3. Tissue-engineered models of Ewing’s sarcoma (TE-ES).
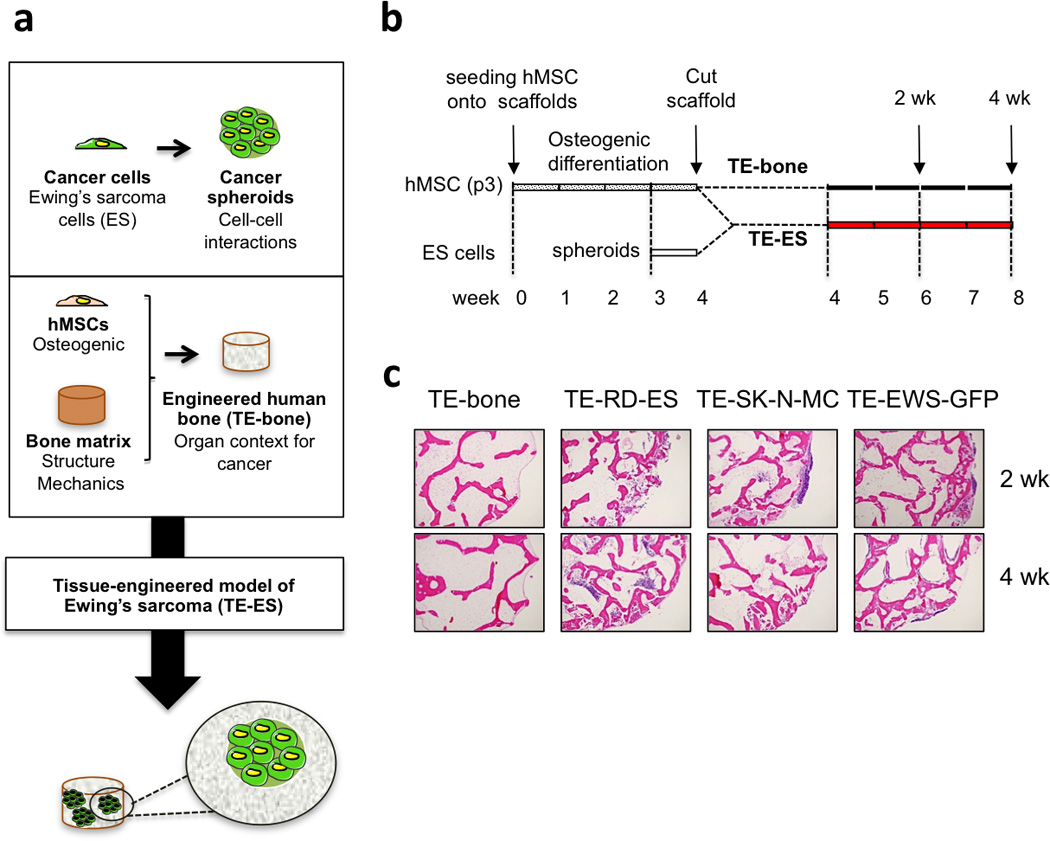
(a) Methodology used to develop tissue-engineered models of Ewing’s sarcoma tumors. (b) TE-ES generation. Fully decellularized bone scaffolds (4 mm diameter × 4 mm high plugs) were seeded with hMSCs (p3). After 4 weeks of culture in osteogenic differentiation medium, bone constructs were bisected. One half was seeded with Ewing’s sarcoma spheroids (3 per construct); the other half was used as control (TE-bone). Both TE-ES and TE-bone were cultured for 2 or 4 weeks in ES medium. (c) Hematoxylin and Eosin images of TE-bone controls and TE-ES models (TE-RD-ES, TE-SK-N-MC, TE-EW-GFP) at week 2 and 4 after introducing tumor spheroids.
3.3. Re-expression of focal adhesion and cancer-related genes
In order to validate the TE-ES model, we analyzed histological sections by hematoxylin-eosin staining, detecting large areas with small-round cells that were CD99+ and surrounded by bone cells and ECM (Fig. 4a). GFP levels in TE-ES models and the cell line counterparts cultured in monolayers (by qRT-PCR) confirmed expression in both cultures (Fig. 4b), demonstrating ES tissue formation and the presence of ES cells in the bone context. EWS-FLI mRNA and the well-known EWS-FLI target NKX2.2 were expressed at low levels in ES cell monolayers as compared to native ES tumors from patients (Fig. 4b). Notably, both genes were upregulated in all three TE-ES models, for all three cell lines studied, suggesting a clear effect of the microenvironment in regulating ES gene profile (Fig. 4b).
Figure 4. Characterization of TE-ES models.
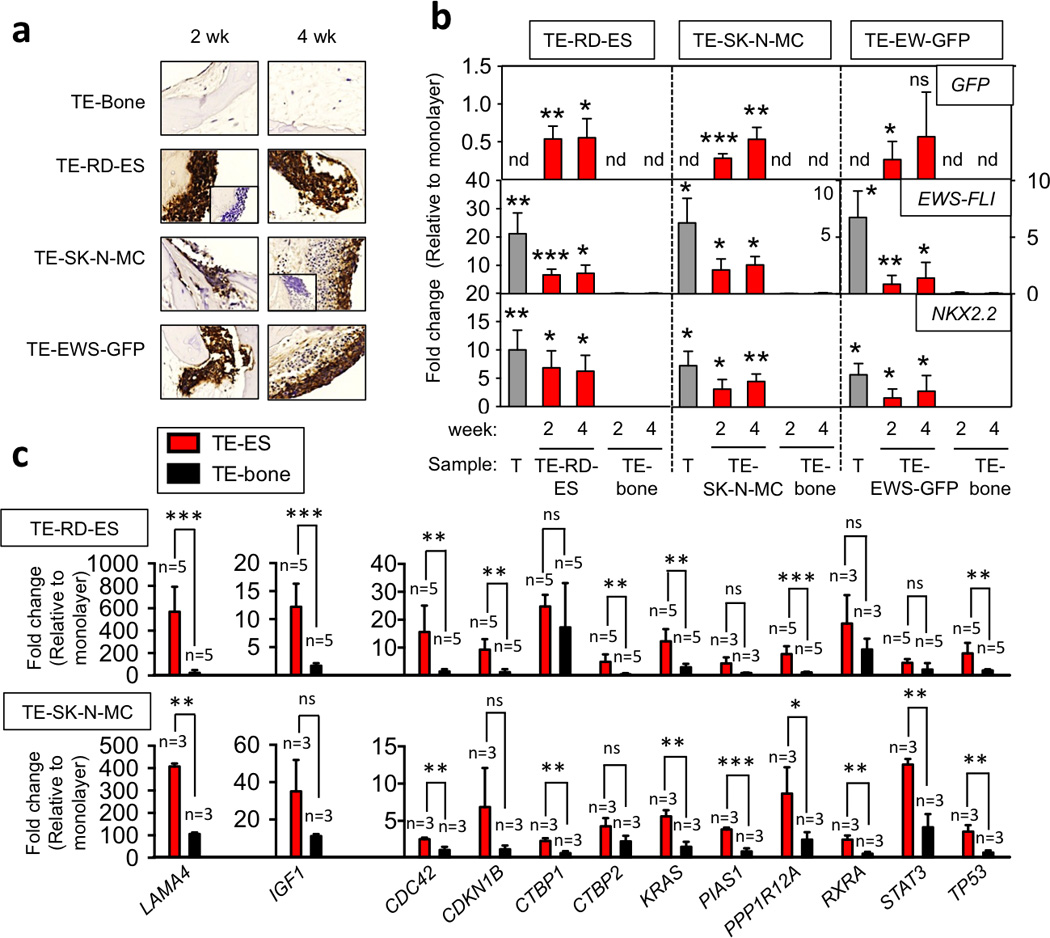
(a) Immunohistochemical staining of TE-bone and TE-ES models for Ewing’s sarcoma marker CD99 at weeks 2 and 4. Insets represent negative controls without primary antibody. Representative images are shown (n=3). Counterstaining was performed with Hematoxylin QS (blue) (b) qRT-PCR analysis of GFP, EWS-FLI and NKX2.2. (c) qRT-PCR analysis of the ES genes expressed in tumors and not in cell lines cultured in monolayers. In all cases, fold change was calculated by first normalizing to actin levels in the individual samples and then to the corresponding levels in cells cultured in monolayer. Data are shown as average ± SD (n=3–5). Two-tailed Student’s T-test was used to determine statistical significance. *p < 0.05; **p < 0.01, ***p < 0.001; nd, not determined; ns, not significant; T, native Ewing’s sarcoma tumors.
A number of studies have shown significant differences in gene expression between tumors from patients and cells cultured in monolayers, due to the flat, unnatural plastic environment [1]. We analyzed the presence or absence of expression of genes in 44 tumors from patients and 11 cell lines by applying the barcode method to the Affymetrix Human Genome U1332 Plus 2 gene expression data of Savola et al. [18].
We identified 599 genes that were expressed in tumors but not in cell lines (Table S1). Comparing mRNA expression between the two cell lines (RD-ES and SK-N-MC) in monolayer and 3 ES tumors from patients we confirmed upregulation of 24 genes in ES tumors. Importantly, all these genes were related to focal adhesion and pathways in cancer (Table S2; Fig. S1,S2,S3,S4). By analyzing these 24 genes in the TE-RD-ES and TE-SK-N-MC models relatively to their monolayer counterparts, we confirmed strong re-expression (fold change >3) for 12 genes (Fig. 4c).
Noteworthy, IGF1 was one of the targets found and validated (12.2 ± 4.11 fold change in TE-RD-ES relative to RD-ES cell monolayers; 35.08 ± 16.84 fold change in TE-SK-N-MC relative to SK-N-MC cell monolayers). IGF signal transduction pathway is thought to play a key role in ESFT development and proliferation [27] and a number of preclinical and clinical trials inhibiting IGF-1R have been undertaken [28]. Our results support the importance of tumor microenvironment for gene expression and suggest that TE-ES models recapitulate, at least in part, ES gene expression signatures.
3.4. Recapitulation of the hypoxic and glycolytic tumor phenotype
At early stages of cancer, tumors are avascular masses where oxygen and nutrients delivery are supplied by diffusion and therefore, growth in inner areas is compromised [29]. To maintain energy production, tumor cells respond and adapt to the hypoxic environment by increasing the amount of glycolytic enzymes and glucose transporters, such as GLUT1 and GLUT3, via the hypoxia-inducible factor-1 (HIF1α) [30]. These processes were extensively studied, using tumor spheroids and tumor micro-regions in vivo, observing an outer viable tumor (with proliferating cells), an inner hypoxic area (with quiescent adapted viable cells) and a central necrotic core where oxygen and glucose levels are critically low [31, 32]. The tumor model mimics such tumor heterogeneity in terms of oxygen and nutrients supply, as demonstrated by hypoxia in the center of the tissue constructs, but not in the outer areas (Fig. 2f).
In order to evaluate whether TE-ES models recapitulate the initial steps of tumor generation, we analyzed necrotic areas at the core of the tumor model and compared the levels of HIF1α and GLUT1 to those in cell monolayers and TE-bone controls. First, we focused on the construct interior where we found necrotic areas similar to those observed in native tumors (Fig. 5a). TUNEL assays after 4 weeks of cultivation revealed significant cell death in the middle of the TE- SK-N-MC tumor model (73 ± 36%) relatively to TE-RD-ES (29± 3%) and/or TE-EW-GFP(16± 2%) (Fig. 5b). These results suggest that RD-ES and EW-GFP cell lines may be better adapted than SK-N-MC cell line to restrictive hypoxic conditions at the centers of the constructs.
Figure 5. Expression of hypoxic and glycolytic tumor phenotypes.
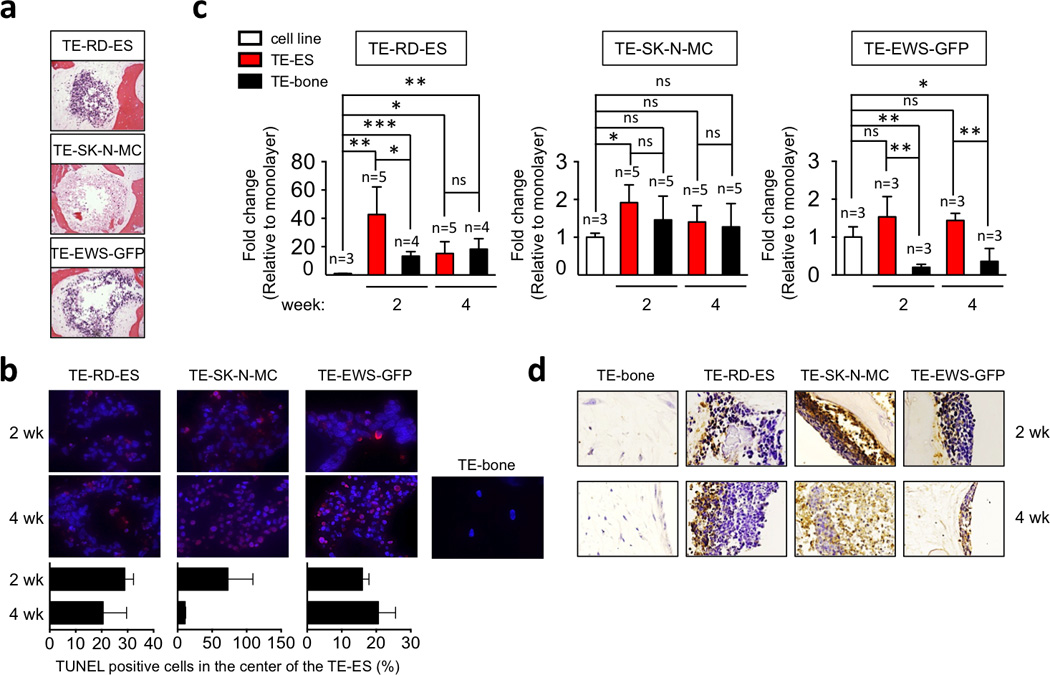
(a) Necrotic areas in the inner regions of TE-ES models were identified by Hematoxylin and Eosin staining of TE-RDES, TE-SK-N-MC and TE-EW-GFP at week 2. Representative images are shown (n=3). (b) HIF1α mRNA levels in TE-ES models. Fold change was calculated by first normalizing to actin levels in the individual samples and then to the corresponding levels in cells cultured in 2D. Data are shown as Average ± SD (n=3–5). Statistical significance was determined by the two-tailed Student’s T test. *p < 0.05; **p < 0.01,***p < 0.001; ns, not significant. (c) TUNEL immunofluorescent staining of TE-ES and TE-bone at the center on the model. Upper panel: representative pictures of TUNEL-stained inner areas. Apoptotic cells stain red; cell nuclei stained by Hoechst 33342. Lower panel: Quantification of TUNEL-positive cells in the inner part of the TE-ES models. (d) Immunohistochemical staining of GLUT-1 in the indicated TE models over time. Counterstain: Hematoxylin QS (blue). Representative images are shown (n=3).
In response to hypoxia, transcription levels of HIF1α at week 2 were 40 times higher in the TE-RD-ES tumor model relatively to the RD-ES cell monolayers, and 30 times higher relatively to TE-bone. Interestingly, HIF1α expression decreased with time in culture, reaching at week 4 levels similar to those in TE-bone (Fig. 5c). Surprisingly, we found that transcriptional expression of HIF1α was not significantly increased by hypoxia in TE-SK-N-MC and TE-EW-GFP models as compared to monolayer (Fig. 5c). Also, the SK-N-MC and EW-GFP cell lines expressed higher levels of HIF1α than the RD-ES line, and the expression levels in the SK-N-MC cells were comparable to those in TE-bone. These data suggest that tumor cells that have low transcriptional levels of HIF1α (RD-ES line) increase expression in order to adapt to hypoxic environment. In contrast, cell lines expressing high levels of HIF1α (SK-N-MC and EW-GFP) seem to be insensitive to hypoxia, at least at the transcriptional levels. HIF1α thus appear to play a protective role in the adaptation of tumor cells to hypoxia.
To assess the role of hypoxia in the induction of glycolytic response, we examined the levels of GLUT1 protein in TE-bone and TE-ES models. As expected, we observed very high levels of GLUT1 favoring glucose uptake and tumor survival in inner areas where oxygen and medium supply are compromised (Fig. 5d). Noteworthy, GLUT1 was expressed in necrotic areas in the TE-SK-N-MC model.
Taken together, these data demonstrate that the RD-ES cells expressing high levels of HIF1α adapt to hypoxia in the TE bone environment by recapitulating some aspects of hypoxic and glycolytic tumor phenotype, and mimicking inner (necrotic) and outer (survival) signatures. In comparison, the SK-N-MC and EW-GFP cells expressing low levels of HIF1α showed less ability to adapt to hypoxic microenvironment.
3.5. Recapitulation of angiogenic ability and vasculogenic mimicry
Tumor cells respond to oxygen and nutrient deprivation by promoting vascularization that maintains tumor growth and survival [33]. Induction of vascular endothelial growth factor (VEGF-α) is an essential feature of tumor angiogenesis that is driven by hypoxia and mediated by HIF1α[34]. To address whether hypoxia modulates angiogenic ability of the tumor, we analyzed transcriptional levels of VEGF-α in TE-ES models. We found high induction of VEGF-α in TE-RD-ES at week 2 as compared to the RD-ES cell line and TE-bone (Fig. 6a). Notably, the expression levels decreased by week 4, as observed for HIF1-α. In further support of the adaptive advantage of RD-ES cells cultured in TE-bone, VEGF-α mRNA levels were not significantly increased in TE-SK-N-MC and TE-EW-GFP tumor models as compared to TE-bone controls (Fig. 6a).
Figure 6. Angiogenic and vasculogenic mimicry.
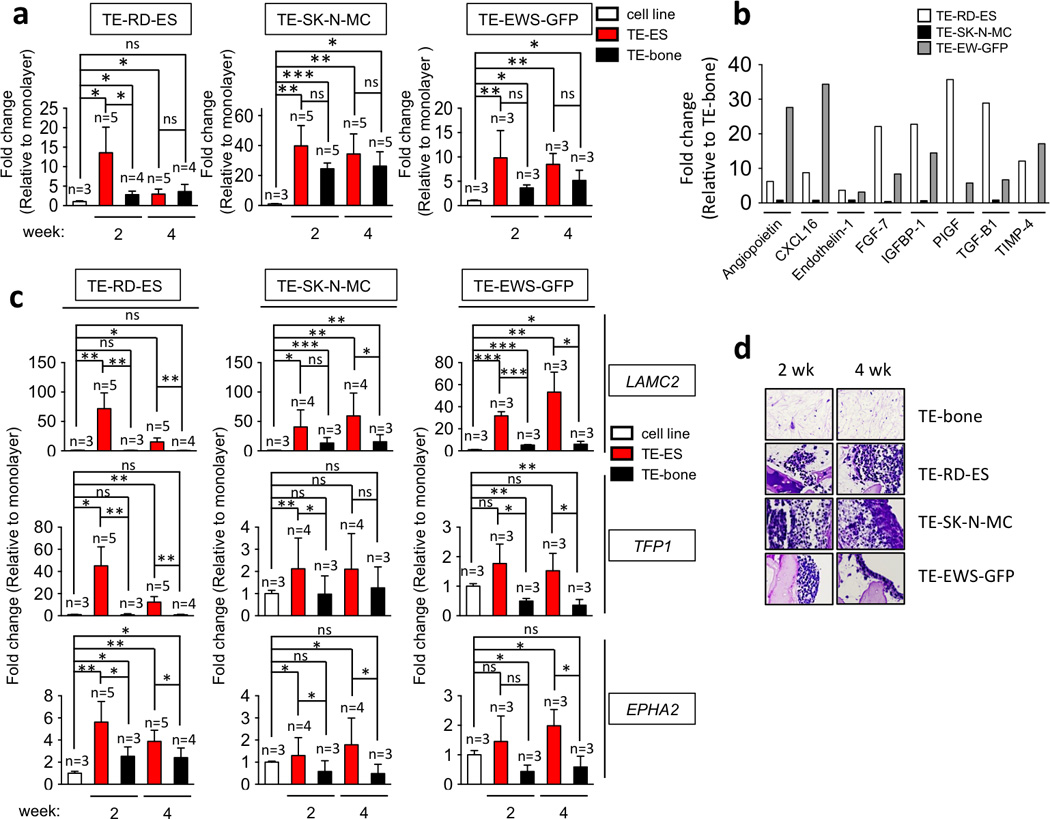
(a) VEGFα mRNA levels in TE-ES models. Fold change was calculated by first normalizing to actin levels in the individual samples and then to the corresponding levels in cells cultured in 2D. Data are shown as average ± SD (n=3–5). Two-tailed Student’s T-test was used to determine statistical significance. *p < 0.05; **p < 0.01, ***p < 0.001; ns, not significant. (b) Angiogenesis-related proteins in TE-ES culture media. Expression levels of the indicated proteins were assessed by ELISA and compared with expression levels in the TE-bone counterparts. (c) qRT-PCR analysis of vasculogenic mimicry markers. Relative endogenous expression of each gene was normalized to actin and the fold change was obtained normalizing to the levels in corresponding cell lines cultured in 2D. Data are shown as average ± SD (n=3–5). Statistical significance was determined by the two-tailed Student’s T test. *p < 0.05; **p < 0.01, ***p < 0.001; ns, not significant. (d) Representative images of PAS-stained sections from TE-bone and TE-ES models at week 2 and 4. Representative images are shown (n=3).
Then, we attempted to identify angiogenic proteins secreted by TE-ES tumors. By ELISA analysis of 24-hr supernatants, 56 human angiogenesis-related proteins were analyzed at week 2. Due to the differences in growth of different cell lines, it was not possible to directly compare secretion rates. However, these analyses clearly demonstrated that 8 proteins (Angiopoietin, CXCL16, Endothelin-1, FGF-7, IGFBP1-1, PIGF, TGF-β1 and TIMP4) were highly expressed in TE-RD-ES and TE-EW-GFP tumor models as compared to TE-bone (fold change >3). In contrast, none of these proteins was detected in the TE-SK-N-MC tumor model. These results confirm that the SK-N-MC cells failed to induce essential adaptive elements to survive and proliferate in TE-bone (Fig. 6b). Interestingly, Endothelin-1 is implicated in ES invasion while IGFBP1-1 prolongs the half-life of IGF-1, a known target gene of EWS-FLI and TGF-β1. These observations are consistent with previous studies, validating our system.
Finally, we evaluated vasculogenic mimicry (VM) in TE-ES models. Native ES is featured by the presence of blood lakes and PAS positive cells expressing endothelium-associated genes [35]. This property is stimulated by hypoxia [36]. Thus, VM can provide functional perfusion channels composed only of tumor cells. The endothelium-associated genes (LAMC2, TFPI1 and EPHA2) were highly expressed in the TE-RD-ES at weeks 2 and 4 (Fig. 6c), confirming VM in the TE-RD-ES model.
Consistent with all other data, cells in the SK-N-MC model re-expressed VM genes as levels lower than those measured for the TE-RD-ES model. However, these expression levels were significantly elevated at week 2 for TFP1 (p<0.01) and EPHA2 (p< 0.05), and at week 4 for LAMC2 (p<0.01) and EPHA2 (p< 0.05) as compared to SK-N-MC and TE-bone (Fig. 6c). Moreover, the TE-EW-GFP model expressed high levels of LAMC2, TFPI1 and EPHA2 at week 2 and 4 as compared to TE-bone (Fig. 6c). Tissue sections stained with PAS revealed positive areas in all the TE-ES models (except in TE-EW-GFP at week 2), as compared to negative-PAS TE-bone (Fig. 6d). Taken together, these results confirm that RD-ES cell line has higher capability to adapt to TE-bone than the SK-N-MC line.
4. Discussion
An obvious goal of cancer bioengineers is to develop human tumor models predictive of native tumors in vitro. Frequently used current models - spheroids of tumor cells and cells in porous scaffolds - capture 3D aspects with some control of oxygen tension and pH [37–42]. However, cancer is a complex disease where interactions between tumor cells and non-neoplastic cells play an important role in carcinogenesis [8]. Here, we have taken a step forward in modeling human tumors, by incorporating Ewing’s sarcoma cell spheroids into a bioengineered tridimensional bone niche, and thus enabling multiple interactions of tumor cells with other tumor cells, bone tissue matrix and bone cells.
A large body of work has demonstrated that tumor cell lines cultured in 2D lose their transcriptional profiles and downregulate many genes implicated in cell-cell and cell-ECM interactions, such as focal adhesion genes [1, 43]. We compared gene expression profiles of cell lines cultured in monolayers and native tumors, with focus on differentially expressed focal adhesion genes and cancer pathways. The induction of 12 genes in both TE-RD-ES and TE-SK-N-MC models evidenced a major role of microenvironment in the acquirement of tumor expression profile. Our model could thus be used for characterization of differentially expressed genes and help identify new tumor targets. Notably, we observed induction of CDC42 and PPP1R12A, both of which are related to Rho family of GTPases. Inhibition of some Rho pathway members through therapeutic compounds was successfully applied in preclinical studies [44, 45] suggesting that CDC42 and PPP1R12A are potential candidates for ES therapy.
Our results also show an important role of the bone niche in acquiring the features of native to cultured tumor cells, such as the hypoxic and glycolytic phenotypes, angiogenesis potential, and vasculogenic mimicry. Notably, the three ES cell lines tested in our study exhibited different behaviors in the bioengineered tumor model. The primary bone tumor RD-ES cell line seemed to perfectly mimic ESFT signature, the in vitro-generated EWS-GFP cell line only in part, and the metastatic SK-N-MC cell line did not recapitulate many of the tumor characteristics. Notably, these differences correlated to the expression levels of HIF1α (low in RD-ES cells, and high in SK-N-MC and EW-GFP cells), suggesting that HIF1α might play a protective role in the adaptation of tumor cells to hypoxia.
5. Conclusion
Here we describe a model of human bone cancer (Ewing’s sarcoma) engineered by introducing tumor cell spheroids into their resident bone tissue environment that has been formed by culturing human mesenchymal stem cells in decellularized bone matrix. This innovative model allows not only the cross-talk between the cancer cells, but also the interactions of cancer cells with the human bone cells and bone matrix. Within such native-like environment, we show that cancer cells (i) re-express focal adhesion and cancer related genes that are highly expressed in tumors but lost in monolayer cultures, (ii) recapitulate the original hypoxic and glycolytic tumor phenotypes, and (iii) acquire angiogenic capacity and vasculogenic mimicry that favor tumor initiation and adaptation. We propose that bioengineered models of human bone cancer can be valuable tools for identifying genes that are differentially expressed between cell lines and tumors, and studies of cancer biology. Our data point to a new direction in tumor modeling where tumor cells are studied within a 3D niche engineered to mimic the native host tissue. Some of the immediate needs include the inclusion of stromal cells, incorporation of tumor microvasculature and fine-tuned control of oxygen and nutrients, through the use perfusion bioreactors.
Supplementary Material
Acknowledgments
The authors thank Dr Marcos-Campos and Dr Bhumiratana for their contributions to the development of the tumor model, Dr. FY Lee for his help with Ewing’s sarcoma tumor identification, Dr. Manuel Serrano (CNIO, Madrid, Spain) for kindly providing the U2OS osteosarcoma cell line, HEK293T cell line and the pBabe-Puro-GFP plasmid, and Dr. ER. Lawlor, University of Michigan, for kindly providing the lentiviral plasmid containing the EWS/FLI mutation.
Footnotes
Publisher's Disclaimer: This is a PDF file of an unedited manuscript that has been accepted for publication. As a service to our customers we are providing this early version of the manuscript. The manuscript will undergo copyediting, typesetting, and review of the resulting proof before it is published in its final citable form. Please note that during the production process errors may be discovered which could affect the content, and all legal disclaimers that apply to the journal pertain.
AUTHOR CONTRIBUTIONS
AV conceived the project and designed experiments, GVN directed the work, AV and AM performed experiments and analyzed data, AV and GVN wrote the manuscript.
Disclosure of potential conflicts of interest
The authors declare no conflict of interest.
References
- 1.Smalley KS, Lioni M, Herlyn M. Life isn’t flat: taking cancer biology to the next dimension. In Vitro Cell Dev Biol Anim. 2006;42(8–9):242–247. doi: 10.1290/0604027.1. [DOI] [PubMed] [Google Scholar]
- 2.Chitcholtan K, Asselin E, Parent S, Sykes PH, Evans JJ. Differences in growth properties of endometrial cancer in three dimensional (3D) culture and 2D cell monolayer. Exp Cell Res. 2013;319(1):75–87. doi: 10.1016/j.yexcr.2012.09.012. [DOI] [PubMed] [Google Scholar]
- 3.Seok J, Warren HS, Cuenca AG, Mindrinos MN, Baker HV, Xu W, et al. Genomic responses in mouse models poorly mimic human inflammatory diseases. Proc Natl Acad Sci U S A. 2013;110(9):3507–3512. doi: 10.1073/pnas.1222878110. [DOI] [PMC free article] [PubMed] [Google Scholar]
- 4.van der Worp HB, Howells DW, Sena ES, Porritt MJ, Rewell S, O’Collins V, et al. Can animal models of disease reliably inform human studies? PLoS Med. 2010;7(3):e1000245. doi: 10.1371/journal.pmed.1000245. [DOI] [PMC free article] [PubMed] [Google Scholar]
- 5.Yamada KM, Cukierman E. Modeling tissue morphogenesis and cancer in 3D. Cell. 2007;130(4):601–610. doi: 10.1016/j.cell.2007.08.006. [DOI] [PubMed] [Google Scholar]
- 6.Nyga A, Cheema U, Loizidou M. 3D tumour models: novel in vitro approaches to cancer studies. J Cell Commun Signal. 2011;5(3):239–248. doi: 10.1007/s12079-011-0132-4. [DOI] [PMC free article] [PubMed] [Google Scholar]
- 7.Kimlin LC, Casagrande G, Virador VM. In vitro three-dimensional (3D) models in cancer research: an update. Mol Carcinog. 2013;52(3):167–182. doi: 10.1002/mc.21844. [DOI] [PubMed] [Google Scholar]
- 8.Liotta LA, Kohn EC. The microenvironment of the tumour-host interface. Nature. 2001;411(6835):375–379. doi: 10.1038/35077241. [DOI] [PubMed] [Google Scholar]
- 9.Bissell MJ, Hines WC. Why don’t we get more cancer? A proposed role of the microenvironment in restraining cancer progression. Nat Med. 2011;17(3):320–329. doi: 10.1038/nm.2328. [DOI] [PMC free article] [PubMed] [Google Scholar]
- 10.Olechnowicz SW, Edwards CM. Contributions of the host microenvironment to cancer-induced bone disease. Cancer Res. 2014;15;74(6):1625–1631. doi: 10.1158/0008-5472.CAN-13-2645. [DOI] [PMC free article] [PubMed] [Google Scholar]
- 11.Weilbaecher KN, Guise TA, McCauley LK. Cancer to bone: a fatal attraction. Nat Rev Cancer. 2011;11(6):411–425. doi: 10.1038/nrc3055. [DOI] [PMC free article] [PubMed] [Google Scholar]
- 12.Li H, Collado M, Villasante A, Strati K, Ortega S, Canamero M, et al. The Ink4/Arf locus is a barrier for iPS cell reprogramming. Nature. 2009;460(7259):1136–1139. doi: 10.1038/nature08290. [DOI] [PMC free article] [PubMed] [Google Scholar]
- 13.Serrano M, Lin AW, McCurrach ME, Beach D, Lowe SW. Oncogenic ras provokes premature cell senescence associated with accumulation of p53 and p16INK4a. Cell. 1997;88(5):593–602. doi: 10.1016/s0092-8674(00)81902-9. [DOI] [PubMed] [Google Scholar]
- 14.von Levetzow C, Jiang X, Gwye Y, von Levetzow G, Hung L, Cooper A, et al. Modeling initiation of Ewing sarcoma in human neural crest cells. PLoS One. 2011;6(4):e19305. doi: 10.1371/journal.pone.0019305. [DOI] [PMC free article] [PubMed] [Google Scholar]
- 15.Grayson WL, Frohlich M, Yeager K, Bhumiratana S, Chan ME, Cannizzaro C, et al. Engineering anatomically shaped human bone grafts. Proc Natl Acad Sci U S A. 2010;107(8):3299–3304. doi: 10.1073/pnas.0905439106. [DOI] [PMC free article] [PubMed] [Google Scholar]
- 16.Marcos-Campos I, Marolt D, Petridis P, Bhumiratana S, Schmidt D, Vunjak-Novakovic G. Bone scaffold architecture modulates the development of mineralized bone matrix by human embryonic stem cells. Biomaterials. 2012;33(33):8329–8342. doi: 10.1016/j.biomaterials.2012.08.013. [DOI] [PMC free article] [PubMed] [Google Scholar]
- 17.Pasque V, Gillich A, Garrett N, Gurdon JB. Histone variant macroH2A confers resistance to nuclear reprogramming. Embo J. 2011;30(12):2373–2387. doi: 10.1038/emboj.2011.144. [DOI] [PMC free article] [PubMed] [Google Scholar]
- 18.Savola S, Klami A, Myllykangas S, Manara C, Scotlandi K, Picci P, et al. High expression of complement component 5 (C5) at tumor site associates with superior survival in Ewing’s sarcoma family of tumour patients. Cancer Lett. 2007;254(1):1–10. doi: 10.5402/2011/168712. [DOI] [PMC free article] [PubMed] [Google Scholar]
- 19.Riggi N, Stamenkovic I. The Biology of Ewing sarcoma. Cancer Lett. 2007;254(1):110. doi: 10.1016/j.canlet.2006.12.009. [DOI] [PubMed] [Google Scholar]
- 20.Mackintosh C, Madoz-Gurpide J, Ordonez JL, Osuna D, Herrero-Martin D. The molecular pathogenesis of Ewing’s sarcoma. Cancer Biol Ther. 2010;9(9):655–667. doi: 10.4161/cbt.9.9.11511. [DOI] [PubMed] [Google Scholar]
- 21.Carvajal R, Meyers P. Ewing’s sarcoma and primitive neuroectodermal family of tumors. Hematol Oncol Clin North Am. 2005;19(3):501–525. vi–vii. doi: 10.1016/j.hoc.2005.03.004. [DOI] [PubMed] [Google Scholar]
- 22.Tsokos M, Alaggio RD, Dehner LP, Dickman PS. Ewing sarcoma/peripheral primitive neuroectodermal tumor and related tumors. Pediatr Dev Pathol. 2012;15(1 Suppl):108–126. doi: 10.2350/11-08-1078-PB.1. [DOI] [PMC free article] [PubMed] [Google Scholar]
- 23.Riggi N, Suva ML, Suva D, Cironi L, Provero P, Tercier S, et al. EWS-FLI-1 expression triggers a Ewing’s sarcoma initiation program in primary human mesenchymal stem cells. Cancer Res. 2008;68(7):2176–2185. doi: 10.1158/0008-5472.CAN-07-1761. [DOI] [PubMed] [Google Scholar]
- 24.Marolt D, Campos IM, Bhumiratana S, Koren A, Petridis P, Zhang G, et al. Engineering bone tissue from human embryonic stem cells. Proc Natl Acad Sci U S A. 2012;109(22):8705–8709. doi: 10.1073/pnas.1201830109. [DOI] [PMC free article] [PubMed] [Google Scholar]
- 25.de Peppo GM, Marcos-Campos I, Kahler DJ, Alsalman D, Shang L, Vunjak-Novakovic G, et al. Engineering bone tissue substitutes from human induced pluripotent stem cells. Proc Natl Acad Sci U S A. 2013;110(21):8680–8685. doi: 10.1073/pnas.1301190110. [DOI] [PMC free article] [PubMed] [Google Scholar]
- 26.Wilson WR, Hay MP. Targeting hypoxia in cancer therapy. Nat Rev Cancer. 2011;11(6):393–410. doi: 10.1038/nrc3064. [DOI] [PubMed] [Google Scholar]
- 27.Scotlandi K, Benini S, Sarti M, Serra M, Lollini PL, Maurici D, et al. Insulin-like growth factor I receptor-mediated circuit in Ewing’s sarcoma/peripheral neuroectodermal tumor: a possible therapeutic target. Cancer Res. 1996;56(20):4570–4574. [PubMed] [Google Scholar]
- 28.O’Neill A, Shah N, Zitomersky N, Ladanyi M, Shukla N, Uren A, et al. Insulin-like growth factor 1 receptor as a therapeutic target in ewing sarcoma: lack of consistent upregulation or recurrent mutation and a review of the clinical trial literature. Sarcoma. 2013:450478. doi: 10.1155/2013/450478. 2013. [DOI] [PMC free article] [PubMed] [Google Scholar]
- 29.Wachsberger P, Burd R, Dicker AP. Tumor response to ionizing radiation combined with antiangiogenesis or vascular targeting agents: exploring mechanisms of interaction. Clin Cancer Res. 2003;9(6):1957–1971. [PubMed] [Google Scholar]
- 30.Keith B, Simon MC. Hypoxia-inducible factors, stem cells, and cancer. Cell. 2007;129(3):465–472. doi: 10.1016/j.cell.2007.04.019. [DOI] [PMC free article] [PubMed] [Google Scholar]
- 31.Mueller-Klieser W. Tumor biology and experimental therapeutics. Crit Rev Oncol Hematol. 2000;36(2–3):123–139. doi: 10.1016/s1040-8428(00)00082-2. [DOI] [PubMed] [Google Scholar]
- 32.Jiang Y, Pjesivac-Grbovic J, Cantrell C, Freyer JP. A multiscale model for avascular tumor growth. Biophys J. 2005;89(6):3884–3894. doi: 10.1529/biophysj.105.060640. [DOI] [PMC free article] [PubMed] [Google Scholar]
- 33.Hanahan D, Folkman J. Patterns and emerging mechanisms of the angiogenic switch during tumorigenesis. Cell. 1996;86(3):353–364. doi: 10.1016/s0092-8674(00)80108-7. [DOI] [PubMed] [Google Scholar]
- 34.Carmeliet P, Dor Y, Herbert JM, Fukumura D, Brusselmans K, Dewerchin M, et al. Role of HIF-1alpha in hypoxia-mediated apoptosis, cell proliferation and tumour angiogenesis. Nature. 1998;394(6692):485–490. doi: 10.1038/28867. [DOI] [PubMed] [Google Scholar]
- 35.van der Schaft DW, Hillen F, Pauwels P, Kirschmann DA, Castermans K, Egbrink MG, et al. Tumor cell plasticity in Ewing sarcoma, an alternative circulatory system stimulated by hypoxia. Cancer Res. 2005;65(24):11520–11528. doi: 10.1158/0008-5472.CAN-05-2468. [DOI] [PubMed] [Google Scholar]
- 36.Folberg R, Hendrix MJ, Maniotis AJ. Vasculogenic mimicry and tumor angiogenesis. Am J Pathol. 2000;156(2):361–381. doi: 10.1016/S0002-9440(10)64739-6. [DOI] [PMC free article] [PubMed] [Google Scholar]
- 37.Fischbach C, Chen R, Matsumoto T, Schmelzle T, Brugge JS, Polverini PJ, et al. Engineering tumors with 3D scaffolds. Nat Methods. 2007;4(10):855–860. doi: 10.1038/nmeth1085. [DOI] [PubMed] [Google Scholar]
- 38.Moreau JE, Anderson K, Mauney JR, Nguyen T, Kaplan DL, Rosenblatt M. Tissue-engineered bone serves as a target for metastasis of human breast cancer in a mouse model. Cancer Res. 2007;67(21):10304–10308. doi: 10.1158/0008-5472.CAN-07-2483. [DOI] [PubMed] [Google Scholar]
- 39.Sieh S, Lubik AA, Clements JA, Nelson CC, Hutmacher DW. Interactions between human osteoblasts and prostate cancer cells in a novel 3D in vitro model. Organogenesis. 2010;6(3):181–188. doi: 10.4161/org.6.3.12041. [DOI] [PMC free article] [PubMed] [Google Scholar]
- 40.Talukdar S, Mandal M, Hutmacher DW, Russell PJ, Soekmadji C, Kundu SC. Engineered silk fibroin protein 3D matrices for in vitro tumor model. Biomaterials. 2011;32(8):2149–2159. doi: 10.1016/j.biomaterials.2010.11.052. [DOI] [PubMed] [Google Scholar]
- 41.Tan PH, Aung KZ, Toh SL, Goh JC, Nathan SS. Three-dimensional porous silk tumor constructs in the approximation of in vivo osteosarcoma physiology. Biomaterials. 2011;32(26):6131–6137. doi: 10.1016/j.biomaterials.2011.04.084. [DOI] [PubMed] [Google Scholar]
- 42.Fong EL, Lamhamedi-Cherradi SE, Burdett E, Ramamoorthy V, Lazar AJ, Kasper FK, et al. Modeling Ewing sarcoma tumors in vitro with 3D scaffolds. Proc Natl Acad Sci U S A. 2013;110(16):6500–6505. doi: 10.1073/pnas.1221403110. [DOI] [PMC free article] [PubMed] [Google Scholar]
- 43.Zschenker O, Streichert T, Hehlgans S, Cordes N. Genome-wide gene expression analysis in cancer cells reveals 3D growth to affect ECM and processes associated with cell adhesion but not DNA repair. PLoS One. 2012;7(4):e34279. doi: 10.1371/journal.pone.0034279. [DOI] [PMC free article] [PubMed] [Google Scholar]
- 44.Fritz G, Kaina B. Rho GTPases: promising cellular targets for novel anticancer drugs. Curr Cancer Drug Targets. 2006;6(1):1–14. [PubMed] [Google Scholar]
- 45.Lu Q, Longo FM, Zhou H, Massa SM, Chen YH. Signaling through Rho GTPase pathway as viable drug target. Curr Med Chem. 2009;16(11):1355–1365. doi: 10.2174/092986709787846569. [DOI] [PMC free article] [PubMed] [Google Scholar]
Associated Data
This section collects any data citations, data availability statements, or supplementary materials included in this article.