

Abstract
Development of obesity in animals is affected by energy intake, dietary composition, and metabolism. Useful models for studying this metabolic problem are Sprague-Dawley rats fed low-fat (LF) or high-fat (HF) diets beginning at 28 days of age. Through experimental design, their dietary intakes of energy, protein, vitamins, and minerals per kg body weight (BW) do not differ in order to eliminate confounding factors in data interpretation. The 24-h energy expenditure of rats is measured using indirect calorimetry. A regression model is constructed to accurately predict BW gain based on diet, initial BW gain, and the principal component scores of respiratory quotient and heat production. Time-course data on metabolism (including energy expenditure) are analyzed using a mixed effect model that fits both fixed and random effects. Cluster analysis is employed to classify rats as normal-weight or obese. HF-fed rats are heavier than LF-fed rats, but rates of their heat production per kg non-fat mass do not differ. We conclude that metabolic conversion of dietary lipids into body fat primarily contributes to obesity in HF-fed rats.
Keywords: Obesity, Energy Expenditure, Indirect Calorimetry, Statistical Analysis, Review
2. INTRODUCTION
The incidence of obesity is increasing worldwide, which is caused by greater energy intake than energy expenditure over a prolonged period of time (1, 2). The excess energy is stored as triacylglycerols in adipocytes of white adipose tissue. This metabolic disorder is closely associated with many adverse health problems and is a major risk factor for type II diabetes, cardiovascular disease and some types of cancer (3–5). Genetics can predispose people to gain excessive white adipose tissue. However, the environment (including diet and physical activity) is likely a primary contributor to the increase in global human obesity in recent decades (1, 2). Specifically, high intake of dietary saturated fat plays an important role in the development of obesity in humans (1) and other animals (6, 7). Although there are suggestions that dietary intake of animal protein is positively related to overweight and obesity in humans (8–10), increasing consumption of L-arginine has been reported to reduce white adipose tissue and improve metabolic profiles in growing rats (11), diet-induced obese rats (12, 13), Zucker diabetic fatty rats (14–16), pigs fed a corn- and soybean meal-based diet (17, 18), and obese subjects with type-II diabetes mellitus (19) through both nitric oxide-dependent and independent mechanisms (21–23). Additionally, dietary intake of glutamate, which is a major amino acid in foods of animal and plant origin (24) and activates taste receptors in the digestive tract (25, 26), can enhance diet-induced thermogenesis in brown adipose tissue of young adult rats (27) and reduce white-fat deposition in adult rats (28) and in growing pigs (29). At present, it is not known, under conditions of over-nutrition (e.g., excessive consumption of dietary saturated fatty acids and carbohydrates), whether obesity in humans and other animals results primarily from metabolic conversion of dietary fat into body fat, reduced energy expenditure (cellular thermogenesis), or both.
Because of ethical concerns over studies involving human subjects, animal models have been widely used to study the mechanisms responsible for the development of obesity (30–33). A useful model is male Sprague-Dawley rats, which are fed a low-fat (LF) or high-fat (HF) diet beginning at 28 days of age (12). Over the entire experimental period, dietary intakes of energy, protein, vitamins, and minerals per kg body weight do not differ between the two groups of rats so as to eliminate confounding factors in data interpretation. To measure the 24-h energy expenditure of rats, they are placed individually in a computer-controlled Oxymax instrument (an open-circuit calorimeter) to obtain the following parameters: the volume of O2 consumption (VO2), the volume of CO2 production (VCO2), respiratory quotient (RQ), and heat production (HP) (34). A regression model is then constructed to predict body weight gain based on diet, initial body weight gain, as well as the principal component scores of RQ and heat production. This approach requires interdisciplinary collaboration and expertise in nutrition, metabolism and statistics.
The overall effects of dietary treatment and time on RQ, HP, VO2 and VCO2 are statistically analyzed using a mixed effect model that fits both fixed and random effects (35, 36). The fixed effects include diet type, a cubic polynomial of time within day in hours and different slopes by diet (diet x time interaction). The random effects allow different animals to have different intercepts. A random slope is also included in mixed models and can be removed later on if it is statistically not significant. Data on food and energy intake can also be analyzed similarly using a mixed effect model. The diet effect is then determined using a likelihood ratio test (36). Statistical data on RQ, HP, VO2, and VCO2 are then summarized using the functional principal component analysis (FPCA) (37). Furthermore, a regression model is constructed to predict weight gain in adult animals based on diet, initial body weight gain, and the principal component scores of RQ and HP (35, 36). Finally, cluster analysis is employed to classify rats as either normal-weight or obese. Values of P ≤ 0.05 are taken to indicate statistical significance. All statistical analyses are run using the R 2.15.1 software for Windows (38).
3. MODELS OF DIET-INDUCED OBESITY
3.1. HF diets for induction of obesity in rats
HF diets reduce food intake by animals through both central (brain) and peripheral (intestine) mechanisms that regulate the production of neural, hormonal and metabolic signals (e.g., serotonin, glucose and fatty acids) (39, 40). Thus, the contents of energy, protein and micronutrients in a HF diet must be proportionately higher than those in a LF diet, depending on the extent of reduction in food intake by HF-fed rats compared with LF-fed rats per kg body weight (Table 1). This ensures similar intakes of energy, amino acids, vitamins, and minerals between LF- and HF-fed rats and also helps prevent deficiencies of these nutrients in the HF group, when all the rats are allowed to have free access to their respective diets (Table 2). An example for LF and HF diets is given in Table 1 (Research Diets, New Brunswick, NJ), which has been used to feed Sprague-Dawley rats beginning at 28 days of age (one week after weaning) (12). Note that the LF (4.3% fat) and HF (23.6% fat) diets provide 10% and 40% of total energy as lipids (mainly lard), respectively and that the ratios of protein, vitamins, minerals, and fiber to energy are constant in the LF and HF diets. Both diets use casein (88.1% protein) as the source of protein and are supplemented with L-cystine to provide adequate amounts of total sulfur-containing amino acids. Compared with the LF diet, the HF diet does not affect the consumption of water by rats (12). A significant increase (+8.5%) in the body weight of rats occurs after they have been fed the HF diet for 9 weeks between 4 and 13 weeks of age (Table 3). In rats fed the HF diet, fat content in the body increases by 20.3% while the non-fat content decreases by 3.7%, when compared with the LF group (Table 4). Overall, at 13 weeks of age, total amounts of fat per rat are 73 and 95 g, respectively, in the LF and HF groups, whereas total amounts of non-fat mass (lean tissues) per rat are 403 and 423 g, respectively, in the LF and HF groups. Skeletal muscle primarily contributes to the increase in the absolute amount of lean tissues in rats fed the HF diet (Table 4).
Table 1.
Composition of low-fat (LF) and high-fat (HF) diets for rats
| Ingredient | LF diet1 | HF diet2 | ||
|---|---|---|---|---|
| Composition, % | kJ/kg diet5 | Composition, % | kJ/kg diet5 | |
| Casein (88.1% protein) | 18.96 | 3173 | 23.31 | 3901 |
| L-Cystine | 0.284 | 48 | 0.350 | 59 |
| Corn starch | 29.85 | 4996 | 8.48 | 1419 |
| Maltodextrin-10 | 3.32 | 556 | 11.65 | 1950 |
| Sucrose | 33.17 | 5552 | 20.14 | 3371 |
| Cellulose | 4.74 | 0 | 5.83 | 0 |
| Soybean Oil | 2.37 | 892 | 2.91 | 1096 |
| Lard | 1.90 | 715 | 20.68 | 7788 |
| Mineral mix S100263 | 0.95 | 63 | 1.17 | 78 |
| Dicalcium phosphate | 1.23 | 0 | 1.51 | 0 |
| Calcium carbonate | 0.521 | 0 | 0.641 | 0 |
| Potassium citrate | 1.56 | 0 | 1.92 | 0 |
| Vitamin mix V100014 | 0.95 | 159 | 1.17 | 196 |
| Choline bitartrate | 0.19 | 0 | 0.233 | 0 |
| Yellow dye | 0.005 | 0 | 0 | 0 |
| Red dye | 0 | 0 | 0.006 | 0 |
| Total | 100 | 16155 | 100 | 19858 |
Containing 67.3% carbohydrate, 4.3% fat, and 17.0% protein on an as-fed basis.
Containing 41.0% carbohydrate, 23.6% fat, and 20.9% protein on an as-fed basis.
Containing the following (g/kg mineral mix): magnesium oxide, 41.9; magnesium sulfate.7H2O, 257.6; sodium chloride, 259; chromium KSO4.12H2O, 1.925; cupric carbonate, 1.05; potassium iodate, 0.035; ferric citrate, 21; manganous carbonate, 12.25; sodium selenite, 0.035; zinc carbonate, 5.6; sodium fluoride, 0.20; ammonium molybdate.4H2O, 0.30; sucrose, 399.105. Sucrose in the mineral mix provided 63 kJ energy/kg diet.
Containing the following (g/kg vitamin mix): retinyl palmitate, 0.80; cholecalciferol, 1.0; all-rac-α-tocopheryl acetate, 10; menadione sodium bisulfite, 0.08; biotin (1.0%), 2.0; cyancocobalamin (0.1%), 1.0; folic acid, 0.20; nicotinic acid, 3.0; calcium pantothenate, 1.6; pyridoxine-HCl, 0.70; riboflavin, 0.60; thiamin-HCl, 0.60; and sucrose, 978.42. Sucrose in the vitamin mix provided 159 kJ energy/kg diet.
For conversion to Kcal/kg diet, 1 cal = 4.184 J.
Table 2.
Intakes of food, energy and nutrients by male Sprague-Dawley rats (Charles River Laboratories) fed a low-fat or high-fat diet between 4 and 13 weeks of age1,2
| Intakes of food, energy and nutrients | Low-fat diet | High-fat diet |
|---|---|---|
| Food, g/kg body weight/day | 71.28 ± 1.65a | 59.80 ± 1.39b |
| Energy, kJ/kg body weight/day | 1151.5 ± 26.7 | 1187.5 ± 27.7 |
| Protein, g/kg body weight/day | 12.12 ± 0.28 | 12.49 ± 0.29 |
| Carbohydrate, g/kg body weight/day 3 | 48.65 ± 1.11a | 25.03 ± 0.57b |
| Fat, g/kg body weight/day | 3.06 ± 0.07a | 14.11 ± 0.33b |
Male Sprague-Dawley rats were obtained from Charles River Laboratories. At 23 days of age, rats arrived at the Texas A&M University Kleberg Center animal facilities and then were housed individually in carbonate cages in a temperature- and humidity-controlled room on a 12 h light /12 h dark cycle. After a 5-day period of adaptation to the facilities, during which rats were fed a regular non-purified diet (Harlan Teklad Catalog no. 8604), they were assigned randomly to either a low-fat (LF) or a high-fat (HF) diet (n = 16/diet) (12) as shown in Table 1. Body weight and food intake of rats were recorded on a weekly basis between 4 and 13 wk of age.
Values are means ± SEM, n = 16 rats/diet group.
Excluding cellulose.
Means in a row without a common letter differ, P < 0.05, as analyzed by the unpaired t-test.
Table 3.
Body weights of male Sprague-Dawley rats (Charles River Laboratories) fed a low-fat or high-fat diet between 4 and 13 weeks of age1,2
| Diet | Statistical summary | Weeks post initiation of low-fat or high-fat feeding | |||||||||
|---|---|---|---|---|---|---|---|---|---|---|---|
| 0 | 1 | 2 | 3 | 4 | 5 | 6 | 7 | 8 | 9 | ||
| 67.40 | 102.8 | 157.4 | 220.4 | 265.5 | 306.3 | 343.2 | 348.5 | 379.5 | 400.0 | ||
| 1st Q | 77.50 | 122.9 | 180.1 | 239.9 | 297.7 | 346.3 | 386.0 | 408.6 | 421.6 | 450.6 | |
| Median | 84.95 | 133.4 | 195.2 | 260.9 | 321.9 | 368.3 | 403.1 | 432.8 | 448.2 | 486.6 | |
| Mean | 82.65 | 129.5 | 191.7 | 257.1 | 314.0 | 362.2 | 401.7 | 432.1 | 448.9 | 480.9a | |
| 3rd Q | 88.50 | 138.3 | 205.2 | 268.5 | 332.0 | 384.4 | 426.9 | 465.2 | 479.9 | 515.2 | |
| Max | 96.10 | 144.2 | 212.0 | 285.2 | 347.6 | 401.8 | 460.4 | 500.2 | 520.5 | 558.2 | |
| SEM | 2.14 | 3.05 | 4.18 | 4.48 | 6.45 | 7.54 | 8.93 | 10.86 | 10.35 | 11.47 | |
| High Fat | Min | 64.80 | 111.9 | 165.8 | 213.2 | 267.5 | 313.8 | 347.1 | 347.9 | 382.6 | 415.0 |
| 1st Q | 76.97 | 123.9 | 183.4 | 246.3 | 305.8 | 356.7 | 388.0 | 415.3 | 430.9 | 459.2 | |
| Median | 84.80 | 136.6 | 198.0 | 260.6 | 320.9 | 379.1 | 430.6 | 469.0 | 490.1 | 526.4 | |
| Mean | 82.65 | 134.1 | 196.7 | 261.2 | 324.1 | 377.4 | 421.2 | 457.5 | 479.9 | 522.0b | |
| 3rd Q | 88.38 | 140.4 | 206.3 | 277.3 | 348.4 | 398.8 | 445.9 | 491.3 | 522.5 | 552.2 | |
| Max | 96.40 | 154.1 | 229.0 | 309.7 | 373.0 | 432.3 | 483.1 | 525.4 | 564.5 | 614.7 | |
| SEM | 2.13 | 3.02 | 4.74 | 6.32 | 7.29 | 8.3 | 10.08 | 12.71 | 13.43 | 14.45 | |
See Table 2 for experimental detail.
Values (expressed as gram) are means ± SEM, n = 16 rats/diet group. In the 2nd column, Min: Minimum, 1st Q: 25th percentile; 3rd Q: 75th percentile, Max: Maximum. Week 0 = 4 weeks of age (28 days of age).
Means in a column without a common letter differ, P < 0.05, as analyzed by the unpaired t-test.
Table 4.
Weights of tissues of 13-week-old rats (Charles River Laboratories) fed a low-fat or high-fat diet between 4 and 13 weeks of age1,2
| Variable | Low-fat group | High-fat group |
|---|---|---|
| Body weight, g | 476 ± 12 | 518 ± 14† |
| Tissue weight, g | ||
| •Heart | 1.74 ± 0.06 | 1.96 ± 0.05* |
| •Lungs | 1.81 ± 0.07 | 2.07 ± 0.08* |
| •Liver | 12.6 ± 0.37 | 13.9 ± 0.35* |
| •Spleen | 0.83 ± 0.02 | 0.85 ± 0.03 |
| •Kidneys | 2.76 ± 0.05 | 2.94 ± 0.06* |
| •Retroperitoneal adipose tissue | 8.66 ± 0.32 | 11.4 ± 0.39† |
| •Epididymal adipose tissue | 8.57 ± 0.36 | 10.9 ± 0.41† |
| •Inguinal adipose tissue | 7.92 ± 0.28 | 10.6 ± 0.35† |
| •Mesenteric adipose tissue | 4.01 ± 0.13 | 5.30 ± 0.28† |
| •Major white-fat3 | 29.3 ± 1.8 | 38.4 ± 2.4† |
| •Brown adipose tissue | 0.68 ± 0.03 | 0.67 ± 0.03 |
| •Small intestine | 6.16 ± 0.20 | 6.88 ± 0.23* |
| •Pancreas | 0.94 ± 0.03 | 0.95 ± 0.04 |
| •Soleus muscle | 0.208 ± 0.005 | 0.232 ± 0.006† |
| •EDL muscle | 0.214 ± 0.006 | 0.239 ± 0.008* |
| •Testes | 3.75 ± 0.04 | 3.78 ± 0.05 |
| •Brain | 1.72 ± 0.05 | 1.76 ± 0.06 |
| Fat and non-fat mass4, % | ||
| •Fat mass | 15.3 ± 0.8 | 18.4 ± 1.1* |
| •Non-fat mass | 84.7 ± 0.8 | 81.6 ± 1.1* |
See Table 2 for experimental detail.
Values (expressed as gram) are means ± SEM, n = 8 rats/diet group. Rats were fed a low-fat or high-fat diet between 4 and 13 weeks of age, and euthanized at 13 weeks of age to obtain tissues. Individual animals were homogenized to determine fat and non-fat mass (33).
The sum of epididymal, mesenteric, retroperitoneal and inguinal (subcutaneous) adipose tissues.
In rats fed the high-fat diet, fat content in the body increases by 20.3% while the non-fat content decreases by 3.7%, when compared with the low-fat group. Overall, at 13 weeks of age, total amounts of fat per rat are 73 and 95 g, respectively, in the low-fat and high-fat groups, whereas total amounts of non-fat mass (lean tissues) per rat are 403 and 423 g, respectively, in the low-fat and high-fat groups.
P < 0.05 and
P < 0.01 vs the normal-weight group, as analyzed by the unpaired t-test. EDL, extensor digitorum longus.
3.2. Sex, strain and sources of rats
ale rats are often used to study diet-induced obesity (12) to avoid drastic changes in reproductive hormones associated with the physiological estrus cycle in females (41). However, female rats have also been employed to address sex-specific differences in responses to nutritional alterations and to determine impacts of maternal nutrition on fetal and postnatal development (42). Both Harlan Laboratories (Houston, TX) and Charles River Laboratories (Wilmington, MA) provide outbred Sprague-Dawley rats and Wistar rats for studies involving diet-induced obesity. There are inter-strain differences in genetic backgrounds, endocrine status, metabolism, and growth between these two strains of rats (43–47). For example, although Sprague-Dawley and Wistar rats have similar energy intake and body weight gain, Wistar rats possess a greater amount of final body fat than Sprague-Dawley rats, regardless of the type of diet (48). In addition, intra-strain differences exist for either Sprague-Dawley rats (49–51) or Wistar rats (52–54), depending on sources of the animals and their breeding locations. For example, Sprague-Dawley rats obtained from Charles River Laboratories gained body weight (Table 3) and white adipose tissue (Table 4) faster than Sprague-Dawley rats supplied by Harlan Laboratories (12), even though they were housed in the same animal facilities and fed the same diet. Specifically, at 13 weeks of age, the mean body weights of Sprague-Dawley rats from Charles River and Harlan Laboratories were approximately 480 and 380 g, respectively, when they were fed a LF diet (Table 1). Of note, results of studies with Sprague-Dawley rats from either Charles River Laboratories or Harlan Laboratories have shown that not all of them become obese in response to HF feeding and a subset of them is resistant to the development of obesity (55–57). This phenomenon should be considered in research plan, experimental design, and data interpretation (58–60).
4. DETERMINATION OF THE ENERGY EXPENDITURE OF RATS
4.1. Heat production by animals
According to the first law of thermodynamics (energy conservation), energy is neither destroyed nor created and it is only converted from one form into the other. Energy needs of animals are met by the oxidation of fatty acids, glucose and amino acids in a cell- and tissue-specific manner (23). Based on the fact that oxidation of 1 mol NADH and 1 mol FADH2 yields 2.5 mol and 2 mol ATP in cell metabolism, respectively, ~ 55% of the chemical energy in glucose and fatty acids and ~42% of the chemical energy in protein are conserved in energy-rich phosphate bonds (primarily ATP), with the remaining being converted into heat (61). Energy-dependent biochemical reactions and physiological processes (e.g., protein turnover, the urea cycle, gluconeogenesis, nutrient transport, various “futile cycles”, Na/K-ATPase activity, renal function, gut motility, as well as cardiac and skeletal muscular contractions) utilize approximately one-third of the energy released from ATP hydrolysis, with the remaining chemical energy being converted into heat (62, 63). In cells, rates of ATP utilization are precisely matched by rates of ATP production. In mammals (e.g., rats and humans) possessing brown adipose tissue, its unique uncoupling protein-1 inhibits ATP synthesis from ADP and Pi, thereby dissipating all the chemical energy from mitochondrial substrate oxidation into heat (23). Thus, the energy released from the oxidation of macronutrients is ultimately transformed into heat in animals.
4.2. Indirect calorimetry for measurement of energy expenditure
Indirect calorimetry is a technique that provides accurate estimates of heat production (an indicator of energy expenditure) from measures of CO2 production and O2 consumption by an animal (58), thereby eliminating the need of using a complex, delicate, and costly instrument to directly determine heat production by animals (direct calorimetry). Advances in gas exchange measurement have made indirect calorimetry readily available for research involving humans and rodents (59). This technique is based on the principles that: (1) there are no considerable reserves of inhaled O2 in animals and their consumption of O2 reflects the oxidation of organic nutrients in the bodies; (2) chemical energy in animals is derived from the oxidation of carbohydrates, fatty acids, and amino acids to CO2 and H2O; (3) the ratios of O2 consumption to CO2 production resulting from the oxidation of these macronutrients are constant in animals; (4) the oxidation of fatty acids, glucose and non-nitrogenous substances to CO2 and H2O in animals yields the same amounts of heat as those from combustion in a bomb calorimeter; and (5) the oxidation of amino acids in animals generates urea (as the major nitrogenous end-product), CO2 and H2O (58–60). Requirements of O2 for heat production differ among macronutrients, as consumption of 1 mol O2 by the animal for the oxidation of glucose, fatty acid (palmitate), and protein produces 5.00, 4.61, and 4.49 mol ATP, respectively (61).
The following procedures of indirect calorimetry (Oxymax instrument, Columbus Instruments, Ohio, USA) are usually performed at a room temperature of 25°C, unless specified in experimental designs.
Turn on the Gas Instrument’s main power, Carbon Dioxide Sensor, System Sample Pump, and the computer at least 1 h before performing Step 2.
Select OxyMaxWin V4.21 on the computer.
Use the default configuration. Select “Yes”. Make sure that the sample flow ball is at 0.5.
Select “Experiment” and then select “Experiment File Open”.
Select a file previously created for rat RQ measurements (e.g., testwu-11-12-08).
Select “Experiment”. Then, select “set up”. Add rat body-weight data and a flow rate to the table. Select “Browse”. Go to computer disk drive C, type a file name, and save the file. Note: Air flow rate is set based on rat body weight (e.g., 2.5 for a 300 g rat, 3.0 for a 400 g rat, and 3.5 for a 500 g rat).
Select “Apply” and then select “Close”.
Turn on the Calibration Gas tank.
Go to “Experiment”. Select “Calibrate”. Calibrate the Oxymax instrument according to the certified values of a specified gas mixture (e.g., 20.5% O2, 0.50% CO2, and 79% N2). After calibration of both O2 and CO2, turn off the Calibration Gas tank.
Select “Experiment” and then select “Run” to start the measurement. Note: Rats are stable within the first 30 min after they are placed in metabolic cages. Thereafter, the measurement of heat production can be initiated..
At the end of the measurements for all animals, select “Experiment” and then select “Stop” for termination.
Sequentially select “File”, “Create file”, and “CSV”. Note: The data are now saved as an Excel file. All the Excel files can be exported to a flash drive for subsequent use in data analysis.
Turn off Carbon Dioxide Sensor, System Sample Pump, the Gas Instrument main power, and the computer.
4.3. Closed- and open-circuit methods in indirect calorimetry
There are closed- and open-circuit methods for indirect calorimetry. In the closed-circuit system, the animal breathes the same air from the chamber or prefilled container (spirometer), CO2 in expired air is absorbed by a canister of soda lime (potassium hydroxide) in the breathing circuit for its measurement, and an oxygen analyzer attached to the chamber or spirometer records O2 uptake based on changes in the system’s O2 volume. Because O2 is continuously used by the animal, the chamber or environment will eventually become hypoxic in a closed-circuit system, thus limiting the period of the RQ measurement. In contrast, in the open-circuit system, the animal inhales ambient air with a constant composition of O2 (e.g., 20.93%), CO2 (e.g., 0.04%) and N2 (e.g., 79.04%), and expired gases are then analyzed. The changes of O2 and CO2 percentages in expired air, compared with those in inspired ambient air, indirectly reflect rates of energy metabolism in the body. Additionally, in the open-circuit system, air flows through the chamber at a rate that constantly replenishes the O2 depleted by the animal, while simultaneously removing the CO2 and water vapor produced by the animal. Because of its convenience, the computer-controlled open-circuit indirect calorimetry is now widely used for measuring energy expenditure in animals for hours or days (58, 59).
4.4. Use of the open-circuit indirect calorimetry to measure energy expenditure in rats
Caution should be taken in using an open-circuit calorimeter to measure 24-h O2 consumption and CO2 production by rats (59). For example, animals should be familiar with the chamber environment before the RQ is determined. In our procedures (34), three days before the measurement, animals are placed in their assigned metabolic cages (1 rat/cage) for 4 h each day to acclimatize them to the cages. On the day of measurement, individual rats are placed in their metabolic cages for 0.5 to 1 h before any measurement is taken in an environmentally controlled room (25°C). Drinking water and food should be available to the rats at all times. Energy expenditure (indicated by heat production) of the animals is determined every 3 or 4 weeks (depending on experimental design) by placing them individually between 9:00 and 11:00 AM in their cages. It is recommended that one rat from each treatment group be simultaneously analyzed for energy expenditure to minimize experimental errors between treatment groups and that the normal light cycle be used for all the animals. Additionally, gas analyzers should be calibrated using a standard gas mixture containing known concentrations of CO2 (e.g., 0.50%), O2 (e.g., 20.5%), and N2 (e.g., 79%) before the measurement of O2 and CO2 starts on each day.
In a 4-chamber system, a 2-min measurement of O2 consumption and CO2 production is made for each rat, followed by a 2-min wash-out period after four rats are analyzed in a cycle. Thus, there are 6 observations for VO2, VCO2, RQ, and heat production per hour during a 24-h period. The mean within each hour of the measurement is then computed, leading to 24 observations per rat in a day, as illustrated, for example, in Figure 1. RQ is defined as the ratio of the volume of CO2 produced (e.g., L/kg body weight/h) to the volume of O2 consumed (e.g., L/kg body weight/h), i.e., RQ = VCO2/VO2 (60). Note that RQ has no unit. The function of the lungs should be normal to obtain accurate values of O2 consumption and CO2 production by animals. HP is then calculated from the values of O2 consumption and CO2 production according to the Brouwer equation (62): HP (Kcal) = 3.82 × VO2 (in L) + 1.15 × VCO2 (in L). If the unit of VO2 and VCO2 is L/kg body weight/h, the unit of HP is Kcal/kg body weight/h. An example is provided for 13-week-old Sprague-Dawley rats (Charles River Laboratories) fed a LF or HF diet (Table 5). Values of VO2 and VCO2 are affected by dietary composition. The HF and LF diets differ in the major sources of dietary energy [lard vs digestible carbohydrates (i.e., cornstarch + sucrose)]. Although the dietary intake of energy per kg body weight is similar between the two groups of rats, the body weights of HF-fed rats are greater, but the rates of whole-body heat production per kg body weight are lower, than those for LF-fed rats at 13 weeks of age (Table 5). However, when data on energy metabolism in 13-week-old rats are expressed per kg non-fat mass, rates of heat production do not differ between the LF and HF groups (Table 6). Similarly, HF feeding between 4 and 8 weeks of age does not affect rates of heat production by 8-week-old rats when values are expressed per kg non-fat mass (12.9 ± 0.14 vs 12.8 ± 0.12 Kcal/kg non-fat mass/h, for HF and LF groups, respectively; means ± SEM, n = 16; P > 0.05). Clearly, consumption of saturated fat favors the deposition of triacylglycerols in the body but does not affect energy expenditure in Sprague-Dawley rats. Therefore, metabolic conversion of dietary lipids into body fat primarily contributes to obesity in HF-fed animals.
Figure 1.

Energy metabolism of male Sprague-Dawley rats (Charles River Laboratories) fed a LF (blue line) or HF (red line) diet. Rats were fed a LF or HF diet between 4 and 13 weeks of age. See Table 2 for experimental detail. At 13 weeks of age, rats were placed in a computer-controlled Oxymax instrument (an open circuit calorimeter; Columbus Instruments, OH) to measure 24-h O2 consumption, CO2 production, RQ and heat production (34). Values are mean ± SEM during the day (24 h) at the end of the study. There were 16 rats per diet group. Results were analyzed using a mixed effect model that fits both fixed and random effects (35, 36). The sign “*” denotes a significant effect of diet at the indicated time point. The sign “#” denotes no significant effect of diet at the indicated time point. RQ: P (diet); P (diet x time); P (time); P (time x time) and P (time x time x time) are all less than 0.001. VO2: P (diet) = 0.75; P (diet x time) = 0.12; P (time); P (time x time) and P (time x time x time) are all less than 0.001. VCO2: P (diet); P (diet x time); P (time); P (time x time) and P (time x time x time) are all less than 0.001. HP: P (diet) = 0.138; P (diet x time) = 0.018; P (time); P (time x time) and P (time x time x time) are all less than 0.001.
Table 5.
Energy expenditure per kg body weight in male Sprague-Dawley rats (Charles River Laboratories) fed a low-fat or high-fat diet between 4 and 13 weeks of age1,2
| Diet | VO2 (L/kg body weight/h) | VCO2 (L/kg body weight/h) | RQ (VCO2/VO2) | Heat production (Kcal/kg body weight/h) |
|---|---|---|---|---|
| Low Fat | 1.42 ± 0.013 | 1.30 ± 0.015a | 0.91 ± 0.004a | 6.91 ± 0.065a |
| High Fat | 1.41 ± 0.012 | 1.15 ± 0.011b | 0.82 ± 0.002b | 6.69 ± 0.058b |
See Table 2 for experimental detail. At 13 weeks of age, rats were placed in a computer-controlled Oxymax instrument (an open circuit calorimeter; Columbus Instruments, OH) to measure 24-h O2 consumption and CO2 production (34). Heat production is calculated according to the Brouwer equation (61): HP (Kcal) = 3.82 × VO2 (in L) + 1.15 × VCO2 (in L).
Values are means ± SEM, n = 16 rats/diet group. Energy metabolism data are expressed per kg body weight. In a 4-chamber calorimetry system, a 2-min measurement of O2 consumption and CO2 production is made for each rat at 8-min intervals for 24 h. The mean within each hour of the measurement is then computed, leading to 24 observations per rat for a day. Rat is the experimental unit in the statistical analysis.
Means in a column without a common letter differ (P < 0.01), as analyzed by the unpaired t-test.
Table 6.
Energy expenditure per kg non-fat mass in male Sprague-Dawley rats (Charles River Laboratories) fed a low-fat or high-fat diet between 4 and 13 weeks of age1,2
| Diet | VO2 (L/kg non-fat mass/h) | VCO2 (L/kg non-fat mass/h) | RQ (VCO2/VO2) | Heat production (Kcal/kg non-fat mass/h) |
|---|---|---|---|---|
| Low Fat | 1.68 ± 0.020 | 1.53 ± 0.023a | 0.91 ± 0.004a | 8.16 ± 0.097 |
| High Fat | 1.73 ± 0.018 | 1.41 ± 0.011b | 0.82 ± 0.002b | 8.20 ± 0.072 |
See Tables 2 and 5 for experimental detail. At 13 weeks of age, rats were placed in a computer-controlled Oxymax instrument (an open circuit calorimeter; Columbus Instruments, OH) to measure 24-h O2 consumption and CO2 production (34). Heat production is calculated according to the Brouwer equation (61): HP (Kcal) = 3.82 × VO2 (in L) + 1.15 × VCO2 (in L).
Values are means ± SEM, n = 16 rats/diet group. Energy metabolism data are expressed per kg non-fat mass. Rat is the experimental unit in the statistical analysis.
Means in a column without a common letter differ (P < 0.01), as analyzed by the unpaired t-test.
4.5. Expression of data on energy metabolism in normal-weight and obese rats
Relationships between metabolic rate and body weight differ between small and large mammals (60). Additionally, the metabolic rate of an animal is not linearly proportional to its body weight (60). This complex picture is further complicated by the fact that different tissues have different rates of metabolism, heat production, or O2 consumption per kg tissue (e.g., brown adipose tissue > heart > kidney > liver > small intestine > skeletal muscle > white adipose tissue) (63–75). For comparison, values for O2 consumption and heat production in tissues of resting overnight-fasted rats are shown in Table 7. Interestingly, the brain, liver, heart, kidneys and small intestine account for 7.6% of the body weight but 51.4% of whole-body O2 consumption (Table 7). Although the rate of O2 consumption or energy expenditure per kg tissue mass in resting skeletal muscle is much lower than that for internal organs, the skeletal muscle contributes to 20.7% of the whole-body O2 consumption or heat production due to its large mass. In contrast, white adipose tissue accounts for 12.4% of the body weight but only 1% of the whole-body O2 consumption or heat production due to its low metabolic rate (76–78). Thus, there is considerable debate over the last century about an appropriate way to express data on O2 consumption, CO2 production, and energy expenditure by humans and other animals (59). Because the weights of internal organs (other than white adipose tissues) and skeletal muscle are relatively constant per kg body weight but the weights of white adipose tissue are substantially increased in obese rats compared with lean rats (12), expression of whole-body O2 consumption or heat production data per kg body weight or metabolic weight (the body weight raised to the power of 0.75) may lead to an underestimation of metabolic activities (including energy expenditure) in the fat-free tissues or lean body mass of obese animals. Therefore, the simple division of metabolism variables by body weight or metabolic weight does not provide accurate information to compare true metabolic rates between normal-weight and obese animals. A solution to overcoming this problem is to determine body composition, including the weights of white adipose tissue, brown adipose tissue, and other major O2-consuming tissues in each animal. Then, data on rates of energy metabolism in rats fed the LF or HF diet can be more accurately expressed per kg non-fat mass (Table 6), as noted previouly. If the weights of non-white fat tissues (e.g., skeletal muscle, liver, heart, kidneys, small intestine, and brown adipose tissue) do not differ between LF- and HF-fed rats, data on energy metabolism (i.e., rates of O2 consumption, CO2 production, and heat production) can be expressed per animal to indicate its metabolic activity. However, this does not apply to HF-fed rats, as the non-fat masses of some tissues (e.g., skeletal muscle, heart, liver, and kidneys) are increased, as compared to the LF-fed group (Table 4).
Table 7.
Rates of resting oxygen consumption by major tissues of fasted adult rats1
| Whole-body or specific tissue | Body weight or tissue weight in a 300-g adult rat (g)2 | O2 consumption | Heat production | ||||
|---|---|---|---|---|---|---|---|
| Rate (ml/100 g/min)1 | Total O2 consumption (ml/300 g rat/min) | % of whole body O2 consumption | Rate (Kcal/100 g/h)3 | Total heat production (Kcal/300 g rat/h) | % of whole body heat production | ||
| 2.0 | 6.0 | --- | 0.576 | 1.73 | --- | ||
| BAT | 0.61 | 48 | 0.293 | 4.9 | 13.8 | 0.084 | 4.9 |
| Heart | 1.53 | 19.4 | 0.297 | 5.0 | 5.59 | 0.086 | 5.0 |
| Kidneys | 2.63 | 19.1 | 0.502 | 8.3 | 5.50 | 0.145 | 8.4 |
| Liver | 10.8 | 15.9 | 1.72 | 28.7 | 4.58 | 0.495 | 28.6 |
| Brain | 1.61 | 10.3 | 0.166 | 2.8 | 2.97 | 0.048 | 2.8 |
| Small intestine | 6.10 | 6.4 | 0.390 | 6.5 | 1.84 | 0.112 | 6.5 |
| Spleen | 0.77 | 2.2 | 0.017 | 0.28 | 0.63 | 0.0049 | 0.28 |
| Testes | 3.58 | 1.7 | 0.061 | 1.0 | 0.49 | 0.018 | 1.0 |
| Lungs | 1.63 | 1.0 | 0.016 | 0.27 | 0.29 | 0.0047 | 0.27 |
| Skeletal muscle | 135 | 0.92 | 1.24 | 20.7 | 0.27 | 0.358 | 20.7 |
| WAT | 33.9 | 0.18 | 0.061 | 1.01 | 0.052 | 0.018 | 1.01 |
The mean body weight of male Sprague-Dawley rats was 300 g (275 – 325 g). Rats were fasted for 16 h before rates of oxygen consumption by the whole body, kidneys, liver and small intestine were made (66). Perfused hindlimb and cardiac preparations were used to determine O2 consumption by resting skeletal muscle (71) and working hearts respectively (72). Rates of O2 consumption by rat brain (73) and brown adipose tissue (75) are taken from the literature. Rates of O2 consumption by rat lungs, spleen and testes are taken from the literature (74). The rate of O2 consumption by white adipose tissue is estimated at 20% of that for resting skeletal muscle (59). The rate of O2 consumption by the rat is expressed as ml/100 g body weight/min. The rates of O2 consumption by tissues are expressed as ml/100 g wet tissue weight/min.
Male Sprague-Dawley rats (Charles River Laboratories) were fed a low-fat diet (12) between 4 and 8 weeks of age. Tissues were obtained from 8-week-old rats after they were fasted for 16 h. The mean body-weights of rats were 308 and 301 g before and after a 16-h fast, respectively. BAT, brown adipose tissue; WAT, white adipose tissue.
Heat production was calculated as 4.8 cal (or 20.1 J) heat generated per 1 ml O2 consumed by the body or tissue (60). The rate of heat production by the rat is expressed as ml/100 g body weight/h. The rates of heat production by tissues are expressed as ml/100 g wet tissue weight/h.
5. LYSIS OF RQ VALUES
5.1. Analysis of VO2, VCO2 and RQ values
As noted previously, RQ values can reveal information on the nature of oxidation of energy substrates in whole animals (Table 8). Due to the different composition of C, O, and H in glucose, fatty acid, and protein, the complete oxidation of each of these nutrients gives a characteristic RQ. Catabolic and anabolic pathways for the metabolism of carbohydrate, fat, and protein yield very different RQ values. For example, RQ is 1.00 and 0.70 for the oxidation of glucose and fatty acids, respectively. In addition, RQ values between 0.80 and 0.85 implicate oxidation of fatty acids, glucose and amino acids to CO2 and water. Furthermore, RQ values between 0.67 and 0.70 suggest that animals mobilize fat store, providing fatty acids for oxidation and glycerol for gluconeogenesis. In animals, complete oxidation of glucose, fatty acids and amino acids to CO2 and water occur simultaneously in a cell- and tissue-specific manner. For example, the rat small intestine uses arterial blood glutamine as the major fuel in the fasting state but dietary amino acids (glutamine, glutamate and aspartate) plus some diet-derived glucose plus arterial blood glutamine in the fed state (61). In contrast, the rat skeletal muscle utilizes fatty acids and glucose as major metabolic fuels in the fed state but primarily fatty acids and ketone bodies in the fasting state (79). Therefore, RQ values for tissues are affected by dietary composition and physiological states. In support of this view, the large p-values associated with diet and diets x time interaction in Figure 1 indicate that rats fed the LF and HF groups have very similar patterns of O2 consumption. However, this is not true for rates of CO2 production, as rats fed the LF diet have a larger amount of CO2 production (P < 0.001) than the HF group, which is likely due to the oxidation of carbohydrates (a major component of the LF diet), resulting in greater production of CO2 in the LF group than the oxidation of fat (the major source of dietary energy) in the HF group.
Table 8.
Respiratory quotients (RQ) for complete oxidation of energy substrates to CO2 and H2O in humans and other animals
| Oxidation to CO2 and H2O | RQ value | Synthetic pathways | RQ value |
|---|---|---|---|
| Glucose | 1.00 | Glucose to fatty acid3 | 8.00 |
| Glycerol | 0.857 | Glucose to fat2 | 2.05 |
| Protein1 | 0.831 | Protein to fat2 | 1.26 |
| Fat2 | 0.708 | Protein to fatty acid3 | 1.22 |
| Fatty acid3 | 0.696 | Glycerol to glucose | 0.667 |
| Ethanol | 0.667 | Protein to glucose | 0.333 |
Oxidation of protein (C4.3H7O1.4N1.2) in animals is calculated as follows: Oxidation of 1.2 mole of N to 0.6 mole of urea (CH4ON2), C4.3H7O1.4N1.2 (protein) - C0.6H2.4O0.6N1.2 (0.6 mole of urea) = C3.7H4.6O0.8, C3.7H4.6O0.8 + 4.45 O2 = 3.7 CO2 + 2.3 H2O, RQ = 3.7/4.45 = 0.831,
Tripalmitoylglycerol (C51O6H98),
Palmitate
5.2. Diurnal changes in VO2, VCO2 and RQ
Rats eat during the night (dark hours) and food consumption results in increased oxidation of various amounts of macronutrients to CO2 and H2O (77). Thus, rats exhibit diurnal changes in RQ (Figure 1), as reported for genetically diabetic obese rats (78, 79) and in streptozotocin-induced diabetic rats (82). For example, the RQ values for LF and HF groups of rats decrease after 6:00 am and reach a minimum at 7:00 pm (Figure 1). This is related to their feeding time, which is between 7:00 pm and 6:00 am. Immediately after feeding (i.e., after 7:00 pm), the RQ values for the HF and LF diet groups increase and reach the nearly constant peak values of 0.85 and 0.98, respectively, over the period between 11:00 pm and 6:00 am (next day), reflecting the use of different energy substrates for oxidation in each group during the day. As noted previously, the oxidation of fat and carbohydrate in rats yields RQ values of 0.70 and 1.00, respectively. Therefore, a RQ value of 0.85 in the HF group may reflect the oxidation of a mixture of energy substrates (primarily fat and glucose) in the animals. Thus, RQ values for the LF group are higher (P < 0.001) than for the HF group between 8:00 pm – 3:00 pm (next day), while these values are very similar between 4:00 pm and 7:00 pm when little food is consumed. Overall, the RQ trajectories of both diet groups are drastically different over a 24 h period (P (diet x time) < 0.001) (Figure 1) due to the use of different metabolic fuels. Thus, RQ values of rats in different treatment groups should be made at the same time to avoid differences brought about by diurnal changes in energy metabolism.
6. ANALYSIS OF ENERGY EXPENDITURE IN ASSOCIATION WITH BODY WEIGHT
6.1. Summarizing the data using FPCA
FPCA is a data reduction technique (83). For convenience, an example is illustrated in Figure 2 for energy metabolism data expressed per kg body weight. The same statistical method also applies to data expressed per kg non-fat mass. Specifically, we used FPCA to summarize the 24 observations per rat in the LF group (Figure 3) and HF group (Figure 4) using a limited number of measurements (one or two for each rat), called principal component (PC) scores, without losing useful information. Each PC accounts for a different mode of variation in the original trajectories: simply taking the mean over the 24-h period results in the potential loss of valuable information, as it only accounts for one specific mode of variation, which is not generally sufficient. The first two PC scores (per rat) for each of the four variables are shown in Figure 2. These plots provide a useful graphical tool to identify which rats had similar responses during the day. Rats fed the LF and HF diets had distinct distributions of RQ values based on FPCA analysis (Figure 2). For instance, rats #4 and #11 in the low-fat group had very similar responses (see plot A in Figure 2), and this is confirmed in Figure 3 as rats #4 and #11 also had very similar RQ trajectories. The same was true for rats #3 and #13. In general, if two rats have similar values as illustrated in Figure 2, they are expected to have similar response trajectories over the day in Figure 3. The percentages shown on each axis in Figure 2 are used to assess the amount of information lost by shifting from 24 observations per rat to two PC measurements per rat. The closer the sum (of the % on the x and y axis) is to 100%, the less information is lost in the reduction process. A sum above 85% is deemed satisfactory. Thus, we can summarize the trajectories of 24 observations per rat in a very efficient way using only two measurements. Those two PC scores provide very useful information in predicting body weight of rats (Figure 5) as described in the next section. All of the statistical conclusions in the previous section are confirmed graphically in Figure 2. For instance, the clear separation in plot A and to a lesser extent in plot D among rats belonging to the different diet groups further indicates that the effect of diet on RQ and VCO2 is highly significant (P < 0.001).
Figure 2.

Plots of the first two principal-component scores for rat energy metabolism. Male Sprague-Dawley rats (Charles River Laboratories) were fed a LF (blue circle) or HF (red circle) diet between 4 and 13 weeks of age. There were 16 rats per diet group. See Table 2 for experimental detail. At 13 weeks of age, rats were placed in a computer-controlled Oxymax instrument (an open circuit calorimeter; Columbus Instruments, OH) to measure 24-h O2 consumption, CO2 production, RQ, and heat production (34). The 24 hourly observations for each measured variable were reduced into two dimensions (two principal-component scores): “dimension 1” and “dimension 2”. The principal-component analysis is considered as a data reduction technique. (A) RQ scores; (B) HP scores; (C) VO2 scores; and (D) VCO2 scores.
Figure 3.

Respiratory quotients (RQ) for 13-week-old male Sprague-Dawley rats (Charles River Laboratories) fed a low-fat (LF) diet (blue line) between 4 and 13 weeks of age. There were 16 rats in the LF group, with the animal identification number (#1 to #16) being shown at the top of each subplot. The experiment also involved 16 male Sprague-Dawley rats (Charles River Laboratories) fed a high-fat (HF) diet between 4 and 13 weeks of age. See Table 2 for experimental detail. At 13 weeks of age, rats were placed in a computer-controlled Oxymax instrument (an open circuit calorimeter; Columbus Instruments, OH) to measure 24-h O2 consumption, CO2 production, and RQ (34). The overall average trajectory (magenta line) for RQ values of the 32 rats (16 in the LF group and 16 in the HF group) at each time point is shown in each subplot. This aids in identifying which rats in the LF group had RQ values above or below the average and, therefore in interpreting data on the principal scores. The x-axis represents time during 24 h of the day, where time point “0” = 12 AM and time point “23” = 11 PM.
Figure 4.

Respiratory quotients (RQ) for 13-week-old male Sprague-Dawley rats (Charles River Laboratories) fed a high-fat (HF) diet (blue line) between 4 and 13 weeks of age. There were 16 rats in the HF group, with the animal identification number (#17 to #32) being shown at the top of each subplot. The experiment also involved 16 male Sprague-Dawley rats (Charles River Laboratories) fed a low-fat (LF) diet between 4 and 13 weeks of age. See Table 2 for experimental detail. At 13 weeks of age, rats were placed in a computer-controlled Oxymax instrument (an open circuit calorimeter; Columbus Instruments, OH) to measure 24-h O2 consumption, CO2 production, and RQ (34). The overall average trajectory (magenta line) for RQ values of the 32 rats (16 in the LF group and 16 in the HF group) at each time point is shown in each subplot. This aids in identifying which rats in the HF group had RQ values above or below the average and, therefore in interpreting data on the principal scores. The x-axis represents time during 24 h of the day, where time point “0” = 12 AM and time point “23” = 11 PM.
Figure 5.

Plot of predicted BW response (x-axis) versus observed BW values (y-axis). See Table 2 for experimental detail. Male Sprague-Dawley rats (Charles River Laboratories) were fed a LF (blue circle) or HF (red circle) diet between 4 and 13 week of age. Body weights of rats were measured weekly. The line y = x (in green) is added to assess the adequacy of the model’s fit.
6.2. Regression analysis to predict weight gain in adult rats based on RQ and heat production
Some of the LF-fed rats became obese, whereas some of the HF-fed rats were resistant to the development of obesity (Table 4). This is due to individual genetic differences among animals, which influence energy metabolism and, therefore, body weight gain. Because a close relationship between RQ and heat production, RQ values are very useful to predict energy intake and changes in the body mass of diet-induced obese animals (84). Here, we use linear regression analysis to develop a model to predict weight gain in adult rats based on RQ and heat production. Results are summarized in Table 9.
Table 9.
Results of regression analysis of energy expenditure in rats fed a low-fat or high-fat diet between 4 and 13 weeks of age
| Effect | SEM | p-value | |
|---|---|---|---|
| IWG | 6.64 | 1.26 | <0.0001 |
| Diet | 115.58 | 33.33 | 0.001 |
| HPs | −9.02 | 3.27 | 0.01 |
| RQs | 221.48 | 60.13 | 0.001 |
See Table 2 for experimental detail. Male Sprague-Dawley rats (Charles River Laboratories) were fed a LF or HF diet between 4 and 13 week of age. At 13 weeks of age, rats were placed in a computer-controlled Oxymax instrument (an open circuit calorimeter; Columbus Instruments, OH) to measure 24-h O2 consumption, CO2 production and heat production (34). IWG: initial body-weight gain during the first week; RQS and HPS are the 1st PC scores of RQ and HP, respectively.
Here, BW denotes the body weight at the end of study in grams (g), and Diet equals 1 if the rat belongs to the HF group or equals 0 if the rat is in the LF group. RQS and HPS are the first PC scores for RQ and HP (Figures 6 and 7), respectively (the values on the x-axis in Figure 2B and 2D), and IWG (g) is initial body weight gain during the first week of the study. The adjusted R2 for the above model is 0.70. Figure 5 shows a scatter plot of the predicted values of BW using the above model versus the actual observed BW values. The points lie well on the green line. This further supports the adequacy of our regression model.
Figure 6.

Rates of heat production (HP) in 13-week-old male Sprague-Dawley rats (Charles River Laboratories) fed a high-fat (LF) diet (blue line) between 4 and 13 weeks of age. There were 16 rats in the LF group, with the animal identification number (#1 to # 16) being shown at the top of each subplot. The experiment also involved 16 male Sprague-Dawley rats (Charles River Laboratories) fed a high-fat (HF) diet between 4 and 13 weeks of age. See Table 2 for experimental detail. At 13 weeks of age, rats were placed in a computer-controlled Oxymax instrument (an open circuit calorimeter; Columbus Instruments, OH) to measure 24-h O2 consumption, CO2 production, and HP (34). HP is calculated according to the Brouwer equation (61): HP (Kcal) = 3.82 × VO2 (in L) + 1.15 × VCO2 (in L). The overall average trajectory (magenta line) for HP of the 32 rats (16 in the LF group and 16 in the HF group) at each time point is shown in each subplot. This aids in identifying which rats in the LF group had HP values above or below the average and, therefore in interpreting data on the principal scores. The x-axis represents time during 24 h of the day, where time point “0” = 12 AM and time point “23” = 11 PM.
Figure 7.

Rates of heat production (HP) in 13-week-old male Sprague-Dawley rats (Charles River Laboratories) fed a high-fat (HF) diet (blue line) between 4 and 13 weeks of age. There were 16 rats in the HF group, with the animal identification number (#17 to # 32) being shown at the top of each subplot. The experiment also involved 16 male Sprague-Dawley rats (Charles River Laboratories) fed a low-fat (LF) diet between 4 and 13 weeks of age. See Table 2 for experimental detail. At 13 weeks of age, rats were placed in a computer-controlled Oxymax instrument (an open circuit calorimeter; Columbus Instruments, OH) to measure 24-h O2 consumption, CO2 production, and HP (34). HP is calculated according to the Brouwer equation (61): HP (Kcal) = 3.82 × VO2 (in L) + 1.15 × VCO2 (in L). The overall average trajectory (magenta line) for HP of the 32 rats (16 in the LF group and 16 in the HF group) at each time point is shown in each subplot. This aids in identifying which rats in the HF group had HP values above or below the average and, therefore in interpreting data on the principal scores. The x-axis represents time during 24 h of the day, where time point “0” = 12 AM and time point “23” = 11 PM.
At the end of the 9-week experimental period, the mean body weight of HF-fed rats is greater (P < 0.01) than that of LF-fed rats. Typically, a high 1st PC score indicates above-average activity over the 24 h period. For instance, rats #25 and #29 in the HF group shown in red in Figure 2(B) have the highest scores on the 1st PC (the x-axis), indicating that their heat production levels were well above average for all the 32 rats in the HF plus LF groups (see Figure 7). These rats would be expected to have lower body weights according to the regression equation shown above and this is confirmed as their actual weights were 432.4 and 456.3 g, respectively. On the other hand, rats #24, #28, and #30 in the HF diet group had low HPS scores (below-average HP levels) and, not surprisingly, high body weights (583.1, 571.0 and 625.7 g, respectively). The same results were obtained when evaluating rats in the LF diet group. We initially included additional PC scores as potential covariates (together with the VCO2 and VO2 PC scores) in the regression model; however, none of them were statistically significant (P > 0.05). Thus, an appropriate statistical method should be used to analyze data collected over an extended period of study.
6.3. Cluster analysis
Obesity in humans is generally defined as a body mass index [BMI = body weight/(height)2] ≥ 30.0 kg/m2 (85). BMI is used because it is positively correlated with the amount of body white fat in most people. Currently, there are no standard criteria on defining overweight or obesity in laboratory animals (e.g., rats and mice), companion animals, and other species (86, 87). Cluster analysis is a statistical tool designed for classification and data reduction purposes. This methods allows large data to be classified into subgroups based on their similar characteristics without prior knowledge of their group membership (88). A procedure such as the k-nearest neighbor procedure is a useful exploratory tool for classifying relatively large data into subgroups when there is some prior knowledge of the potential number of subgroups within the given data set. For example, in classifying animals to either a normal-weight group or obese group based on their phenotypic characteristics (e.g., body weight). In this instance, researchers rely on the hypothesis or prior knowledge that the animals belong into two potential body weight groups, namely, the normal-weight group and the obese group. The k-means procedure works by partitioning a data set consisting of n observations into k-clusters, where each observation within each cluster is classified based on its distance to the mean of the nearest cluster, while minimizing the variation between observations within each cluster. Therefore, observations classified into the same cluster are deemed to be more similar when compared to observations across clusters. Thus, we decided to use a cluster analysis method called the K-nearest neighbor clustering approach (88) to define obesity in rats.
As shown in Figure 8, the male Sprague-Dawley rats in our studies do not belong in one homogeneous cluster but appear to belong into more than one subgroup or cluster based on their initial body weight within the first week of the HF feeding and their body weight at week 13. We can proceed to classify the rats weighing ≤ 470 and ≥ 470 g at 13 weeks of age as lean and obese animals, respectively. Among the 32 rats, 12 of them (7 in the LF group and 5 in the HF group) are classified as normal-weight, while 20 of them (9 in the LF group and 11 in the HF group) are classified as obese. The mean body weight in the obese group is 23% greater than that in the normal-weight group (536 vs 436 g). The weights of these four groups of rats between 4 and 13 weeks of age are shown in Figure 9. It would be important to identify genes that promote or inhibit the development of obesity in the animals. This goal can be achieved using the microarray analysis (13, 14) and appropriate statistical methods (89, 90).
Figure 8.
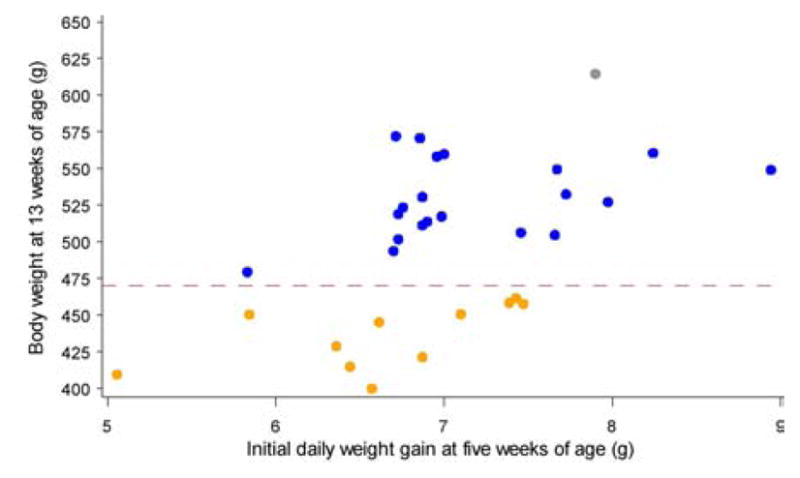
Cluster analysis of body weights for 13-week-old male Sprague-Dawley rats (Charles River Laboratories) fed a low-fat (LF) or high-fat (HF) diet between 4 and 13 weeks of age. See Table 2 for experimental detail. Some rats in the LF group were obese, and some rats in the HF were resistant to the development of obesity. Two clusters of animals are clearly found in the plot based on the initial weight gain during the first week of HF feeding and the body weight at week 13. The rats weighing ≤ 470 and ≥ 470 g at 13 weeks of age are classified as normal-weight (yellow circle) and obese (blue circle), respectively. The mean body-weight in the obese group is 23% greater than that in the normal-weight group (536 vs 436 g).
Figure 9.
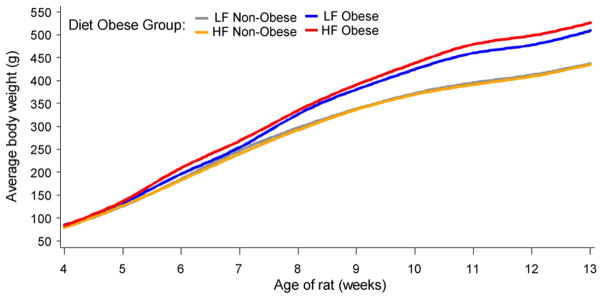
Body weights of male Sprague-Dawley rats (Charles River Laboratories) fed a low-fat (LF) or high-fat (HF) diet between 4 and 13 of age. See Table 2 for experimental detail. Based on the cluster analysis, 16 rats in each diet group were subdivided into either normal-weight or obese. Among the 32 rats, 12 of them (7 in the LF group and 5 in the HF group) are classified as normal-weight, while 20 of them (9 in the LF group and 11 in the HF group) are classified as obese. Values of the body weights are the means for each subgroup of rats at an indicated age, with the SEM being < 2.2% of the means.
In general, classification tools such as the k-nearest neighbor approach can be useful for exploring whether or not animals can be classified into more than weight subgroups such as obese and lean based on their body weights. However, there is potential for loss of information when the animals are classified into categories prior to conducting any statistical analysis. For example, as the sample size (n) of the data set increases, there is potential for the clusters not to be clearly defined in the classification process, leading to potential for both misclassification problems and the potential for loss of information by categorizing the data into subgroups prior to conducting the statistical analysis. The use of the body weight at the end of the study as a continuous outcome in the statistical modeling of obesity, rather than obesity as a categorical outcome, might allow for less loss of information in predicting weight gain or obesity in animal models.
7. SUMMARY AND PERSPECTIVES
Results of whole-body calorimetry indicate that overfeeding results in an increase, but underfeeding causes a decrease, in energy expenditure in both lean and obese subjects (78). Although animals can adapt to short-term changes in dietary intake of energy by altering rates of energy metabolism, chronic consumption of high-fat or high-energy diets ultimately leads to obesity in individuals. Obesity is defined as an accumulation of excessive amounts of white adipose tissue in the body. Available evidence shows that rats fed a LF or HF diet exhibit diurnal changes in RQ values and whole-body heat production over a 24 h period, likely due to differential expression of key biological-clock genes that regulate energy metabolism (91). One of these genes is peroxisome proliferator-activated receptor gamma coactivator 1-alpha (PGC-1α), which is rhythmically expressed in the liver and skeletal muscle of mice (91, 92). Additionally, an increase in PGC-1α expression is associated with a reduction of adiposity in Zucker diabetic fatty rats in response to dietary supplementation with arginine (14). PGC-1α activates expression of the retinoid-related orphan receptor family, thereby enhancing expression of clock genes, Bmal1 and Rev-erbalpha, to stimulate the oxidation of energy substrates to CO2 and H2O in mammals (91). In view of growing interest in amino-acid nutrition research (93–95), the diet-induced obese rat provides a useful model with which to develop protein- or amino acid-based means to enhance energy expenditure in the hopes of preventing or treating obesity in humans and other animals (96–105). For analyses of the complex data on metabolism (including energy expenditure), a regression model can be constructed to accurately predict weight gain in adult rats based on diet, initial body weight gain, the principal component scores of RQ and heat production. Additionally, cluster analysis can be employed to classify animals as either normal-weight or obese based on initial weight gain and final body weight. Finally, the time-course data on O2 consumption, CO2 production, RQ, and heat production can be statistically analyzed using a mixed effect model that fits both fixed and random effects. The body weights of HF-fed rats are greater than those for LF-fed rats. However, the rates of whole-body heat production per kg non-fat mass do not differ between these two groups of animals. Therefore, we conclude that metabolic conversion of dietary lipids into body fat primarily contributes to obesity in HF-fed animals. Interestingly, like humans (106, 107), outbred rats have divergent genetic backgrounds depending on their sources and breeding locations (43–47). Thus, some rats (e.g., Sprague-Dawley strain) fed a HF diet are resistant to the development of obesity, while some rats fed the LF diet become obese. Further studies are warranted to elucidate the underlying genetic and cellular mechanisms responsible for the development of obesity in mammals.
Acknowledgments
We thank the American Heart Association (grant No. 10GRNT4480020 and No. 11GRNT7930004) and the National Institutes of Health (grant No. R21 HL094689) for the support of this work. Dr. H. Assaad and Dr. R.J. Carroll were supported by a postdoctoral training grant (R25T-CA090301) and a research grant (R37-CA057030) from the National Cancer Institute, respectively.
Abbreviations
- BMI
body mass index
- BW
body weight
- FPCA
functional principal component analysis
- HF
high-fat
- HP
at production
- s
the first principal component score for heat production
- LF
low-fat
- PGC-1α
eroxisome proliferator-activated receptor gamma coactivator 1-alpha; principal component
- RQ
respiratory quotient
- RQs
the first principal component score for respiratory quotient
- VCO2
the volume of CO2 production
- VO2
the volume of oxygen consumption
- IWG
initial body-weight gain during the first week of the study
References
- 1.Speakman JR. Evolutionary perspectives on the obesity epidemic: adaptive, maladaptive, and neutral viewpoints. Annu Rev Nutr. 2013;33:289–317. doi: 10.1146/annurev-nutr-071811-150711. [DOI] [PubMed] [Google Scholar]
- 2.Hill JO, Peters JC. Environmental contributions to the obesity epidemic. Science. 1998;280:1371–1374. doi: 10.1126/science.280.5368.1371. [DOI] [PubMed] [Google Scholar]
- 3.McKnight JR, Satterfield MC, Li XL, Gao HJ, Wang JJ, Li DF, Wu G. Obesity in pregnancy: problems and potential solutions. Front Biosci. 2011;E3:442–452. doi: 10.2741/e259. [DOI] [PubMed] [Google Scholar]
- 4.Aballay LR, Eynard AR, del Díaz MP, Navarro A, Muñoz SE. Overweight and obesity: a review of their relationship to metabolic syndrome, cardiovascular disease, and cancer in South America. Nutr Rev. 2013;71:168–79. doi: 10.1111/j.1753-4887.2012.00533.x. [DOI] [PubMed] [Google Scholar]
- 5.Vucenik I, Stains JP. Obesity and cancer risk: evidence, mechanisms, and recommendations. Ann N Y Acad Sci. 2012;1271:37–43. doi: 10.1111/j.1749-6632.2012.06750.x. [DOI] [PMC free article] [PubMed] [Google Scholar]
- 6.Jobgen W, Meininger CJ, Jobgen SC, Li P, Lee MJ, Smith SB, Spencer TE, Fried SK, Wu G. Dietary L-arginine supplementation reduces white fat gain and enhances skeletal muscle and brown fat masses in diet-induced obese rats. J Nutr. 2009;139:230–237. doi: 10.3945/jn.108.096362. [DOI] [PMC free article] [PubMed] [Google Scholar]
- 7.Clemmensen C, Madsen AN, Smajilovic S, Holst B, Brauner-Osborne H. L-Arginine improves multiple physiological parameters in mice exposed to diet-induced metabolic disturbances. Amino Acids. 2012;43:1265–1275. doi: 10.1007/s00726-011-1199-1. [DOI] [PubMed] [Google Scholar]
- 8.Bujnowski D, Xun P, Daviglus ML, Van Horn L, He K, Stamler J. Longitudinal association between animal and vegetable protein intake and obesity among men in the United States: the Chicago Western Electric Study. J Am Diet Assoc. 2011;111:1150–1155. doi: 10.1016/j.jada.2011.05.002. [DOI] [PMC free article] [PubMed] [Google Scholar]
- 9.Murtaugh MA, Herrick JS, Sweeney C, Baumgartner KB, Guiliano AR, Byers T, Slattery ML. Diet composition and risk of overweight and obesity in women living in the southwestern United States. J Am Diet Assoc. 2007;107:1311–1321. doi: 10.1016/j.jada.2007.05.008. [DOI] [PubMed] [Google Scholar]
- 10.Lin Y, Bolca S, Vandevijvere S, De Vriese S, Mouratidou T, De Neve M, Polet A, Van Oyen H, Van Camp J, De Backer G, De Henauw S, Huybrechts I. Plant and animal protein intake and its association with overweight and obesity among the Belgian population. Br J Nutr. 2011;105:1106–1116. doi: 10.1017/S0007114510004642. [DOI] [PubMed] [Google Scholar]
- 11.Nall JL, Wu G, Kim KH, Choi CW, Smith SB. Dietary supplementation of L-arginine and conjugated linoleic acid reduces retroperitoneal fat mass and increases lean body mass in rats. J Nutr. 2009;139:1279–1285. doi: 10.3945/jn.108.102301. [DOI] [PubMed] [Google Scholar]
- 12.Jobgen WJ, Meininger CJ, Jobgen SC, Li P, Lee MJ, Smith SB, Spencer TE, Fried SK, Wu G. Dietary L-arginine supplementation reduces white-fat gain and enhances skeletal muscle and brown fat masses in diet-induced obese rats. J Nutr. 2009;139:230–237. doi: 10.3945/jn.108.096362. [DOI] [PMC free article] [PubMed] [Google Scholar]
- 13.Jobgen W, Fu WJ, Gao H, Li P, Meininger CJ, Smith SB, Spencer TE, Wu G. High fat feeding and dietary L-arginine supplementation differentially regulate gene expression in rat white adipose tissue. Amino Acids. 2009;37:187–198. doi: 10.1007/s00726-009-0246-7. [DOI] [PubMed] [Google Scholar]
- 14.Fu WJ, Haynes TE, Kohli R, Hu J, Shi W, Spencer TE, Carroll RJ, Meininger CJ, Wu G. Dietary L-arginine supplementation reduces fat mass in Zucker diabetic fatty rats. J Nutr. 2005;135:714–721. doi: 10.1093/jn/135.4.714. [DOI] [PubMed] [Google Scholar]
- 15.Wu G, Collins JK, Perkins-Veazie P, Siddiq M, Dolan KD, Kelly KA, Heaps CL, Meininger CJ. Dietary supplementation with watermelon pomace juice enhances arginine availability and ameliorates the metabolic syndrome in Zucker diabetic fatty rats. J Nutr. 2007;137:2680–2685. doi: 10.1093/jn/137.12.2680. [DOI] [PubMed] [Google Scholar]
- 16.Bazer FW, Kim J, Song G, Ka H, Tekwe CD, Wu G. Select nutrients, progesterone, and interferon tau affect conceptus metabolism and development. Ann N Y Acad Sci. 2012;1271:88–96. doi: 10.1111/j.1749-6632.2012.06741.x. [DOI] [PMC free article] [PubMed] [Google Scholar]
- 17.Tan BE, Li XG, Kong XF, Huang RL, Ruan Z, Yao K, Deng ZY, Xie MY, Shinzato I, Yin YL, Wu G. Dietary L-arginine supplementation enhances the immune status in early-weaned piglets. Amino Acids. 2009;37:323–331. doi: 10.1007/s00726-008-0155-1. [DOI] [PubMed] [Google Scholar]
- 18.Tan BE, Yin YL, Liu ZQ, Tang WJ, Xu HJ, Kong XF, Li XG, Yao K, Gu WT, Smith SB, Wu G. Dietary L-arginine supplementation differentially regulates expression of lipid-metabolic genes in porcine adipose tissue and skeletal muscle. J Nutr Biochem. 2011;22:441–445. doi: 10.1016/j.jnutbio.2010.03.012. [DOI] [PubMed] [Google Scholar]
- 19.Lucotti P, Setola E, Monti LD, Galluccio E, Costa S, Sandoli EP, Fermo I, Rabaiotti G, Gatti R, Piatti P. Beneficial effects of a long-term oral L-arginine treatment added to a hypocaloric diet and exercise training program in obese, insulin-resistant type 2 diabetic patients. Am J Physiol Endocrinol Metab. 2006;291:E906–912. doi: 10.1152/ajpendo.00002.2006. [DOI] [PubMed] [Google Scholar]
- 20.McKnight JR, Satterfield MC, Jobgen WS, Smith SB, Spencer TE, Meininger CJ, McNeal CJ, Wu G. Beneficial effects of L-arginine on reducing obesity: Potential mechanisms and important implications for human health. Amino Acids. 2010;39:349–357. doi: 10.1007/s00726-010-0598-z. [DOI] [PubMed] [Google Scholar]
- 21.Tan BE, Li XG, Yin YL, Wu ZL, Liu C, Tekwe CD, Wu G. Regulatory roles for L-arginine in reducing white adipose tissue. Front Biosci. 2012;17:2237–2246. doi: 10.2741/4047. [DOI] [PMC free article] [PubMed] [Google Scholar]
- 22.Wu ZL, Satterfield MC, Bazer FW, Wu G. Regulation of brown adipose tissue development and white fat reduction by L-arginine. Curr Opin Clin Nutr Metab Care. 2012;15:529–538. doi: 10.1097/MCO.0b013e3283595cff. [DOI] [PubMed] [Google Scholar]
- 23.Dai ZL, Wu ZL, Yang Y, Wang JJ, Satterfield MC, Meininger CJ, Bazer FW, Wu G. Nitric oxide and energy metabolism in mammals. Biofactors. 2013;39:383–391. doi: 10.1002/biof.1099. [DOI] [PubMed] [Google Scholar]
- 24.Li XL, Rezaei R, Li P, Wu G. Composition of amino acids in feed ingredients for animal diets. Amino Acids. 2011;40:1159–1168. doi: 10.1007/s00726-010-0740-y. [DOI] [PubMed] [Google Scholar]
- 25.San Gabriel A, Uneyama H. Amino acid sensing in the gastrointestinal tract. Amino Acids. 2013;45:451–461. doi: 10.1007/s00726-012-1371-2. [DOI] [PubMed] [Google Scholar]
- 26.San Gabriel A, Nakamura E, Uneyama H, Torii K. Taste, visceral information and exocrine reflexes with glutamate through umami receptors. J Med Invest. 2009;56(Suppl):209–217. doi: 10.2152/jmi.56.209. [DOI] [PubMed] [Google Scholar]
- 27.Smriga M, Murakami H, Mori M, Torii K. Use of thermal photography to explore the age-dependent effect of monosodium glutamate, NaCl and glucose on brown adipose tissue thermogenesis. Physiol Behav. 2000;71:403–407. doi: 10.1016/s0031-9384(00)00350-4. [DOI] [PubMed] [Google Scholar]
- 28.Kondoh T, Torii K. MSG intake suppresses weight gain, fat deposition, and plasma leptin levels in male Sprague-Dawley rats. Physiol Behav. 2008;95:135–144. doi: 10.1016/j.physbeh.2008.05.010. [DOI] [PubMed] [Google Scholar]
- 29.Rezaei R, Knabe DA, Tekwe CD, Dahanayaka S, Ficken MD, Fielder SE, Eide SJ, Lovering SL, Wu G. Dietary supplementation with monosodium glutamate is safe and improves growth performance in postweaning pigs. Amino Acids. 2013;44:911–923. doi: 10.1007/s00726-012-1420-x. [DOI] [PubMed] [Google Scholar]
- 30.Heinritz SN, Mosenthin R, Weiss E. Use of pigs as a potential model for research into dietary modulation of the human gut microbiota. Nutr Res Rev. 2013;26:191–209. doi: 10.1017/S0954422413000152. [DOI] [PubMed] [Google Scholar]
- 31.Freudenberg A, Petzke KJ, Klaus S. Dietary L-leucine and L-alanine supplementation have similar acute effects in the prevention of high-fat diet-induced obesity. Amino Acids. 2013;44:519–528. doi: 10.1007/s00726-012-1363-2. [DOI] [PubMed] [Google Scholar]
- 32.Segal-Lieberman G, Rosenthal T. Animal models in obesity and hypertension. Curr Hypertens Rep. 2013;15:190–195. doi: 10.1007/s11906-013-0338-3. [DOI] [PubMed] [Google Scholar]
- 33.Satterfield MC, Dunlap KA, Keisler DH, Bazer FW, Wu G. Arginine nutrition and fetal brown adipose tissue development in diet-induced obese sheep. Amino Acids. 2012;43:1593–1603. doi: 10.1007/s00726-012-1235-9. [DOI] [PubMed] [Google Scholar]
- 34.Tekwe CD, Lei J, Yao K, Rezaei R, Li XL, Dahanayaka S, Carroll RJ, Meininger CJ, Bazer FW, Wu G. Oral administration of interferon tau enhances oxidation of energy substrates and reduces adiposity in Zucker diabetic fatty rats. Biofactors. 2013;39:552–563. doi: 10.1002/biof.1113. [DOI] [PMC free article] [PubMed] [Google Scholar]
- 35.Pinheiro J, Bates D, DebRoy S, Sarkar D the R Development Core Team. R package version 3.1–108. 2013. nlme Linear and Nonlinear Mixed Effects Models. [Google Scholar]
- 36.Pinheiro J, Bates D. Mixed effect models in S and S-Plus. New York: Springer-Verlag; 2000. [Google Scholar]
- 37.Ramsay JO, Wickham H, Graves S, Hooker G. fda Functional Data Analysis. R package version 2.3.2. 2012 http://CRAN.R-project.org/package=fda.
- 38.R Core Team. R A language and environment for statistical computing. R Foundation for Statistical Computing; Vienna, Austria: 2012. URL http://www.R-project.org/ [Google Scholar]
- 39.Blundell JE, Lawton CL, Cotton JR, Macdiarmid JI. Control of human appetite: implications for the intake of dietary fat. Annu Rev Nutr. 1996;16:285–319. doi: 10.1146/annurev.nu.16.070196.001441. [DOI] [PubMed] [Google Scholar]
- 40.Duca FA, Sakar Y, Covasa M. The modulatory role of high fat feeding on gastrointestinal signals in obesity. J Nutr Biochem. 2013;24:1663–1677. doi: 10.1016/j.jnutbio.2013.05.005. [DOI] [PubMed] [Google Scholar]
- 41.Gallo RV, Babu GN, Bona-Gallo A, Devorshak-Harvey E, Leipheimer RE, Marco J. Regulation of pulsatile luteinizing hormone release during the estrous cycle and pregnancy in the rat. Adv Exp Med Biol. 1987;219:109–130. doi: 10.1007/978-1-4684-5395-9_6. [DOI] [PubMed] [Google Scholar]
- 42.Guberman C, Jellyman JK, Han G, Ross MG, Desai M. Maternal high-fat diet programs rat offspring hypertension and activates the adipose renin-angiotensin system. Am J Obstet Gynecol. 2013;209:262.e1–8. doi: 10.1016/j.ajog.2013.05.023. [DOI] [PMC free article] [PubMed] [Google Scholar]
- 43.Solomon S. Developmental changes in nephron number, proximal tubular length and superficial nephron glomerular filtration rate of rats. J Physiol. 1977;272:573–589. doi: 10.1113/jphysiol.1977.sp012061. [DOI] [PMC free article] [PubMed] [Google Scholar]
- 44.Fuzik J, Gellért L, Oláh G, Herédi J, Kocsis K, Knapp L, Nagy D, Kincses ZT, Kis Z, Farkas T, Toldi J. Fundamental interstrain differences in cortical activity between Wistar and Sprague-Dawley rats during global ischemia. Neuroscience. 2013;228:371–381. doi: 10.1016/j.neuroscience.2012.10.042. [DOI] [PubMed] [Google Scholar]
- 45.Kobayashi K, Ogasawara R, Tsutaki A, Lee K, Ochi E, Nakazato K. Genetic strain-dependent protein metabolism and muscle hypertrophy under chronic isometric training in rat gastrocnemius muscle. Physiol Res. 2012;61:527–535. doi: 10.33549/physiolres.932312. [DOI] [PubMed] [Google Scholar]
- 46.Sakai N, Saito K, Sakamoto KQ, Ishizuka M, Fujita S. Genetic basis of inter- and intrastrain differences in diazepam p-hydroxylation in rats. Drug Metab Dispos. 2009;37:268–271. doi: 10.1124/dmd.108.024273. [DOI] [PubMed] [Google Scholar]
- 47.Berdanier CD, Thomson AR. Comparative studies on mitochondrial respiration in four strains of rats (Rattus norvegicus) Comp Biochem Physiol B. 1986;85:531–535. doi: 10.1016/0305-0491(86)90042-8. [DOI] [PubMed] [Google Scholar]
- 48.Pérez de Heredia F, Garaulet M, Portillo MP, Zamora S. Resistance to dietary obesity in rats given different high-energy diets. Int J Vitam Nutr Res. 2006;76:271–279. doi: 10.1024/0300-9831.76.5.271. [DOI] [PubMed] [Google Scholar]
- 49.Langer M, Brandt C, Löscher W. Marked strain and substrain differences in induction of status epilepticus and subsequent development of neurodegeneration, epilepsy, and behavioral alterations in rats. Epilepsy Res. 2011;96:207–224. doi: 10.1016/j.eplepsyres.2011.06.005. [DOI] [PubMed] [Google Scholar]
- 50.MacKenzie WF, Garner FM. Comparison of neoplasms in six sources of rats. J Natl Cancer Inst. 1973;50:1243–1257. doi: 10.1093/jnci/50.5.1243. [DOI] [PubMed] [Google Scholar]
- 51.Miller FP, Cox RH, Jr, Maickel RP. Intrastrain differences in serotonin and norepinephrine in discrete areas of rat brain. Science. 1968;162:463–464. doi: 10.1126/science.162.3852.463. [DOI] [PubMed] [Google Scholar]
- 52.Valenti VE, Imaizumi C, de Abreu LC, Colombari E, Sato MA, Ferreira C. Intra-strain variations of baroreflex sensitivity in young Wistar-Kyoto rats. Clin Invest Med. 2009;32:E251. doi: 10.25011/cim.v32i6.10660. [DOI] [PubMed] [Google Scholar]
- 53.Portelli J, Aourz N, De Bundel D, Meurs A, Smolders I, Michotte Y, Clinckers R. Intrastrain differences in seizure susceptibility, pharmacological response and basal neurochemistry of Wistar rats. Epilepsy Res. 2009;87:234–246. doi: 10.1016/j.eplepsyres.2009.09.009. [DOI] [PubMed] [Google Scholar]
- 54.Oliff HS, Coyle P, Weber E. Rat strain and vendor differences in collateral anastomoses. J Cereb Blood Flow Metab. 1997;17:571–576. doi: 10.1097/00004647-199705000-00012. [DOI] [PubMed] [Google Scholar]
- 55.Lauterio TJ, Bond JP, Ulman EA. Development and characterization of a purified diet to identify obesity-susceptible and resistant rat populations. J Nutr. 1994;124:2172–2178. doi: 10.1093/jn/124.11.2172. [DOI] [PubMed] [Google Scholar]
- 56.Farley C, Cook JA, Spar BD, Austin TM, Kowalski TJ. Meal pattern analysis of diet-induced obesity in susceptible and resistant rats. Obes Res. 2003;11:845–851. doi: 10.1038/oby.2003.116. [DOI] [PubMed] [Google Scholar]
- 57.Chang S, Graham B, Yakubu F, Lin D, Peters JC, Hill JO. Metabolic differences between obesity-prone and obesity-resistant rats. Am J Physiol. 1990;259:R1103–R1110. doi: 10.1152/ajpregu.1990.259.6.R1103. [DOI] [PubMed] [Google Scholar]
- 58.Arch JR, Hislop D, Wang SJ, Speakman JR. Some mathematical and technical issues in the measurement and interpretation of open-circuit indirect calorimetry in small animals. Int J Obes (Lond) 2006;30:1322–1331. doi: 10.1038/sj.ijo.0803280. [DOI] [PubMed] [Google Scholar]
- 59.Even PC, Nadkarni NA. Indirect calorimetry in laboratory mice and rats: principles, practical considerations, interpretation and perspectives. Am J Physiol Regul Integr Comp Physiol. 2012;303:R459–476. doi: 10.1152/ajpregu.00137.2012. [DOI] [PubMed] [Google Scholar]
- 60.Kleiber M. The Fire of Life. R.E. Krieger Publishing Company; New York: 1975. [Google Scholar]
- 61.Wu G. Amino Acids: Biochemistry and Nutrition. CRC Press; Boca Raton: 2013. [Google Scholar]
- 62.Brouwer E. Energy metabolism. London, UK: Academic Press; 1965. Report of sub-committee on constants and factors; pp. 441–443. [Google Scholar]
- 63.Rolfe DF, Brown GC. Cellular energy utilization and molecular origin of standard metabolic rate in mammals. Physiol Rev. 1997;77:731–758. doi: 10.1152/physrev.1997.77.3.731. [DOI] [PubMed] [Google Scholar]
- 64.Jungas RL, Halperin ML, Brosnan JT. Quantitative analysis of amino acid oxidation and related gluconeogenesis in humans. Physiol Rev. 1992;72:419–448. doi: 10.1152/physrev.1992.72.2.419. [DOI] [PubMed] [Google Scholar]
- 65.Tamura M, Hazeki O, Nioka S, Chance B. In vivo study of tissue oxygen metabolism using optical and nuclear magnetic resonance spectroscopies. Annu Rev Physiol. 1989;51:813–834. doi: 10.1146/annurev.ph.51.030189.004121. [DOI] [PubMed] [Google Scholar]
- 66.Ba ZF, Wang P, Koo DJ, Cioffi WG, Bland KI, Chaudry IH. Alterations in tissue oxygen consumption and extraction after trauma and hemorrhagic shock. Crit Care Med. 2000;28:2837–2842. doi: 10.1097/00003246-200008000-00026. [DOI] [PubMed] [Google Scholar]
- 67.Takeda S, Sato N, Tomaru T. Haemodynamic and splanchnic organ blood flow responses during sevoflurane-induced hypotension in dogs. Eur J Anaesthesiology. 2002;19:442–446. doi: 10.1017/s0265021502000704. [DOI] [PubMed] [Google Scholar]
- 68.Mongan PD, Moon-Massat PF, Rentko V, Mihok S, Dragovich A, Sharma P. Regional blood flow after serial normovolemic exchange transfusion with HBOC-201 (Hemopure) in anesthetized swine. J Trauma. 67:51–60. doi: 10.1097/TA.0b013e3181838030. [DOI] [PubMed] [Google Scholar]
- 69.Weiss HR. Regional oxygen consumption and supply in heart: effect of methoxamine-induced pressure rise. Am J Physiol. 1981;241:H370–375. doi: 10.1152/ajpheart.1981.241.3.H370. [DOI] [PubMed] [Google Scholar]
- 70.Stevenson NR, Weiss HR. Blood flow, O2 extraction and O2 consumption along the rat small intestine. Microvasc Res. 1988;35:278–286. doi: 10.1016/0026-2862(88)90082-9. [DOI] [PubMed] [Google Scholar]
- 71.Peoples GE, McLennan PL. Dietary fish oil reduces skeletal muscle oxygen consumption, provides fatigue resistance and improves contractile recovery in the rat in vivo hindlimb. Br J Nutr. 2010;104:1771–1779. doi: 10.1017/S0007114510002928. [DOI] [PubMed] [Google Scholar]
- 72.Clemens MG, Forrester T. Appearance of adenosine triphosphate in thee coronary sinus effluent from isolated working heart in response to hypoxia. J Physiol (London) 312:143–158. doi: 10.1113/jphysiol.1981.sp013621. [DOI] [PMC free article] [PubMed] [Google Scholar]
- 73.Carlsson C, Smith DS, Keykhah MM, Englebach I, Harp JR. The effects of high-dose fentanyl on cerebral circulation and metabolism in rats. Anesthesiology. 1982;57:375–380. doi: 10.1097/00000542-198211000-00005. [DOI] [PubMed] [Google Scholar]
- 74.Refinetti R. Partition of heat production in the rat. Biotemas. 1989;2:47–55. [Google Scholar]
- 75.Ma SW, Foster DO, Nadeau BE, Triandafillou J. Absence of increased oxygen consumption in brown adipose tissue of rats exhibiting “cafeteria” diet-induced thermogenesis. Can J Physiol Pharmacol. 1988;66:1347–1354. doi: 10.1139/y88-221. [DOI] [PubMed] [Google Scholar]
- 76.Sörbris R, Monti M, Nilsson-Ehle P, Wadsö I. Heat production by adipocytes from obese subjects before and after weight reduction. Metabolism. 1982;31:973. doi: 10.1016/0026-0495(82)90137-8. [DOI] [PubMed] [Google Scholar]
- 77.Even PC, Rolland V, Roseau S, Bouthegourd JC, Tomé D. Prediction of basal metabolism from organ size in the rat: relationship to strain, feeding, age, and obesity. Am J Physiol Regul Integr Comp Physiol. 2001;280:R1887–1896. doi: 10.1152/ajpregu.2001.280.6.R1887. [DOI] [PubMed] [Google Scholar]
- 78.Leibel RL, Rosenbaum M, Hirsch J. Changes in energy expenditure resulting from altered body weight. N Engl J Med. 1995;332:621. doi: 10.1056/NEJM199503093321001. [DOI] [PubMed] [Google Scholar]
- 79.Jobgen WS, Fried SK, Fu WJ, Meininger CJ, Wu G. Regulatory role for the arginine-nitric oxide pathway in metabolism of energy substrates. J Nutr Biochem. 2006;17:571–588. doi: 10.1016/j.jnutbio.2005.12.001. [DOI] [PubMed] [Google Scholar]
- 80.Ichikawa M, Miyasaka K, Fujita Y, Shimazoe T, Funakoshi A. Disappearance of diurnal rhytm of energy expenditure in genetically diabetic obese rats. Jpn J Physiol. 1998;48:211–214. doi: 10.2170/jjphysiol.48.211. [DOI] [PubMed] [Google Scholar]
- 81.Yoshida Y, Ichikawa M, Ohta M, Kanai S, Kobayash M, Ichimaru Y, Shimazoe T, Watanabe S, Funakoshi A, Miyasak K. A peroxisome proliferator-activated receptor gamma agonist influenced daily profile of energy expenditure in genetically obese diabetic rats. Jpn J Pharmacol. 2002;88:279–284. doi: 10.1254/jjp.88.279. [DOI] [PubMed] [Google Scholar]
- 82.Ichikawa M, Kanai S, Ichimani Y, Funakoshi A, Miyasaka K. The diurnal rhythm of energy expenditure differs between obese and glucose intolerant rats and Streptozotocin-induced diabetic rats. J Nutr. 2000;130:2562–2567. doi: 10.1093/jn/130.10.2562. [DOI] [PubMed] [Google Scholar]
- 83.Li Y, Wang N, Carroll RJ. Selecting the Number of Principal Components in Functional Data. J Am Stat Assoc. 2013 doi: 10.1080/01621459.2013.788980. [DOI] [PMC free article] [PubMed] [Google Scholar]
- 84.Longo KA, Charoenthongtrakul S, Giuliana DJ, Govek EK, McDonagh T, Distefano PS, Geddes BJ. The 24-hour respiratory quotient predicts energy intake and changes in body mass. Am J Physiol Regul Integr Comp Physiol. 2010;298:R747–754. doi: 10.1152/ajpregu.00476.2009. [DOI] [PubMed] [Google Scholar]
- 85.Ogden CL, Yanovski SZ, Carroll MD, Flegal KM. The epidemiology of obesity. Gastroenterology. 2007;132:2087–2102. doi: 10.1053/j.gastro.2007.03.052. [DOI] [PubMed] [Google Scholar]
- 86.German AJ. The growing problem of obesity in dogs and cats. J Nutr. 2006;136:1940S–1946S. doi: 10.1093/jn/136.7.1940S. [DOI] [PubMed] [Google Scholar]
- 87.Song MK, Rosenthal MJ, Song AM, Uyemura K, Yang H, Ament ME, Yamaguchi DT, Cornford EM. Body weight reduction in rats by oral treatment with zinc plus cyclo- (His-Pro) Br J Pharmacol. 2009;158:442–450. doi: 10.1111/j.1476-5381.2009.00201.x. [DOI] [PMC free article] [PubMed] [Google Scholar]
- 88.Everitt RB, Hothorn T. An Introduction to Applied Multivariate Analysis with R. Heidelberg: Springer; 2011. [Google Scholar]
- 89.Fu WJ, Stromberg AJ, Viele K, Carroll RJ, Wu G. Statistics and bioinformatics in nutritional sciences: analysis of complex data in the era of systems biology. J Nutr Biochem. 2010;21:561–572. doi: 10.1016/j.jnutbio.2009.11.007. [DOI] [PMC free article] [PubMed] [Google Scholar]
- 90.Wei JW, Carroll RJ, Harden KK, Wu G. Comparisons of treatment means when factors do not interact in two-factorial studies. Amino Acids. 2012;42:2031–2035. doi: 10.1007/s00726-011-0924-0. [DOI] [PMC free article] [PubMed] [Google Scholar]
- 91.Li S, Lin JD. Molecular control of circadian metabolic rhythms. J Appl Physiol. 2009;107:1959–1964. doi: 10.1152/japplphysiol.00467.2009. [DOI] [PubMed] [Google Scholar]
- 92.Liu C, Li S, Liu T, Borjigin J, Lin JD. Transcriptional coactivator PGC-1alpha integrates the mammalian clock and energy metabolism. Nature. 2007;447:477–481. doi: 10.1038/nature05767. [DOI] [PubMed] [Google Scholar]
- 93.Zhang S, Qiao S, Ren M, Zeng X, Ma X, Wu Z, Thacker P, Wu G. Supplementation with branched-chain amino acids to a low-protein diet regulates intestinal expression of amino acid and peptide transporters in weanling pigs. Amino Acids. 2013;45:1191–1205. doi: 10.1007/s00726-013-1577-y. [DOI] [PubMed] [Google Scholar]
- 94.Ruan Z, Lv Y, Fu X, He Q, Deng Z, Liu W, Yingli Y, Wu X, Wu G, Wu X, Yin Y. Metabolomic analysis of amino acid metabolism in colitic rats supplemented with lactosucrose. Amino Acids. 2013;45:877–887. doi: 10.1007/s00726-013-1535-8. [DOI] [PubMed] [Google Scholar]
- 95.Zhang J, Yin Y, Shu XG, Li T, Li F, Tan B, Wu Z, Wu G. Oral administration of MSG increases expression of glutamate receptors and transporters in the gastrointestinal tract of young piglets. Amino Acids. 2013;45:1169–1177. doi: 10.1007/s00726-013-1573-2. [DOI] [PubMed] [Google Scholar]
- 96.Wang WW, Wu ZL, Dai ZL, Yang Y, Wang JJ, Wu G. Glycine metabolism in animals and humans: implications for nutrition and health. Amino Acids. 2013;45:463–477. doi: 10.1007/s00726-013-1493-1. [DOI] [PubMed] [Google Scholar]
- 97.Wu G. Functional amino acids in nutrition and health. Amino Acids. 2013;45:407–411. doi: 10.1007/s00726-013-1500-6. [DOI] [PubMed] [Google Scholar]
- 98.Wu G, Bazer FW, Satterfield MC, Li XL, Wang XQ, Johnson GA, Burghardt RC, Dai ZL, Wang JJ, Wu ZL. Impacts of arginine nutrition on embryonic and fetal development in mammals. Amino Acids. 2013;45:241–256. doi: 10.1007/s00726-013-1515-z. [DOI] [PubMed] [Google Scholar]
- 99.Bernard JR, Liao YH, Ding Z, Hara D, Kleinert M, Nelson JL, Ivy JL. An amino acid mixture improves glucose tolerance and lowers insulin resistance in the obese Zucker rat. Amino Acids. 2013;45:191–203. doi: 10.1007/s00726-013-1488-y. [DOI] [PubMed] [Google Scholar]
- 100.Torii K, Uneyama H, Nakamura E. Physiological roles of dietary glutamate signaling via gut-brain axis due to efficient digestion and absorption. J Gastroenterol. 2013;48:442–451. doi: 10.1007/s00535-013-0778-1. [DOI] [PMC free article] [PubMed] [Google Scholar]
- 101.Nakamura H, Kawamata Y, Kuwahara T, Smriga M, Sakai R. Long-term ingestion of monosodium L-glutamate did not induce obesity, dyslipidemia or insulin resistance: a two-generation study in mice. J Nutr Sci Vitaminol (Tokyo) 2013;59:129–135. doi: 10.3177/jnsv.59.129. [DOI] [PubMed] [Google Scholar]
- 102.Adeva MM, Calviño J, Souto G, Donapetry C. Insulin resistance and the metabolism of branched-chain amino acids in humans. Amino Acids. 2012;43:171–181. doi: 10.1007/s00726-011-1088-7. [DOI] [PubMed] [Google Scholar]
- 103.Mels CM, Schutte AE, Schutte R, Huisman HW, Smith W, Fourie CM, Kruger R, van Rooyen JM, Malan NT, Malan L. The link between vascular deterioration and branched chain amino acids in a population with high glycated haemoglobin: the SABPA study. Amino Acids. 2013;45:1405–1413. doi: 10.1007/s00726-013-1611-0. [DOI] [PubMed] [Google Scholar]
- 104.Bassil MS, Gougeon R. Muscle protein anabolism in type 2 diabetes. Curr Opin Clin Nutr Metab Care. 2013;16:83–88. doi: 10.1097/MCO.0b013e32835a88ee. [DOI] [PubMed] [Google Scholar]
- 105.Marliss EB, Chevalier S, Gougeon R, Morais JA, Lamarche M, Adegoke OA, Wu G. Elevations of plasma methylarginines in obesity and ageing are related to insulin sensitivity and rates of protein turnover. Diabetologia. 2006;49:351–359. doi: 10.1007/s00125-005-0066-6. [DOI] [PubMed] [Google Scholar]
- 106.Fernandez JR, Klimentidis YC, Dulin-Keita A, Casazza K. Genetic influences in childhood obesity: recent progress and recommendations for experimental designs. Int J Obes (Lond) 2012;36:479–484. doi: 10.1038/ijo.2011.236. [DOI] [PubMed] [Google Scholar]
- 107.Ramachandrappa S, Farooqi IS. Genetic approaches to understanding human obesity. J Clin Invest. 2011;121:2080–2086. doi: 10.1172/JCI46044. [DOI] [PMC free article] [PubMed] [Google Scholar]