Abstract
The megakaryoblastic leukemia 1 (MKL1) protein functions as a transcriptional coactivator of the serum response factor. MKL1 has three RPEL motifs (RPEL1, RPEL2, and RPEL3) in its N-terminal region. MKL1 binds to monomeric G-actin through RPEL motifs, and the dissociation of MKL1 from G-actin promotes the translocation of MKL1 to the nucleus. Although structural data are available for RPEL motifs of MKL1 in complex with G-actin, the structural characteristics of RPEL motifs in the free state have been poorly defined. Here we characterized the structures of free RPEL motifs using NMR and CD spectroscopy. NMR and CD measurements showed that free RPEL motifs are largely unstructured in solution. However, NMR analysis identified transient α-helices in the regions where helices α1 and α2 are induced upon binding to G-actin. Proline mutagenesis showed that the transient α-helices are locally formed without helix-helix interactions. The helix content is higher in the order of RPEL1, RPEL2, and RPEL3. The amount of preformed structure may correlate with the binding affinity between the intrinsically disordered protein and its target molecule.
The megakaryoblastic leukemia 1 (MKL1) protein was originally identified in a study of chromosomal translocation in infants and children with acute megakaryocytic leukemia1,2. It has been implicated in cancer cell migration and invasion3,4 as well as in the regulation of neurite outgrowth5,6,7 and dendritic complexity8,9,10. MKL1 is a member of the myocardin-related transcription factor family, which regulates essential biological processes, including the development and differentiation of cells. MKL1 functions as a transcriptional coactivator of the serum response factor (SRF) in the cell nucleus. It also functions as a G-actin-binding protein. The localization of MKL1 in cells is regulated by the monomeric G-actin level in the cytoplasm—namely, actin polymerization. Actin polymerization is induced by the activation of RhoA signaling, which decreases the monomeric G-actin level in the cytoplasm. The depletion of G-actin in the cytoplasm results in the dissociation of MKL1 from G-actin. As a result, MKL1 translocates from the cytoplasm to the nucleus through the importin α/β1 heterodimer11. In the nucleus, MKL1 collaborates with SRF to induce the transcription of a number of genes, including actin, c-fos, and SRF itself12,13,14,15,16,17.
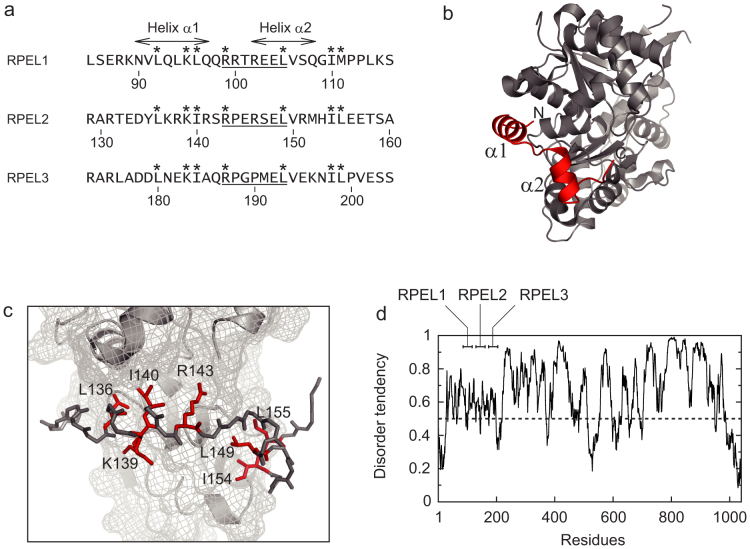
Rat MKL1 (GenBank accession number: BAN82605.1) is a 1038 amino acid protein that has an N-terminal actin-binding RPEL domain, basic boxes, a glutamine-rich domain, an SAP domain, a leucine zipper-like domain, and a transactivation domain17,18. The RPEL domain consists of three RPEL motifs, each of which functions as an actin-binding element19. RPEL2 and RPEL3 each have a core sequence of RPxxxEL, while RPEL1 has a noncanonical RRxxxEL core sequence (Figure 1a). The crystal structures of RPEL1 and RPEL2 in complex with G-actin have been reported20. In these complexes, the RPEL motif adopts two α-helices (helices α1 and α2) and binds to the hydrophobic cleft and hydrophobic ledge of G-actin (Figure 1b). The complex structure also suggests that side chains of L136, K139, I140, R143, L149, I154, and L155 of RPEL2 are essential for the interaction with G-actin (Figure 1c)20.
Figure 1.
(a) Amino acid sequences of RPEL motifs from rat MKL1. The positions of helices α1 and α2 of RPEL1 in complex with G-actin are indicated. The sequences of RPxxxEL and RRxxxEL are underlined. Numbering is based on GenBank accession number BAN82605.1. Asterisks indicate the essential residues for actin-binding. (b) Three-dimensional structure of RPEL2 bound to G-actin (PDB entry 2V52). The positions of helices α1 and α2 are indicated. (c) The interaction region between RPEL2 and G-actin (PDB entry 2V52). G-actin is shown in surface and cartoon representations. RPEL2 is shown in stick representations and essential residues for actin-binding are shown in red. The side chain of K139 in RPEL2 adopts two conformations, both interacting with G-actin20. (d) Prediction of disorder tendency of full-length MKL1 by the IUPred predictor22. Scores above a threshold value of 0.5 are considered to be disordered. The positions of RPEL1, RPEL2, and RPEL3 are indicated.
Although the structure of the RPEL motif in complex with G-actin has been reported20, little is known about the conformational properties of RPEL motifs in the free state. This information is necessary to fully understand the translocation of MKL1 from the cytoplasm to the nucleus, since the translocation requires the dissociation of MKL1 from G-actin. In this study, the structure of the free RPEL motif is investigated by nuclear magnetic resonance (NMR) and circular dichroism (CD) spectroscopy.
Results
CD analysis of RPELs
We analyzed the secondary structure of RPELs using CD spectroscopy. The CD spectra of RPELs exhibited a strong negative band near 200 nm and a weak negative shoulder at 220 nm, which is characteristic of unfolded polypeptides21 (Figure 2). This is supported by the prediction of structural disorder by IUPred22, which indicates that RPEL1, RPEL2, and RPEL3 are disordered (Figure 1d). The negative band near 200 nm is stronger in the order of RPEL3 > RPEL2 > RPEL1 (Figure 2). Although free RPEL motifs are largely unstructured, analysis of the helix content shows that RPEL adopts a small but significant amount of α-helix conformation. The helix content is higher in the order of RPEL1 > RPEL2 > RPEL3 (Table 1).
Figure 2. CD spectra of RPEL1 (solid line), RPEL2 (dotted line), and RPEL3 (dashed line) at pH 7.0 and 25°C in the far-UV region.
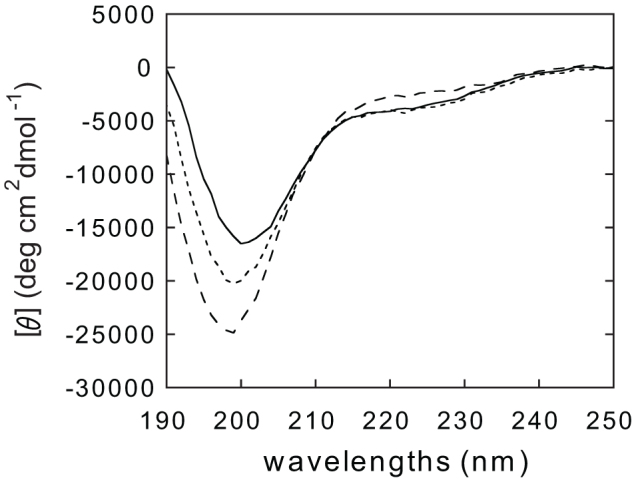
Table 1. Helix content of the RPEL motif calculated from far-UV CD spectra.
Chemical shift analysis of RPEL1
The conformational properties of RPEL1 in the free state were investigated by NMR spectroscopy (Figure 3). NMR spectra were measured at 15°C to reduce hydrogen exchange. Backbone resonance assignments were obtained with standard triple-resonance NMR experiments. The 1H-15N HSQC spectrum of RPEL1 shows the backbone amide resonances within 8.0–8.6 ppm in the 1H dimension (Figure 3). The narrow chemical shift dispersion in the 1H dimension is characteristic of intrinsically disordered proteins (IDPs)23,24.
Figure 3. The 1H-15N HSQC spectrum of RPEL1 at pH 7.0 and 15°C.
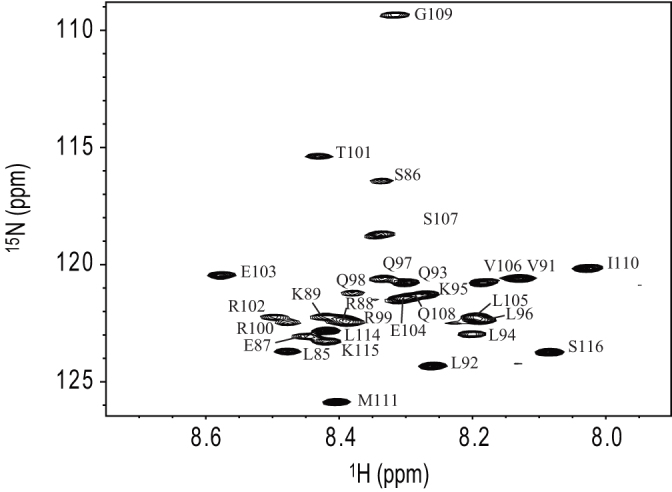
The backbone resonance assignments are indicated. Numbering is based on GenBank accession number BAN82605.1.
NMR chemical shifts can be used to probe the propensity of proteins to adopt an α-helical conformation and extended (β-strand) conformation at the residue level. In order to investigate the conformational properties of RPEL, we utilized the secondary structure propensity (SSP) program25. The SSP program combines chemical shifts from different nuclei into a single score indicating the secondary structure propensity. A positive SSP score indicates a propensity for α-helical conformation, and a negative score indicates a propensity for extended (β-strand) conformation (Figure 4a). The SSP scores represent the expected fraction of α-helical or extended (β-strand) conformation at a given residue25. For instance, an SSP score of 0.5 indicates that 50% of the conformers in the disordered state ensemble adopt an α-helical conformation at that particular position. In order to examine the positions of helices, we utilized the difference between 13Cα secondary shifts and 13Cβ secondary shifts (ΔδCα - ΔδCβ) (Figure 4b). Consecutive positive values of ΔδCα - ΔδCβ indicate a propensity to adopt an α-helical structure, and consecutive negative values indicate an extended (β-strand) structure25. Since appropriate random coil chemical shifts are important to obtain reliable secondary structure propensities, we used the random coil chemical shifts suitable for IDPs26.
Figure 4.
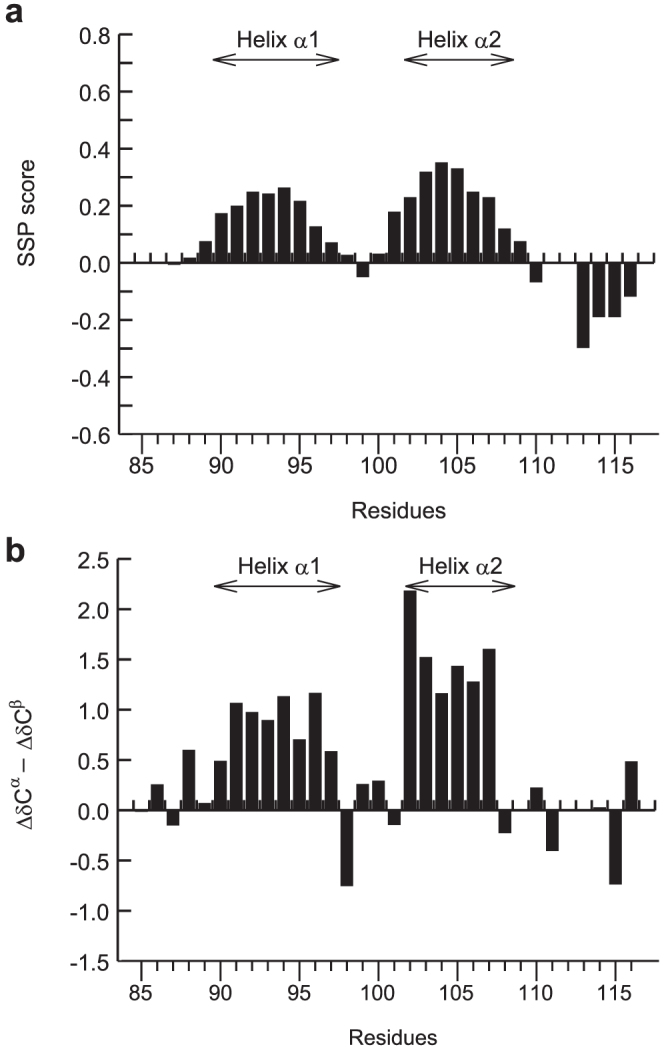
(a) SSP scores of RPEL1. (b) ΔδCα - ΔδCβ secondary chemical shifts of RPEL1. The positions of helices α1 and α2 are indicated in each panel.
The residues from Asn90 to Gln97 and from Arg102 to Ser107 have a propensity to adopt an α-helical conformation, indicating that helices α1 and α2 are formed in free RPEL1 (Figure 4b). This does not mean, however, that the helix α1 and α2 are stably formed in free RPEL1, since the SSP scores are below 0.5 (Figure 4a). The averaged SSP score is ~19% for the helix α1 region (residues 90–97) and ~26% for the helix α2 region (residues 102–108). Therefore, helices α1 and α2 are transiently formed in free RPEL1.
Proline mutagenesis of RPEL1
We confirmed the transient α-helix formation of RPEL1 using proline mutagenesis. Proline mutation unfolds or greatly destabilizes the protein structure when inserted in the middle of secondary structures27,28. Mutation of Leu94 to Pro reduced the α-helical propensity in the helix α1 region, indicating the helix formation. However, the mutation of Leu94 to Pro had little effect on the helical propensity in the α2 region (Figure 5a). In addition, the mutation of Leu105 to Pro reduced the α-helical propensity in the α2 region of RPEL1 but had little effect on the helical propensity in the α1 region (Figure 5b). These results indicate that the transient α-helices in free RPEL1 are independently formed without helix-helix interactions.
Figure 5. ΔδCα - ΔδCβ secondary chemical shifts of the (a) L94P and (b) L105P mutant of RPEL1.
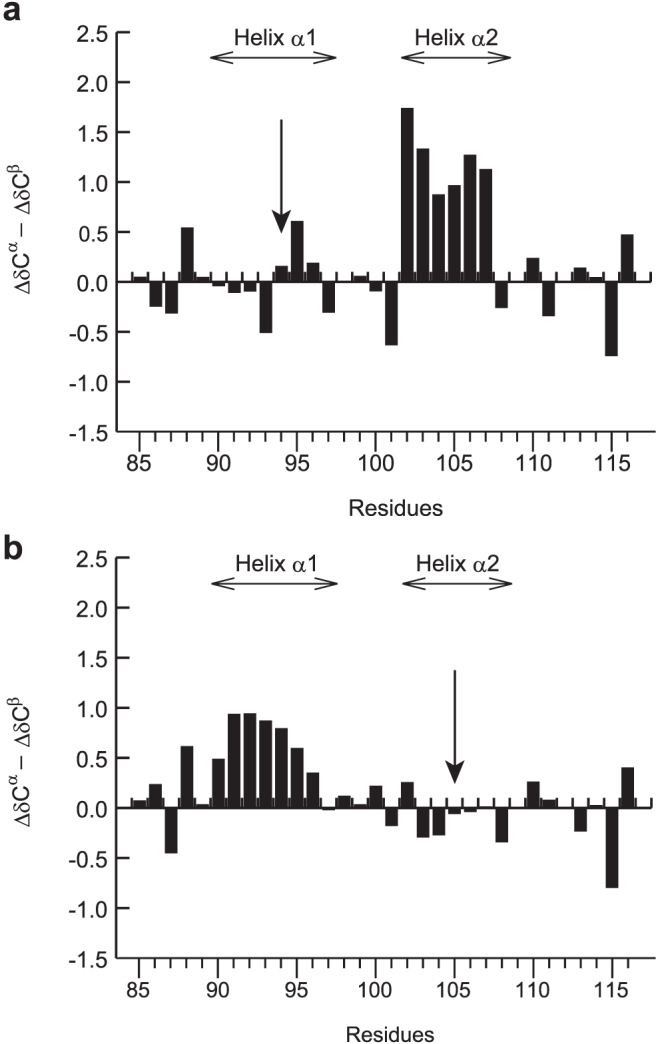
The positions of helices α1 and α2 are indicated in each panel. The positions of the mutations are indicated by arrows.
Chemical shift analysis of RPEL2 and RPEL3
We also investigated the conformational propensity of RPEL2 and RPEL3 using NMR spectroscopy (Figure 6). The residues from Thr132 to Lys139 and from Leu149 to Met 152 of RPEL2 have a propensity to adopt an α-helical conformation (Figure 6a). On the other hand, RPEL3 exhibits no significant helical propensity (Figure 6b). Together, our results suggest that the helices α1 and α2 are transiently formed in RPEL1 and RPEL2, while the helix is not formed in RPEL3. The helix content is higher in the order of RPEL1 > RPEL2 > RPEL3 (Figures 4 and 6).
Figure 6. ΔδCα - ΔδCβ secondary chemical shifts of (a) RPEL2 and (b) RPEL3.
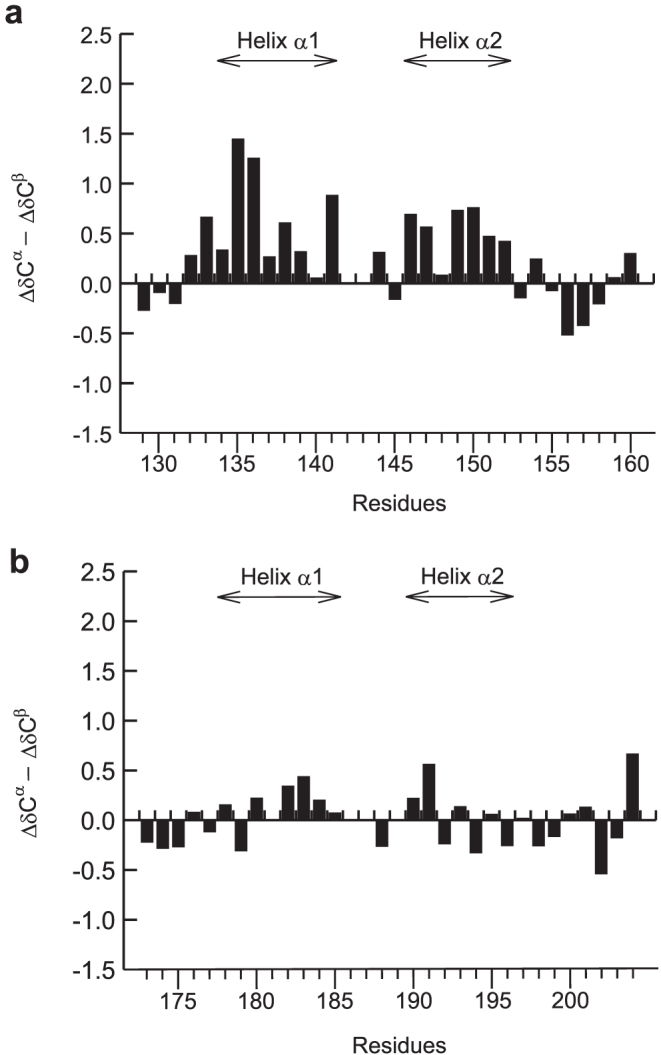
The positions of helices α1 and α2 are indicated in each panel.
Discussion
Many IDPs undergo a disorder-to-order transition upon binding to their target molecule, a process that has been called “coupled folding and binding29.” There are two models describing the mechanism of the disorder-to-order transition—namely, the conformational selection model and the induced fit model29. In both models, IDPs are largely unstructured before binding to their target molecules. On the other hand, a number of studies have shown that the disordered state ensemble contains a significant amount of native-like secondary structure21,30. However, the significance of the native-like secondary structure in the disorder-to-order transition is not fully understood.
In the present study, we investigated the conformational properties of RPEL1-3 in the free state using NMR and CD spectroscopy. The isolated RPEL motifs are largely disordered in solution, while RPELs acquire the tertiary structure upon binding to the monomeric G-actin20. According to the crystal structures of RPEL1 and RPEL2 in complex with G-actin, the RPEL motif adopts two α-helices and binds to the hydrophobic cleft and the hydrophobic ledge of G-actin. The essential residues for actin binding are completely conserved between RPEL2 and RPEL3, while the essential residues are partially different between RPEL1 and RPEL2: Ile140 and Leu155 of RPEL2 are substituted with Leu and Met in RPEL1, although Leu136, Lys139, Arg143, Leu149, and Ile154 of RPEL2 are conserved in RPEL120.
Our experimental data indicate that free RPELs contain α-helical structures. The α-helical structure is partially and transiently formed in the regions where the helices α1 and α2 are induced upon binding to G-actin20. Generally, the structural disorder of IDP in solution raises the entropic penalty when IDP undergoes the disorder-to-order transition upon binding to its target molecule. The preformed α-helices of IDP may decrease the entropic penalty of the disorder-to-order transition31.
Mouilleron et al. have shown that RPEL1 and RPEL2 bind to G-actin tightly, with dissociation constants (Kd) of 1.0 and 1.9 μM, respectively20. They also showed that RPEL3 binds weakly to G-actin with a Kd value of 28.9 μM, although the essential residues for the interaction with G-actin are conserved in RPEL3. From these Kd values, the Gibbs free energy changes (ΔG0) of binding are −8.2 kcal/mol, −7.8 kcal/mol, and −6.2 kcal/mol for RPEL1, RPEL2, and RPEL3, respectively. The helical propensity is higher in the order of RPEL1, RPEL2, and RPEL3. These results suggest that the amount of preformed structure may correlate with the ΔG0 value of binding. It is conceivable that the binding strength between IDP and the target molecule is modulated by the preformed structural elements in free IDP31. A previous study suggests that the preformed secondary structure in IDP is an important determinant for the interaction between IDP and its target molecule32. Iešmantavičius et al. demonstrated that the helical propensity in the activator domain of the activator for thyroid and retinoid receptors (ACTR) modulates its binding to the nuclear coactivator binding domain (NCBD) of the CREB binding protein, both in terms of association and dissociation, which results in the increased affinity between ACTR and NCBD32.
Proline mutagenesis shows that the transient α-helices in RPEL1 are locally formed without helix-helix interactions. In contrast to our observation, long-range helix-helix interactions are formed in the unfolded state of other proteins such as ACTR33, acyl coenzyme A binding protein34, and hepatitis C virus protein NS5A35. A key difference seems to be that these other proteins have amphipathic helices with a clear hydrophobic side that is likely to form helix-helix interactions. The difference may also result from the length of α-helices. The α-helices of RPEL are shorter than those of the other unfolded proteins.
The RPEL motif of MKL1 is an ensemble of conformations ranging from random coils to native-like α-helices. Our results suggest that the amount of preformed structure may correlate with the binding strength between IDP and the target molecule. In order to fully understand the mechanism of the disorder-to-order transition, it will be useful to investigate the binding kinetics of RPEL with varying helical propensity to G-actin32.
Methods
Protein expression and purification
MKL1(85–116), MKL1(129–160), and MKL1(173–204) were expressed as GST-fusion proteins18. The DNAs encoding MKL1(85–116), MKL1(129–160), and MKL1(173–204) were inserted into a pOP3C plasmid. Sequencing of the inserted DNA was performed on an ABI PRISM 3130 Genetic Analyzer (Applied Biosystems). The GST-fusion proteins were expressed in C41(DE3)RIPL cells harboring the pOP3C plasmid. The cells were grown in M9 minimal medium supplemented with 15NH4Cl and 13C-glucose. Protein expression was induced by the addition of isopropyl-β-D-thiogalactopyranoside at a final concentration of 0.3 mM. After 5-h cultivation, the cells were collected by centrifugation at 3765 g for 15 min at 4°C.
The C41(DE3)RIPL cells were resuspended in buffer A (20 mM Tris-HCl, 100 mM NaCl, and 1 mM dithiothreitol at pH 7.5) and lysed by sonication on ice. The proteins were detected in a soluble fraction after centrifugation at 9400 g for 60 min at 4°C. The GST-fusion proteins were purified with a glutathione Sepharose 4B column (GE Healthcare Bio-Sciences) equilibrated with buffer A. The purified GST-fusion protein was digested on a column with 3C protease for 15 h at 4°C to remove the GST region. The flow-through containing RPELs was collected by adding buffer A to the column, and RPELs were further purified by high-performance liquid chromatography with a COSMOSIL C-18 AR-II column (Nacalai Tesque). The solutions containing RPELs were collected and dialyzed against buffer B (10 mM sodium phosphate and 50 mM NaCl at pH 7.0). The purified RPELs have an N-terminal extension (GPHM) derived from the pOP3C plasmid. Matrix-assisted laser desorption ionization time-of-flight mass analysis (MALDI-TOF MS) was used to confirm the molecular weights of the RPELs. MALDI-TOF MS was performed on a Bruker Daltonics Autoflex-T1 mass spectrometer.
NMR spectroscopy
For NMR experiments, the proteins in buffer B were concentrated to 0.12–0.50 mM and D2O was added to a final concentration of 7%. The NMR samples also contained 1 mM NaN3 and 20 μM 2,2-dimethyl-2-silapentane-5-sulfonate sodium salt. All NMR experiments were performed on a Bruker Avance 800 MHz spectrometer equipped with a cryoprobe. 1HN, 15N, 13C′, 13Cα, and 13Cβ resonances were assigned using standard three-dimensional triple resonance experiments including CBCANH36, CBCA(CO)NH37, HNCO38, HN(CA)CO39, HNCA38, and HN(CO)CA38. The assignments have been deposited in the BioMagResBank under BMRB accession numbers 11564, 11565, 11566, 11567 and 11568. The 1H chemical shifts were directly referenced to the resonance of 2,2-dimethyl-2-silapentane-5-sulfonate sodium salt, while the 13C and 15N chemical shifts were indirectly referenced with the absolute frequency ratios40. NMR data were processed with NMRPipe41 and analyzed with NMRView42.
The random coil chemical shifts of Kjaergaard et al.26 were used to calculate the 13Cα secondary shifts and the 13Cβ secondary shifts. The SSP scores were calculated with the random coil chemical shifts26 and the average secondary shifts for the fully formed secondary structure43 as described previously25. An averaging window of five residues was applied in the SSP analysis as described previously25. The SSP scores were calculated using calibrated 13Cα and 13Cβ chemical shifts as inputs.
CD spectroscopy
CD spectra were measured using a J-805 spectropolarimeter (JASCO) at 25°C. Sample solutions contained 0.25–0.39 mM RPEL, 10 mM sodium phosphate, and 50 mM NaCl (pH 7.0). A quartz cell with a 0.2 mm path length was used for all measurements. The content of the secondary structure was estimated using the CONTIN method, the self-consistent method, and the variable-selection method44,45,46. The Dicroprot program47 and the Dicroprot server48 were used for the calculation.
Author Contributions
M.M. wrote the paper. M.M. and T.F. performed the NMR experiments and analysis. T.F., T.O. and M.I. prepared the plasmids. T.F. and T.O. purified the proteins. M.T. and A.T. designed the project and reviewed the manuscript.
Acknowledgments
This study was supported by Grants-in-Aid for Scientific Research in Innovative Areas (project number: 21113003) from the Ministry of Education, Culture, Sports, Science, and Technology of Japan.
Funding This study was supported by Grants-in-Aid for Scientific Research in Innovative Areas (project number: 21113003) from theMinistry of Education, Culture, Sports, Science, and Technology of Japan.
References
- Ma Z. et al. Fusion of two novel genes, RBM15 and MKL1, in the t(1;22)(p13;q13) of acute megakaryoblastic leukemia. Nat. Genet. 28, 220–221 (2001). [DOI] [PubMed] [Google Scholar]
- Mercher T. et al. Involvement of a human gene related to the Drosophila spen gene in the recurrent t(1;22) translocation of acute megakaryocytic leukemia. Proc. Natl. Acad. Sci U. S. A. 98, 5776–5779 (2001). [DOI] [PMC free article] [PubMed] [Google Scholar]
- Medjkane S., Perez-Sanchez C., Gaggioli C., Sahai E. & Treisman R. Myocardin-related transcription factors and SRF are required for cytoskeletal dynamics and experimental metastasis. Nat. Cell Biol. 11, 257–268 (2009). [DOI] [PMC free article] [PubMed] [Google Scholar]
- Brandt D. T. et al. SCAI acts as a suppressor of cancer cell invasion through the transcriptional control of beta1-integrin. Nat. Cell Biol. 11, 557–568 (2009). [DOI] [PubMed] [Google Scholar]
- Mokalled M. H., Johnson A., Kim Y., Oh J. & Olson E. N. Myocardin-related transcription factors regulate the Cdk5/Pctaire1 kinase cascade to control neurite outgrowth, neuronal migration and brain development. Development 137, 2365–2374 (2010). [DOI] [PMC free article] [PubMed] [Google Scholar]
- Knöll B. et al. Serum response factor controls neuronal circuit assembly in the hippocampus. Nat. Neurosci. 9, 195–204 (2006). [DOI] [PubMed] [Google Scholar]
- Wickramasinghe S. R. et al. Serum response factor mediates NGF-dependent target innervation by embryonic DRG sensory neurons. Neuron 58, 532–545 (2008). [DOI] [PMC free article] [PubMed] [Google Scholar]
- Shiota J. et al. Developmental expression of the SRF co-activator MAL in brain: role in regulating dendritic morphology. J. Neurochem. 98, 1778–1788 (2006). [DOI] [PubMed] [Google Scholar]
- O'Sullivan N. C., Pickering M., Di Giacomo D., Loscher J. S. & Murphy K. J. Mkl transcription cofactors regulate structural plasticity in hippocampal neurons. Cereb. Cortex. 20, 1915–1925 (2010). [DOI] [PubMed] [Google Scholar]
- Ishikawa M. et al. Involvement of the serum response factor coactivator megakaryoblastic leukemia (MKL) in the activin-regulated dendritic complexity of rat cortical neurons. J. Biol. Chem. 285, 32734–32743 (2010). [DOI] [PMC free article] [PubMed] [Google Scholar]
- Pawłowski R., Rajakylä E. K., Vartiainen M. K. & Treisman R. An actin-regulated importin α/β-dependent extended bipartite NLS directs nuclear import of MRTF-A. EMBO J. 29, 3448–3458 (2010). [DOI] [PMC free article] [PubMed] [Google Scholar]
- Miralles F., Posern G., Zaromytidou A. I. & Treisman R. Actin dynamics control SRF activity by regulation of its coactivator MAL. Cell 113, 329–342 (2003). [DOI] [PubMed] [Google Scholar]
- Parmacek M. S. Myocardin-related transcription factors: critical coactivators regulating cardiovascular development and adaptation. Circ. Res. 100, 633–644 (2007). [DOI] [PubMed] [Google Scholar]
- Pipes G. C., Creemers E. E. & Olson E. N. The myocardin family of transcriptional coactivators: versatile regulators of cell growth, migration, and myogenesis. Genes Dev. 20, 1545–1556 (2006). [DOI] [PubMed] [Google Scholar]
- Cen B., Selvaraj A. & Prywes R. Myocardin/MKL family of SRF coactivators: key regulators of immediate early and muscle specific gene expression. J. Cell Biochem. 93, 74–82 (2004). [DOI] [PubMed] [Google Scholar]
- Scharenberg M. A., Chiquet-Ehrismann R. & Asparuhova M. B. Megakaryoblastic leukemia protein-1 (MKL1): Increasing evidence for an involvement in cancer progression and metastasis. Int. J. Biochem. Cell Biol. 42, 1911–1914 (2010). [DOI] [PubMed] [Google Scholar]
- Kalita K., Kuzniewska B. & Kaczmarek L. MKLs: co-factors of serum response factor (SRF) in neuronal responses. Int. J. Biochem. Cell Biol. 44, 1444–1447 (2012). [DOI] [PubMed] [Google Scholar]
- Ishikawa M. et al. Identification, expression and characterization of rat isoforms of the serum response factor (SRF) coactivator MKL1. FEBS Open Bio. 3, 387–393 (2013). [DOI] [PMC free article] [PubMed] [Google Scholar]
- Guettler S., Vartiainen M. K., Miralles F., Larijani B. & Treisman R. RPEL motifs link the serum response factor cofactor MAL but not myocardin to Rho signaling via actin binding. Mol. Cell Biol. 28, 732–742 (2008). [DOI] [PMC free article] [PubMed] [Google Scholar]
- Mouilleron S., Guettler S., Langer C. A., Treisman R. & McDonald N. Q. Molecular basis for G-actin binding to RPEL motifs from the serum response factor coactivator MAL. EMBO J. 27, 3198–3208 (2008). [DOI] [PMC free article] [PubMed] [Google Scholar]
- Uversky V. N. Natively unfolded proteins: a point where biology waits for physics. Protein Sci. 11, 739–756 (2002). [DOI] [PMC free article] [PubMed] [Google Scholar]
- Dosztányi Z., Csizmok V., Tompa P. & Simon I. IUPred: web server for the prediction of intrinsically unstructured regions of proteins based on estimated energy content. Bioinformatics 21, 3433–3434 (2005). [DOI] [PubMed] [Google Scholar]
- Dyson H. J. & Wright P. E. Unfolded proteins and protein folding studied by NMR. Chem. Rev. 104, 3607–3622 (2004). [DOI] [PubMed] [Google Scholar]
- Kosol S., Contreras-Martos S., Cedeño C. & Tompa P. Structural characterization of intrinsically disordered proteins by NMR spectroscopy. Molecules 18, 10802–10828 (2013). [DOI] [PMC free article] [PubMed] [Google Scholar]
- Marsh J. A., Singh V. K., Jia Z. & Forman-Kay J. D. Sensitivity of secondary structure propensities to sequence differences between α- and γ-synuclein: implications for fibrillation. Protein Sci. 15, 2795–2804 (2006). [DOI] [PMC free article] [PubMed] [Google Scholar]
- Kjaergaard M., Brander S. & Poulsen F. M. Random coil chemical shift for intrinsically disordered proteins: effects of temperature and pH. J. Biomol. NMR 49, 139–149 (2011). [DOI] [PubMed] [Google Scholar]
- Schulman B. A. & Kim P. S. Proline scanning mutagenesis of a molten globule reveals non-cooperative formation of a protein's overall topology. Nat. Struct. Biol. 3, 682–687 (1996). [DOI] [PubMed] [Google Scholar]
- Mizuguchi M. et al. Structural characterization of a trapped folding intermediate of pyrrolidone carboxyl peptidase from a hyperthermophile. Biochemistry 51, 6089–6096 (2012). [DOI] [PubMed] [Google Scholar]
- Wright P. E. & Dyson H. J. Linking folding and binding. Curr. Opin. Struct. Biol. 19, 31–38 (2009). [DOI] [PMC free article] [PubMed] [Google Scholar]
- Tompa P. Intrinsically unstructured proteins. Trends Biochem. Sci. 27, 527–533 (2002). [DOI] [PubMed] [Google Scholar]
- Fuxreiter M., Simon I., Friedrich P. & Tompa P. Preformed structural elements feature in partner recognition by intrinsically unstructured proteins. J. Mol. Biol. 338, 1015–1026 (2004). [DOI] [PubMed] [Google Scholar]
- Iešmantavičius V., Dogan J., Jemth P., Teilum K. & Kjaergaard M. Helical propensity in an intrinsically disordered protein accelerates ligand binding. Angew. Chem. Int. Ed. Engl. 53, 1548–1551 (2014). [DOI] [PubMed] [Google Scholar]
- Iešmantavičius V. et al. Modulation of the intrinsic helix propensity of an intrinsically disordered protein reveals long-range helix-helix interactions. J. Am. Chem. Soc. 135, 10155–10163 (2013). [DOI] [PubMed] [Google Scholar]
- Bruun S. W., Iesmantavicius V., Danielsson J. & Poulsen F. M. Cooperative formation of native-like tertiary contacts in the ensemble of unfolded states of a four-helix protein. Proc. Natl. Acad. Sci. U. S. A. 107, 13306–13311 (2010). [DOI] [PMC free article] [PubMed] [Google Scholar]
- Feuerstein S. et al. Transient structure and SH3 interaction sites in an intrinsically disordered fragment of the hepatitis C virus protein NS5A. J. Mol. Biol. 420, 310–323 (2012). [DOI] [PubMed] [Google Scholar]
- Grzesiek S. & Bax A. An efficient experiment for sequential backbone assignment of medium sized isotopically enriched proteins. J. Magn. Reson. 99, 201–207 (1992). [Google Scholar]
- Grzesiek S. & Bax A. Amino acid type determination in the sequential assignment procedure of uniformly 13C/15N enriched proteins. J. Biomol. NMR 3, 185–204 (1993). [DOI] [PubMed] [Google Scholar]
- Grzesiek S. & Bax A. Improved 3D triple resonance NMR techniques applied to a 31 kDa protein. J. Magn. Reson. 96, 432–440 (1992). [Google Scholar]
- Clubb R. T. Thanabal V. & Wagner G. A constant-time three-dimensional triple-resonance pulse scheme to correlate intraresidue 1HN, 15N, and 13C′ chemical shifts in 15N-13C-labelled proteins. J. Magn. Reson. 97, 213–217 (1992). [Google Scholar]
- Wishart D. S. et al. 1H, 13C and 15N chemical shift referencing in biomolecular NMR. J. Biomol. NMR 6, 135–140 (1995). [DOI] [PubMed] [Google Scholar]
- Delaglio F. et al. NMRPipe: a multidimensional spectral processing system based on UNIX pipes. J. Biomol. NMR. 6, 277–293 (1995). [DOI] [PubMed] [Google Scholar]
- Johnson B. A. & Blevins R. A. NMR View: A computer program for the visualization and analysis of NMR data. J. Biomol. NMR, 4, 603–614 (1994). [DOI] [PubMed] [Google Scholar]
- Zhang H., Neal S. & Wishart D. S. RefDB: a database of uniformly referenced protein chemical shifts. J. Biomol. NMR 25, 173–195 (2003). [DOI] [PubMed] [Google Scholar]
- Provencher S. W. & Glöckner J. Estimation of globular protein secondary structure from circular dichroism. Biochemistry 20, 33–37 (1981). [DOI] [PubMed] [Google Scholar]
- Sreerama N., Venyaminov S. Y. & Woody R. W. Estimation of the number of α-helical and β-strand segments in proteins using circular dichroism spectroscopy. Protein Sci. 8, 370–380 (1999). [DOI] [PMC free article] [PubMed] [Google Scholar]
- Manavalan P. & Johnson W. C. Jr Variable selection method improves the prediction of protein secondary structure from circular dichroism spectra. Anal. Biochem. 167, 76–85 (1987). [DOI] [PubMed] [Google Scholar]
- Deléage G. & Geourjon C. An interactive graphic program for calculating the secondary structure content of proteins from circular dichroism spectrum. Comput. Appl. Biosci. 9, 197–199 (1993). [DOI] [PubMed] [Google Scholar]
- Whitmore L. & Wallace B. A. Protein secondary structure analyses from circular dichroism spectroscopy: methods and reference databases. Biopolymers 89, 392–400 (2008). [DOI] [PubMed] [Google Scholar]


