

Abstract
Metabolic phenotyping of humans allows information to be captured on the interactions between dietary, xenobiotic and other lifestyle and environmental exposures, and genetic variation, which together influence the balance between health and disease risks at both individual and population levels. With recent developments in high-throughput technologies using advanced spectroscopic methods, metabolic profiling is now being applied to large-scale epidemiologic sample collections, including metabolome-wide association (MWA) studies for biomarker discovery and identification. Metabolic profiling at epidemiologic scale requires optimisation of experimental protocol to maximise reproducibility, sensitivity, and quantitative reliability, and to reduce analytic drift. Customised multivariate statistical modelling approaches are essential for effective data visualisation and biomarker discovery (controlled for false positive associations) when hundreds or thousands of complex metabolic spectra are being processed. We describe here the main procedures in large scale metabolic phenotyping and its application to MWA studies, for the discovery of new disease risk biomarkers, diagnostics, and to provide novel insights into etiology, biologic mechanisms and pathways.
Keywords: biomarkers, metabolic phenotyping, metabonomics
Introduction
A variety of multivariate metabolic profiling technologies have recently emerged that have proved extremely powerful for studying disease processes. Non-destructive NMR spectroscopic methods for biofluid sample analysis have been in use since the early 1980's; when combined with pattern recognition approaches, they have proved an efficient means of sample classification and biomarker discovery [1]. Metabonomics is a specific ‘top-down’ systems biology manifestation of metabolic profiling and is defined as ‘the quantitative measurement of the dynamic multiparametric metabolic response of living systems to pathophysiological stimuli or genetic modification’ [2]; this and related metabolomic approaches have been widely applied in disease diagnostics [3,4]. The concept of metabolic phenotyping was first introduced and developed to help explain the biochemical consequences of genetic variation in whole organisms [5,6], but has been extended to include many types of disease modelling, including applications to personalised health care [7-9]. Metabolic phenotyping has emerged as a powerful new approach to augment genomic, proteomic and transcriptomic information, for the capture of biomarker information on a range of toxic and disease processes in animals and man [7].
Until recently, metabonomics and other post-genomic platforms such as proteomics and transcriptomics, have not been suitable for large-scale, high-throughput epidemiologic applications. This has mainly been due to the limited capacity of the analytic platforms for sample throughput and the processing requirements of the enormous amounts of associated data. Improved sample preparation (using automated liquid handling workstations), robotic sample delivery systems, automated data processing and use of multivariate statistical and chemometric methods, with associated reduction in costs, are now realising the potential for metabolic phenotyping in epidemiology.
As an example of the approach, we have been applying metabolic phenotyping to established population studies such as INTERMAP and INTERSALT [10-14]. We have mainly based our analyses on Nuclear Magnetic Resonance (NMR) spectroscopy, since it allows the rapid, untargeted screening of large numbers of specimens without chemical pre-processing. It detects a wide variety of metabolites from dietary, gut microbial and host metabolism sources in one analytical sweep, thus maximizing opportunity for biomarker discovery.
In this review, we discuss some of the specialized algorithms that have been developed to interrogate such data, problems arising and challenges (e.g., false discovery rate, confounding, biologic interpretation). A key issue is metabolite identification, an important bottleneck in metabonomic studies of human populations where ‘unknown’ metabolites are frequently encountered. In addition improved bioinformatic and other approaches are needed to place the putative biomarkers into mechanistic (pathway) context. We emphasize the need for high quality of both the epidemiologic and analytic data, and comprehensive meta-data, to aid interpretation of the weak associations commonly found in epidemiologic settings.
Large Scale Metabolic Profiling
In our proof-of-concept MWA study, we demonstrated the potential of metabolic profiling for the discovery of novel metabolites associated with blood pressure (BP) of individuals [14]. The MWA method shares some of the advantages of genome-wide association studies (GWAS) including high throughput, discovery of novel associations, hypothesis generating; it also shares some of the challenges, e.g., large complex data arrays, and potential for false-positive associations. The metabolic phenotype captures a wide range of exogenous factors (such as diet), adding vastly to the richness of the available data (Figure 1). Prospective epidemiologic studies are now being undertaken in which collection of biofluid specimens for metabonomic investigation is being incorporated at outset in the design and pilot stage, e.g. UK Biobank [15].
Figure 1. Large scale metabonomic screening of human populations. Scores plot for a PCA model derived from the 1H NMR urine data from INTERMAP (n=4,630 participants) colored by population sample.
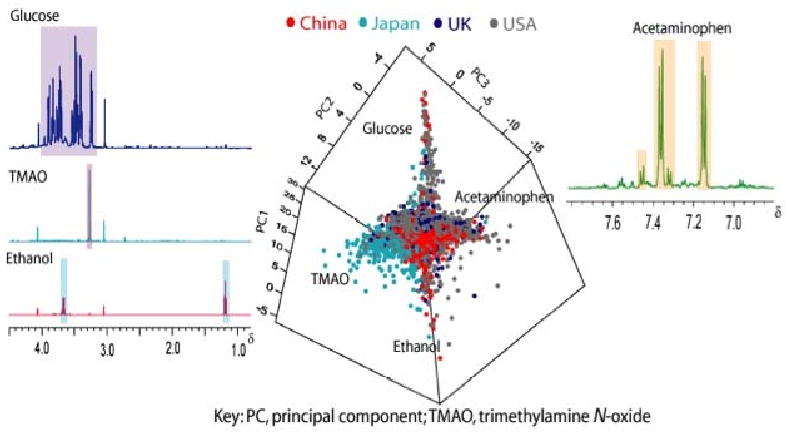
The 1H NMR measurement for a given urine specimen is plotted as a single point. The plot shows four outlying phenotypes based on latent information extracted from the spectral data sets, attributable to high urinary glucose, trimethylamine-N-oxide, ethanol and acetaminophen. Representative spectra of participants with characteristic spectral profiles for these metabolites are also highlighted.
In our MWA demonstration, we analysed urinary specimens from 2 × 24-hour collections from 4,630 people in 17 different population samples from China, Japan, U.K. and U.S.A. [14], obtained in the INTERMAP epidemiologic study of macronutrients, micronutrients, other factors and BP [10]. We modelled geographic variations in their metabolic phenotypes, using multivariate analysis of high-resolution proton-NMR (1H NMR) spectral data. We found extensive variation in metabolic phenotypes at both country and subpopulation level, and identified tens of biomarkers (and potentially many more) that discriminated between groups. These biomarkers derived from four key sources of phenotypic variation: dietary, gut microbiomic, xenometabolomic (e.g., drug use), and host genetic influences [3,14].
We examined four of these discriminating biomarkers in more detail, specifically, alanine (linked to diet), formate (folate-related, one-carbon metabolism and starch breakdown by gut microbes), N-methylnicotinamide (diet), and hippurate (diet and microbiome activity). We quantified individual 24 hr urinary excretion of these variables, increasing precision by averaging over the two 24 hr urinary collections obtained some 3-6 weeks apart, and investigated their association with individual BP levels using standard multiple regression. The strongest association was with urinary formate excretion which was inversely related to BP of individuals. Formate is closely involved in Cl–exchange in the kidney via the CFEX transporter, which itself is related to a complex series of SLC26 anion exchangers that handle renal ion balance, including Na+ and Cl−, and it is possible that other interacting ionic transport activities are also involved. Thus the MWA-generated putative biomarker (formate) is connected by a complex physiological chain to factors (including salt handling) that are plausibly linked to BP regulation.
Overview of Sample Collection, Preparation & Storage
Biological fluids are rich in a wide range of molecules such as proteins, lipids and small molecular weight metabolites. Blood samples are the most commonly collected biological fluid in an epidemiologic setting, providing a representation of the global ‘metabonome’ at the time of collection. Since many variables are under tight homeostatic control, the extent of variation in blood metabolite concentration may be limited. Obtaining blood products, plasma and serum, requires careful collection and handling, e.g., fractionation of whole blood into its constituent parts, prior to storage and analysis. Because of diurnal variation, both physiologic and e.g., related to timing of meals, blood specimens may need to be collected at specified times and/or fasted, and multiple sampling may be needed to quantify intra-individual variation and increase precision [16].
Urine collection offers a low cost alternative (or complementary) biological sampling strategy to blood; it has the advantage of providing a time-averaged pattern of the end products of metabolism as well as capturing the excretion of exogenous compounds such as dietary constituents and drugs. A 24-hour urine collection is the preferred method as this captures the cumulative metabolite excretion over an entire day, and therefore will not be influenced by diurnal variation. However, in many epidemiologic settings, obtaining a 24-hour collection is infeasible, and either ‘spot’ or overnight urine specimens may be obtained. Again, repeated collections will increase precision [10,11] and allow better characterisation of the metabolic “space” occupied by a particular individual [12]. Other biological specimens that can readily be obtained in an epidemiologic setting (e.g. saliva, breath condensate, buccal and nasal epithelia) are also amenable to metabonomic analysis, though the collection, storage and processing of these specimens are less established than for blood and urine.
Recent reviews [17-19] and feasibility studies [20] have evaluated methods for sample collection, processing and banking of biofluid specimens for molecular epidemiologic studies. A key factor is to minimise artefacts and bias that may be introduced from inappropriate sampling, handling and storage, requiring the use of and strict adherence to standardised protocols and operating procedures. Ideally, the following information will be recorded: time and location of collection; size and characteristics of collection containers; sample volume; any mixing or aliquoting techniques (e.g., from 24-hour urine collection [21]); addition and quantity of any included stabilising agents or anticoagulants; immediate storage conditions; temperature measurement and time at that temperature; details of any processing or extraction protocols, e.g., serum from blood collections; number and size of aliquots (including details of containers); storage conditions, temperature and duration for transportation to a central laboratory; processing time and conditions (including temperature) at the laboratory, and time from collection to cryopreservation of stored samples.
The impact of storage (and freeze-thaw) on the integrity of the samples will depend on the extent to which metabolite concentrations vary over time, and the impact on assay accuracy and precision of analysing stored compared to fresh samples. Analytic methods that have been adopted for metabolic profiling include, but are not limited, to NMR spectroscopy and mass spectrometry (MS) with liquid, electrophoretic or gas phase chromatographic separation [22-26] The effect of storage conditions on sample integrity has been investigated for 1H NMR urine metabolomes [27-28], 1H NMR blood serum and plasma metabolomes [16] and gas chromatography mass spectroscopy (GC-MS) urine and serum metabolomes [29]. These studies indicate that variations associated with handling and storage of the biofluid specimens for both NMR and GC-MS are small compared to inter- and intra-individual variability (based on strict protocols for collection, handling, transport and storage of specimens), and differences introduced by a single freeze-thaw cycle are also reported to be small [16]. To minimize the potential physical and chemical changes associated with thawing and re-freezing, the collected specimen should be divided into multiple aliquots to reduce the number of freeze-thaw cycles [15].
UK Biobank undertook a detailed pilot of its sample handling and storage procedures [20]; it was concluded that the UK Biobank sample collection, transport and fractionation protocols, involving the maintenance of plasma, serum and urine samples at 4°C for 24 hours and well-controlled transport prior to long-term cryopreservation, were suitable for high-resolution metabonomic studies [29,30]. More generally, expert panels have been established to help standardise the analysis and reporting of metabonomic data, including the Standard Metabonomic Reporting Structure, SMRS [31] and the Metabolomics Standards Initiative, MSI [32].
Sample Analysis: Analytical Instrumentation & Methods
Metabolic profiling has to accommodate the vast chemical diversity and concentrations of metabolites present in biofluids. No single analytical method is capable of obtaining a complete molecular fingerprint of the collected biofluid specimen. In our MWA studies, 1H NMR provided the most viable way to obtain untargeted metabolic profiles for large numbers of people at reasonable cost [14]. The sample set of 10,143 INTERMAP urine specimens was profiled at a rate of over one hundred samples per instrument per day; higher throughput rates are now possible with cryogenic and flow injection systems.
With 1H NMR, there is under-representation of metabolites at low concentrations that can be identified and quantified. More sensitive MS methods that give good coverage of metabolites in terms of chemical class and concentration range, provide a complementary approach. For MS platforms, although some automation is available, the added sample preparation time including chromatographic separation has limited their wider utility in epidemiology. This is changing with new developments such as ultra-performance liquid-chromatography −MS systems, which, relative to high-performance liquid-chromatography (HP-LC), have higher chromatographic retention and sensitivity, decreased experimental time and reagent costs, and improved spectral information content. Metabolic profiling by MS can use either a holistic or untargeted strategy, or a targeted strategy (Table 1). While choice of analytic platform and strategy will depend on the specific hypotheses under study, it is becoming practice to integrate the data obtained from multiple platforms (including NMR), as this gives the most comprehensive molecular fingerprint of collected biofluids [33-35].
Table 1. Advantages and disadvantages of the main analytic strategies in metabonomic research.
| Strategy/Platform | Advantages | Disadvantages |
|---|---|---|
| Untargeted | ||
| NMR Spectroscopy | Comprehensive generation of metabolite profiles by a single non-destructive method | Relative insensitivity (>low uM) |
| Fully automated with high-throughput capacity | ||
| Mathematical and statistical tool box are well established | Complexity for biofluids (e.g. serum) in terms of overlapping spectral signals requires the collection of extra data by a range of sophisticated spectral editing pulse sequences | |
| Excellent for metabolite structure elucidation | ||
| Very high analytical reproducibility | Validity is dependent upon quality of sample collection, handling and the available metadata | |
| Mass Spectrometry (hyphenated with chromatographic separation) | Broad coverage of metabolites of concentration > pM | Software and algorithms for routine data analysis are relatively more complex |
| Requires small sample volumes (low μl) | Time consuming relative to untargeted NMR | |
| Separation by chromatography enables metabolites to be individually identified and quantified | Poor representation of highly polar metabolites when using standard chromatography protocols | |
| Relatively lower analytic reproducibility | ||
| Relatively easily automated and suitable for use in a high-throughput mode | Expensive consumables | |
| Targeted | ||
| NMR spectroscopy | Technique is non-destructive hence sub-profiling of molecular classes using spectral editing parameters | Software and algorithms for reliable automated quantitation are needed |
| In combination with spectral editing and appropriate standards metabolites are easily individually detected and quantified | ||
| MS Spectrometry (hyphenated with chromatographic separation) | Separation by chromatography enables metabolites to be individually identified and quantified | Optimisation of separation methods for each class of metabolites is necessary |
| Reduced universality of metabolite detection Quantification is dependent on a labelled and unlabeled internal standard subject to availability |
||
It is essential that the analytic platforms used remain stable, and that any analytic drift is quantified and compensated for to reduce systematic differences over time and minimize bias [12,36]. The coefficient of variation associated with inter- and intra-laboratory 1H spectroscopic NMR experimentation is typically ∼5% [12]. With GC-MS, this figure is ∼8% for plant extracts [37], although these are intrinsically less variable than human biofluids. Quality control (QC) must be incorporated into the experimental design. Typically blank samples (water or buffer) are interspersed in each well plate to ensure that there is minimal cross-contamination from the automated liquid-handlers. In addition aliquots of QC samples that are prepared at outset should be included in each run to allow assessment of instrumental and biological reproducibility over the study duration. The QC samples should be representative of the study samples, and preferably comprise pooled aliquots of the original samples [12]. For example, in INTERMAP, 144 QC samples were repeatedly analysed over the duration of the metabonomics study, with coefficients of variation < 5% [12]. A further QC assessment was made using duplicate samples, which were split at source in the field and hidden within a >10 fold greater population. For MS analysis, there is a greater propensity for analytic drift because of the stability of the chromatographic columns [38,39].
Data Processing and Analysis
Table 2 lists some of the factors affecting the human metabolic profile. Latent information from the metabolic spectral profiles is extracted using multivariate statistical methods. The analysis must be able to deal with data matrices which are very large; highly correlated variables; some degree of missing data; and multi-dimensional data, including changes over time.
Table 2. An overview of factors affecting the human metabolic profile.
| STUDIES | REFERENCES |
|---|---|
| Genetic | |
| Gender effects | Kochhar et al. 2006 [63]; Psihogios et al. 2008 [64]; Slupsky et al. 2007[65] |
| Ethnicity | Lenz et al. 2004 [66] |
| Population characterisation | Assfalg et al. 2008[67]; Dumas et al. 2006 [12]; Lenz et al. 2003[22]; Jonsson et al. 2005 [13] |
| Environmental | |
| Diurnal variation | Slupsky et al. 2007 [65] |
| Age | Psihogios et al. 2008 [64]; Slupsky et al. 2007 [65] |
| BMI | Kochhar et al. 2006 [63] |
| Diet | Rezzi et al. 2007 [68]; Stella et al. 2006 [69]; Lenz et al. 2004 [66] |
| MWA | Holmes et al. 2008 [14] |
The large scale and richness of phenotypic and other data obtained in many epidemiologic studies add an extra layer of complexity. Methods which have worked well with smaller-scale metabolic profiling experiments may not translate adequately to hundreds or thousands of samples, without instrumental modifications and data processing revisions. In addition, techniques proven in highly controlled experiments in laboratory animals may be compromised when faced with uncontrolled human studies of free-living individuals, e.g., overlap of drug/diet/disease related peaks with endogenous metabolite signals; day-to-day variability in dietary and other exposures; presence of confounders.
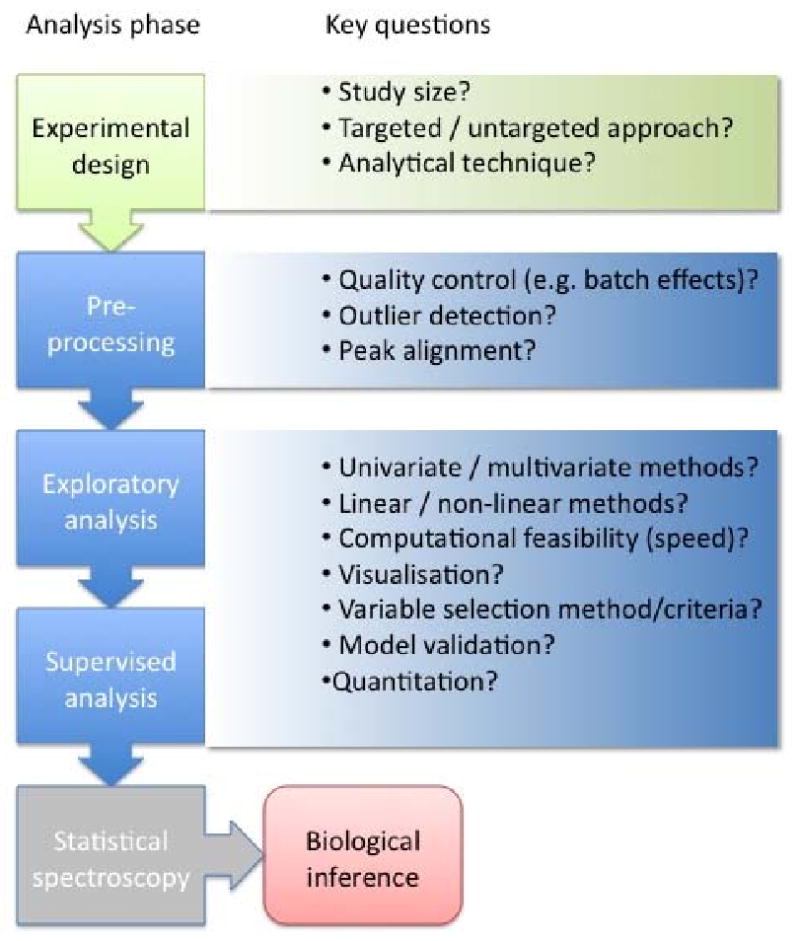
Figure 2 gives an overview of the data analysis workflow and salient questions which must be considered. The first and perhaps most important step in the data analysis is pre-processing, e.g. phasing, baseline correction and chemical shift referencing in NMR; background correction and retention time correction in MS. The best approach will depend on whether a targeted or global profiling strategy has been adopted. Most instrument vendors provide their own software for pre-processing but this is not always adequate in automatic mode. There are also many publicly available pre-processing tools, especially for MS data [40-43].
Figure 2. Flow chart of the data pre-processing and data analysis strategy for large-scale population studies.
A decision has to be made whether to analyse the raw spectral profiles or to perform peak detection and matching. The latter is the standard approach in MS applications where the raw data are extremely large and sparse. Targeted profiling is only possible if the analyte signals can be automatically assigned to a known metabolite. This is typically routine in GC-MS where reproducible retention times and fragmentation patterns allow accurate database searching. In contrast, LC-MS profiles contain sample-to-sample variations in peak positions as well as variable extent of adduct and dimer formation which means that unambiguous assignment from database searches is currently impossible. For NMR, some automatic and semi-automatic methods for targeted profiling are available [44-46] and have been used on a small number of metabolites in large-scale studies [14]. However, automated identification and quantification is complicated by the large number of peaks, overlap and small but non-trivial shifts in peak positions. At present there does not seem to be an ideal solution for comprehensive targeted analysis in large-scale studies.
If biomarker discovery is the primary goal, there is a strong argument for an untargeted approach in which the analysis of the unannotated (peak-picked or full profile) data is performed. Metabolite identification can then be done for a small number of discriminatory peaks, though this is costly and time-consuming. In some cases it may be beneficial to ‘bin’ the raw profiles to a lower resolution than the raw data [47]; this can simplify data analysis especially when there are large numbers of samples. A complication of peak picking methods for all analytic platforms is the dependence on algorithm parameters. Ideally these should be optimised on a representative subset of samples which include an extensive array of spiked-in standard compounds at known concentrations; this is an expensive but potentially important step in obtaining meaningful results. Additionally, it is extremely important to employ (semi)automatic methods for outlier visualisation, detection and removal since in epidemiologic applications especially, it is infeasible to check all spectra manually. The output of the pre-processing stage is a data table with rows corresponding to individual samples, and columns corresponding to metabolic variables (metabolites, peaks or spectral regions).
Once the basic data table is produced, some exploratory analysis is carried out before moving on to classification or regression modelling. The methods used do not depend greatly on the study objective (case/control discrimination, analysis of continuous variables, etc.) as the goal is to provide a global overview of the data, identifying outliers and the main sources of variation. Typical approaches include multivariate projection methods such as Principal Components Analysis (PCA), which produce intuitive 2 or 3 dimensional maps of the whole data set. Such multivariate methods are generally preferred for several reasons:
The use of all variables simultaneously increases power to detect differences between groups, e.g., gender, country, case-control status, or associations with continuous variables, e.g., blood pressure, body mass index.
Correlations between variables are made explicit, allowing estimation of the number of independent effects in the data. This is important, as metabolite peaks may be correlated, either because they represent multiple signals from the same molecule, or because of shared source or metabolic pathways.
They are predictive, allowing results for new samples to be compared with those used to build the model, for validation purposes.
Multivariate methods usually enable intuitive visualisation in which groups and trends can be identified. The high degree of complexity generated by variation of thousands of variables can be summarised in a relatively simple and intuitive fashion without a requirement to study many different plots or tables.
Outliers can be identified both visually in plots and more rigorously using multivariate statistical tests such as Hotelling's T2 [48].
A particular advantage of projection methods in large studies is that they are fast, enabling hundreds or thousands of individual profiles to be modelled rapidly on a standard desktop computer.
Other methods such as self organising maps and multidimensional scaling are available but, in our opinion, do not offer all the advantages exhibited by projection techniques such as PCA for exploratory analysis.
The next step in the analysis workflow will typically be an attempt to determine which metabolic signals are associated with the phenotype of interest, e.g., through case-control comparisons or regression on continuous variables. For this purpose multivariate classification and regression methods are used, and particularly for large studies, projection methods based on Partial Least Squares (PLS) regression. PLS, like PCA is a multivariate projection method with all the associated advantages, and can be used to investigate relationships with continuous variables, or in discriminant analysis (PLS-DA) mode where the response variable codifies class membership (0 or 1). Orthogonal PLS (O-PLS and O2-PLS) [49,50] is a development of the PLS algorithm that models variation orthogonal and parallel to the response separately, resulting in models that are equally predictive but easier to interpret than conventional PLS. This approach was adopted in the INTERMAP MWA study [14]. As with any multivariate approach, statistical validation by assessing predictive performance on a ‘test’ set of data not used to fit the model is extremely important, and indicates robustness to perturbations in the data, and whether conclusions drawn are likely to be valid for future data sets. As with GWAS, replication in different studies/cohorts will additionally be needed to confirm findings arising from these discovery approaches.
As with any post-genomic biomarker discovery program, it is crucial to control the type I error rate and limit the number of false positive associations [51], assessed for example by the false discovery rate, FDR (the proportion of variables labelled significant which are not truly associated with the phenotype). The myriad of proposed algorithms for estimation and control of the FDR or similar statistics have not yet been widely applied in the field of metabolic profiling. For the PLS family of methods, there is currently no accepted optimal method for determination of variables significantly associated with the response, or to determine appropriate significance thresholds.
In our recent MWA studies [14], we followed Martens et al. [52] by applying a simple bootstrap procedure to estimate empirical p-values for each variable in an O-PLS-DA model. In addition, for each bootstrap iteration, variables were ranked according to p-value and the median and 95% confidence interval of ranks across all iterations computed to give an indication of the variability in the resulting ranks. A variable was considered ‘discriminatory’ if it had a) p-value below a Bonferroni corrected significance threshold based on the total number of variables, b) median rank in the top 5% and c) width of the confidence interval of the rank in the bottom 5%. We note that the Bonferroni correction applied in our study – based on all 7,100 spectral variables – was conservative given the degree of correlation between spectral intensities; the problem is analogous to correcting for the number of independent tests due to LD structure among SNPs [53]. In the INTERMAP study, since each individual collected two 24-hour urine specimens, it was possible to further specify that the above three criteria should be met for both specimens, increasing the likelihood that the observed metabolite-phenotype associations were ‘real’.
In general, with hundreds or thousands of samples, there may be a ‘crisis of interpretation’ as many tens or hundreds of variables may appear to contribute significantly to the models, even with Bonferroni correction. Some significant findings may result from low-level systematic biases in the sample collection and handling or analytic procedures, which may only become apparent because of the large sample size, underscoring the need for stringent quality control of the experimental procedures. Applying strict multiple criteria for biomarker identification [14] will limit the numbers of ‘discriminatory’ variables, reduce the false discovery rate. Discriminatory metabolites may then need to be structurally identified, placed in biologic context, and the findings replicated in other samples.
As with other epidemiologic analyses, the presence of highly inter-correlated variables and confounding are key challenges. In conventional regression analyses, confounders are entered into the models as covariates, and the ‘independent’ effects of a limited number of potential explanatory variables are estimated. However, with 100s or 1000s of metabolic predictor variables, there is no consensus on the optimal methods for estimating metabolite-phenotype associations independent of confounders. One approach is to pre-treat the predictor data by vastly reducing its dimensionality (e.g., by quantifying the levels of a short list of metabolites) and then to use conventional multiple regression with adjustment for confounders [14]; another is to use unsupervised dimension reduction techniques such as PCA, which in combining the contributions of many individual variables can complicate model interpretation. Orthogonal filtration methods such as O-PLS may have a role to play here, though as yet their impact on this problem has not been fully realised.
A further important issue in epidemiology is the quest for absolute rather than relative quantitation (i.e., fold-differences) of metabolite concentrations. In the discovery stage, absolute quantitation may not be necessary, and may be complicated by e.g., completeness of urine collections. If absolute rather than relative quantitation is required at outset, then this requires greater investment of time, quality control, and complexity in the chemical and data analytic procedures, and may be especially difficult where spectral peaks are overlapped. NMR is inherently more quantitative than MS. For NMR, fully relaxed spectra are required along with an internal standard or eretic (Electronic REference To access In vivo Concentrations) of known concentration [54]. However, relaxation is compound dependent and thus difficult to predict unless a targeted approach is taken. For MS, stable isotope labelled standards are required for quantitation, implying a targeted rather than untargeted (discovery) approach, and an increase in costs. Algorithms and software face the same challenges for relative or absolute methods – e.g., peak detection and separation, positional shifts, baseline corrections – but the requirements for data quality are more stringent in absolute quantitation. A pragmatic strategy may be to profile mainly with an untargeted approach and relative quantitation initially (i.e., for discovery) and follow up any putative biomarkers with a targeted strategy (perhaps on a smaller sample set, and possibly with a different analytic method).
With a bewildering array of computational methods to choose from, what is the most appropriate data analysis strategy? The workflow illustrated in Figure 2 highlights some key points to consider at each stage. The importance of considering the data analysis at the experimental design stage cannot be over-emphasised. Many of the issues result from the large size of epidemiologic datasets which render conventional approaches difficult or infeasible. In Holmes et al.[14], seven components were required to explain 81% of the variance in the NMR metabolic profiles of 4,630 participants. Even this relatively small number of components results in 21 possible pair-wise score plots for visualisation. In some instances, nonlinear methods, such as self organising maps [55] or multidimensional scaling [56] may be able to capture more of the variation within a simple 2-dimensional visualisation. In others, the choice of method may be influenced by the size of association relative to confounding variation. For example, large metabolic effects such as toxicity dominate the data structure and are often easily seen in unsupervised analysis such as PCA, while more subtle effects such as subclinical pathology may require a supervised approach (such as PLS) to reveal them. The typically weak associations found in many epidemiologic applications mean that replication in other datasets will often be needed. Overall, there is no optimal strategy suitable for all experimental designs and project goals. The choice of methodology requires a high degree of communication between data analysts, epidemiologists and analytical scientists from the outset of the project.
Metabolite Identification, Biologic Interpretation, Clinical Validation & Application
In addition to the choice of analytic platforms and statistical methods, metabolite identification, biologic interpretation and clinical validation are key components of human metabonomic studies. The sensitivity of metabolic profiles to unknown or unmeasurable factors introduces a degree of complexity that can hamper the validation and wider utility of identified metabolic signatures. Thus the structural identification of discriminatory metabolites is essential. Assignment of an individual metabolite is both time consuming and technically challenging, because of the diverse chemistries present, fluctuating nature of the metabolome in response to environmental stressors and the lack of well-annotated metabolite databases. The MSI group [32] have proposed various levels of identification ranging from completely unidentified signals, putative assignment based on spectral similarity, reported literature and public databases (Human Metabolome Data Base, HMDB), to experimentally identified metabolites by either structural elucidation from experimental (e.g. 2D-NMR or MS-MS) and/or statistical (e.g. statistical total correlation spectroscopy, STOCSY [57]) approaches. There is no single method of structural characterisation. Hence this step is not readily automated, requiring experienced spectroscopists, and can pose a significant bottleneck for metabolic profiling of large-scale population studies.
Epidemiologic studies to date have largely focused on one or other of the -omic platforms, but recent studies such as MOLPAGE are working towards collating multiple measures from a range of -omic platforms [33, 58-62]. This has led to attempts to integrate the various -omic datasets that describe different levels of biologic organisation, to improve mechanistic understanding of the biologic processes at hand. It is anticipated that such integration approaches may contribute to deciphering the biologic relevance of metabolite signatures emerging from metbaonomic analyses. Furthermore, public pathway resources such as Kegg and Pathvisio are useful for exploring the link between identified metabolites and functional and regulatory processes within known metabolic pathways.
Summary
Recent technological advances in automation, improved robustness and sensitivity coupled with highly developed mathematical approaches for data alignment, filtering extraneous variation, and statistical correlation spectroscopy algorithms, have made possible the scaling up of metabolic profiling techniques to epidemiologic applications. Box 1 summarises some of the main issues in the application of metabonomics to epidemiology. The comprehensive metabolic profiles/phenotypes generated capture latent information on the interactions between lifestyle and environmental exposures, and genetic variation, that influence the balance between health and disease risks at both individual and population levels [14].
Box 1. Some issues in the application of metabolic phenotyping in epidemiology.
Preparation for downstream metabonomic analyses at the study design stage so that metabonomics is fully integrated into the project.
High levels of quality control and uniformity in sampling strategies and handling. This is especially important for multi-site studies.
Pilot investigation to ensure sample and storage procedures are fit for purpose.
Both targeted and untargeted approaches for the generation and testing of hypotheses in epidemiologic data.
Ability to combine datasets from a range of analytic techniques that cover a comprehensive class of chemical entities and concentration ranges.
Improved automated methods for metabolite identification and quantitation
Development of common data analysis and statistical approaches between the ‘-omic’ technologies applied to epidemiologic data
Footnotes
Statement of conflict of interest: The authors declare that they have no competing interests.
Publisher's Disclaimer: This is a PDF file of an unedited manuscript that has been accepted for publication. As a service to our customers we are providing this early version of the manuscript. The manuscript will undergo copyediting, typesetting, and review of the resulting proof before it is published in its final citable form. Please note that during the production process errors may be discovered which could affect the content, and all legal disclaimers that apply to the journal pertain.
References
- 1.Nicholson JK, Wilson I. High resolution proton magnetic resonance spectroscopy of biological fluids. Prog NMR Spect. 1989;21:449–501. [Google Scholar]
- 2.Nicholson JK, Lindon JC, Holmes E. ‘Metabonomics’: understanding the metabolic responses of living systems to pathophysiological stimuli via multivariate statistical analysis of biological NMR spectroscopic data. Xenobiotica. 1999;29(11):1181–9. doi: 10.1080/004982599238047. [DOI] [PubMed] [Google Scholar]
- 3.Nicholson JK, Connelly J, Lindon JC, Holmes E. Metabonomics: a platform for studying drug toxicity and gene function. Nat Rev Drug Discov. 2002;1(2):153–61. doi: 10.1038/nrd728. [DOI] [PubMed] [Google Scholar]
- 4.Nicholson JK, Lindon JC. Systems biology: Metabonomics. Nature. 2008;455(7216):1054–6. doi: 10.1038/4551054a. [DOI] [PubMed] [Google Scholar]
- 5.Gavaghan McKee CL, Holmes E, Lenz E, Wilson ID, Nicholson JK. An NMR-based metabonomic approach to investigate the biochemical consequences of genetic strain differences: application to the C57BL10J and Alpk:ApfCD mouse. FEBS Lett. 2000;484(3):169–74. doi: 10.1016/s0014-5793(00)02147-5. [DOI] [PubMed] [Google Scholar]
- 6.Gavaghan McKee CL, Wilson ID, Nicholson JK. Metabolic phenotyping of nude and normal (Alpk:ApfCD, C57BL10J) mice. J Proteome Res. 2006;5(2):378–84. doi: 10.1021/pr050255h. [DOI] [PubMed] [Google Scholar]
- 7.Holmes E, Wilson ID, Nicholson JK. Metabolic phenotyping in health and disease. Cell. 2008;134(5):714–7. doi: 10.1016/j.cell.2008.08.026. [DOI] [PubMed] [Google Scholar]
- 8.Clayton TA, Lindon JC, Everett JR, Charuel C, Hanton G, Le Net JL, Provost JP, Nicholson JK. Pharmaco-metabonomic phenotyping and personalized drug treatment. Nature. 2006;440(7087):1073–7. doi: 10.1038/nature04648. [DOI] [PubMed] [Google Scholar]
- 9.Rezzi S, Martin FP, Kochhar S. Defining personal nutrition and metabolic health through metabonomics. Ernst Schering Found Symp Proc. 2007;4:251–64. doi: 10.1007/2789_2008_097. [DOI] [PubMed] [Google Scholar]
- 10.Stamler J, Elliott P, Dennis B, Dyer AR, Kesteloot H, Liu K, Ueshima H, Zhou BF, INTERMAP Research Group INTERMAP: background, aims, design, methods, and descriptive statistics (nondietary) J Hum Hypertens. 2003;17(9):591–608. doi: 10.1038/sj.jhh.1001603. [DOI] [PMC free article] [PubMed] [Google Scholar]
- 11.The INTERSALT Co-operative Research Group. Sodium, potassium, body mass, alcohol and blood pressure: the INTERSALT Study. J Hypertens Suppl. 1988;6(4):S584–6. [PubMed] [Google Scholar]
- 12.Dumas ME, Maibaum EC, Teague C, Ueshima H, Zhou B, Lindon JC, Nicholson JK, Stamler J, Elliott P, Chan Q, Holmes E. Assessment of analytical reproducibility of 1H NMR spectroscopy based metabonomics for large-scale epidemiological research: the INTERMAP Study. Anal Chem. 2006;78(7):2199–208. doi: 10.1021/ac0517085. [DOI] [PMC free article] [PubMed] [Google Scholar]
- 13.Jonsson P, Bruce SJ, Moritz T, Trygg J, Sjöström M, Plumb R, Granger J, Maibaum E, Nicholson JK, Holmes E, Antti H. Extraction, interpretation and validation of information for comparing samples in metabolic LC/MS data sets. Analyst. 2005;130(5):701–7. doi: 10.1039/b501890k. [DOI] [PMC free article] [PubMed] [Google Scholar]
- 14.Holmes E, Loo RL, Stamler J, Bictash M, Yap IK, Chan Q, Ebbels T, De Iorio M, Brown IJ, Veselkov KA, Daviglus ML, Kesteloot H, Ueshima H, Zhao L, Nicholson JK, Elliott P. Human metabolic phenotype diversity and its association with diet and blood pressure. Nature. 2008;453(7193):396–400. doi: 10.1038/nature06882. [DOI] [PMC free article] [PubMed] [Google Scholar]
- 15.Elliott P, Peakman TC. The UK Biobank sample handling and storage protocol for the collection, processing and archiving of human blood and urine. Int J Epidemiol. 2008;37(2):234–44. doi: 10.1093/ije/dym276. [DOI] [PubMed] [Google Scholar]
- 16.Teahan O, Gamble S, Holmes E, Waxman J, Nicholson JK, Bevan C, Keun HC. Impact of analytical bias in metabonomic studies of human blood serum and plasma. Anal Chem. 2006;78(13):4307–18. doi: 10.1021/ac051972y. [DOI] [PubMed] [Google Scholar]
- 17.Holland NT, Pfleger L, Berger E, Ho A, Bastaki M. Molecular epidemiology biomarkers--sample collection and processing considerations. Toxicol Appl Pharmacol. 2005;206(2):261–8. doi: 10.1016/j.taap.2004.10.024. [DOI] [PubMed] [Google Scholar]
- 18.Holland NT, Smith MT, Eskenazi B, Bastaki M. Biological sample collection and processing for molecular epidemiological studies. Mutat Res. 2003;543(3):217–34. doi: 10.1016/s1383-5742(02)00090-x. [DOI] [PubMed] [Google Scholar]
- 19.Wild CP, Andersson C, O'Brien NM, Wilson L, Woods JA. A critical evaluation of the application of biomarkers in epidemiological studies on diet and health. Br J Nutr. 2001;86(1):S37–53. doi: 10.1079/bjn2001338. [DOI] [PubMed] [Google Scholar]
- 20.Peakman TC, Elliott P. The UK Biobank sample handling and storage validation studies. Int J Epidemiol. 2008;37(1):i2–6. doi: 10.1093/ije/dyn019. [DOI] [PubMed] [Google Scholar]
- 21.Elliott P, Stamler R. Manual of operations for “INTERSALT”, an international cooperative study on the relation of sodium and potassium to blood pressure. Control Clin Trials. 1988;9(2 Suppl):1S–117S. [PubMed] [Google Scholar]
- 22.Lenz EM, Bright J, Wilson ID, Morgan SR, Nash AF. A 1H NMR-based metabonomic study of urine and plasma samples obtained from healthy human subjects. J Pharm Biomed Anal. 2003;33(5):1103–15. doi: 10.1016/s0731-7085(03)00410-2. [DOI] [PubMed] [Google Scholar]
- 23.Robertson DG, Reily MD, Sigler RE, Wells DF, Paterson DA, Braden TK. Metabonomics: evaluation of nuclear magnetic resonance (NMR) and pattern recognition technology for rapid in vivo screening of liver and kidney toxicants. Toxicol Sci. 2000;57(2):326–37. doi: 10.1093/toxsci/57.2.326. [DOI] [PubMed] [Google Scholar]
- 24.Bruce SJ, Jonsson P, Antti H, Cloarec O, Trygg J, Marklund SL, Moritz T. Evaluation of a protocol for metabolic profiling studies on human blood plasma by combined ultra-performance liquid chromatography/mass spectrometry: From extraction to data analysis. Anal Biochem. 2008;372(2):237–49. doi: 10.1016/j.ab.2007.09.037. [DOI] [PubMed] [Google Scholar]
- 25.Pasikanti KK, Ho PC, Chan EC. Development and validation of a gas chromatography/mass spectrometry metabonomic platform for the global profiling of urinary metabolites. Rapid Commun Mass Spectrom. 2008;22(19):2984–92. doi: 10.1002/rcm.3699. [DOI] [PubMed] [Google Scholar]
- 26.Want EJ, Cravatt BF, Siuzdak G. The expanding role of mass spectrometry in metabolite profiling and characterization. Chembiochem. 2005;6(11):1941–51. doi: 10.1002/cbic.200500151. [DOI] [PubMed] [Google Scholar]
- 27.Lauridsen M, Hansen SH, Jaroszewski JW, Cornett C. Human urine as test material in 1H NMR-based metabonomics: recommendations for sample preparation and storage. Anal Chem. 2007;79(3):1181–6. doi: 10.1021/ac061354x. [DOI] [PubMed] [Google Scholar]
- 28.Maher AD, Zirah SF, Holmes E, Nicholson JK. Experimental and analytical variation in human urine in 1H NMR spectroscopy-based metabolic phenotyping studies. Anal Chem. 2007;79(14):5204–11. doi: 10.1021/ac070212f. [DOI] [PubMed] [Google Scholar]
- 29.Dunn WB, Broadhurst D, Ellis DI, Brown M, Halsall A, O'Hagan S, Spasic I, Tseng A, Kell DB. A GC-TOF-MS study of the stability of serum and urine metabolomes during the UK Biobank sample collection and preparation protocols. Int J Epidemiol. 2008;37(1):i23–30. doi: 10.1093/ije/dym281. [DOI] [PubMed] [Google Scholar]
- 30.Barton RH, Nicholson JK, Elliott P, Holmes E. High-throughput 1H NMR-based metabolic analysis of human serum and urine for large-scale epidemiological studies: validation study. Int J Epidemiol. 2008;37(1):i31–40. doi: 10.1093/ije/dym284. [DOI] [PubMed] [Google Scholar]
- 31.Lindon JC, Nicholson JK, Holmes E, Keun HC, Craig A, Pearce JT, et al. Summary recommendations for standardization and reporting of metabolic analyses. Nat Biotechnol. 2005;23(7):833–8. doi: 10.1038/nbt0705-833. [DOI] [PubMed] [Google Scholar]
- 32.Sansone SA, Fan T, Goodacre R, Griffin JL, Hardy NW, Kaddurah-Daouk R, et al. The metabolomics standards initiative. Nat Biotechnol. 2007;25(8):846–8. doi: 10.1038/nbt0807-846b. [DOI] [PubMed] [Google Scholar]
- 33.Crockford DJ, Holmes E, Lindon JC, Plumb RS, Zirah S, Bruce SJ, et al. Statistical heterospectroscopy, an approach to the integrated analysis of NMR and UPLC-MS data sets: application in metabonomic toxicology studies. Anal Chem. 2006;78(2):363–71. doi: 10.1021/ac051444m. [DOI] [PubMed] [Google Scholar]
- 34.Wagner S, Scholz K, Sieber M, Kellert M, Voelkel W. Tools in metabonomics: an integrated validation approach for LC-MS metabolic profiling of mercapturic acids in human urine. Anal Chem. 2007;79(7):2918–26. doi: 10.1021/ac062153w. [DOI] [PubMed] [Google Scholar]
- 35.Zurek G, Godejohann M, Schafer H, Fischer C, Neidig P, Han D, Lee E, Spraul M. P119-M Combined Analysis of Urine Samples using NMR and LC/MS. J Biomol Tech. 2007;18(1):42. [Google Scholar]
- 36.Keun HC, Ebbels TM, Antti H, Bollard ME, Beckonert O, Schlotterbeck G, et al. Analytical reproducibility in (1)H NMR-based metabonomic urinalysis. Chem Res Toxicol. 2002;15(11):1380–6. doi: 10.1021/tx0255774. [DOI] [PubMed] [Google Scholar]
- 37.Fiehn O, Kopka J, Dörmann P, Altmann T, Trethewey RN, Willmitzer L. Metabolite profiling for plant functional genomics. Nat Biotechnol. 2000;18(11):1157–61. doi: 10.1038/81137. [DOI] [PubMed] [Google Scholar]
- 38.Gika HG, Theodoridis GA, Wingate JE, Wilson ID. Within-day reproducibility of an HPLC-MS-based method for metabonomic analysis: application to human urine. J Proteome Res. 2007;6(8):3291–303. doi: 10.1021/pr070183p. [DOI] [PubMed] [Google Scholar]
- 39.Sangster T, Major H, Plumb R, Wilson AJ, Wilson ID. A pragmatic and readily implemented quality control strategy for HPLC-MS and GC-MS-based metabonomic analysis. Analyst. 2006;131(10):1075–8. doi: 10.1039/b604498k. [DOI] [PubMed] [Google Scholar]
- 40.Smith CA, Want EJ, O'Maille G, Abagyan R, Siuzdak G. XCMS: processing mass spectrometry data for metabolite profiling using nonlinear peak alignment, matching, and identification. Anal Chem. 2006;78(3):779–87. doi: 10.1021/ac051437y. [DOI] [PubMed] [Google Scholar]
- 41.Katajamaa M, Miettinen J, Oresic M. MZmine: toolbox for processing and visualization of mass spectrometry based molecular profile data. Bioinformatics. 2006;22(5):634–6. doi: 10.1093/bioinformatics/btk039. [DOI] [PubMed] [Google Scholar]
- 42.Baran R, Kochi H, Saito N, Suematsu M, Soga T, Nishioka T, et al. MathDAMP: a package for differential analysis of metabolite profiles. BMC Bioinformatics. 2006;7:530. doi: 10.1186/1471-2105-7-530. [DOI] [PMC free article] [PubMed] [Google Scholar]
- 43.Broeckling CD, Reddy IR, Duran AL, Zhao X, Sumner LW. MET-IDEA: data extraction tool for mass spectrometry-based metabolomics. Anal Chem. 2006;78(13):4334–41. doi: 10.1021/ac0521596. [DOI] [PubMed] [Google Scholar]
- 44.Weljie AM, Newton J, Mercier P, Carlson E, Slupsky CM. Targeted profiling: quantitative analysis of 1H NMR metabolomics data. Anal Chem. 2006;78(13):4430–42. doi: 10.1021/ac060209g. [DOI] [PubMed] [Google Scholar]
- 45.Crockford DJ, Keun HC, Smith LM, Holmes E, Nicholson JK. Curve-fitting method for direct quantitation of compounds in complex biological mixtures using 1H NMR: application in metabonomic toxicology studies. Anal Chem. 2005;77(14):4556–62. doi: 10.1021/ac0503456. [DOI] [PubMed] [Google Scholar]
- 46.Lewis IA, Schommer SC, Hodis B, Robb KA, Tonelli M, Westler WM, et al. Method for determining molar concentrations of metabolites in complex solutions from two-dimensional 1H-13C NMR spectra. Anal Chem. 2007;79(24):9385–90. doi: 10.1021/ac071583z. [DOI] [PMC free article] [PubMed] [Google Scholar]
- 47.Holmes E, Bonner FW, Sweatman BC, Lindon JC, Beddell CR, Rahr E, Nicholson JK. Nuclear magnetic resonance spectroscopy and pattern recognition analysis of the biochemical processes associated with the progression of and recovery from nephrotoxic lesions in the rat induced by mercury(II) chloride and 2-bromoethanamine. Mol Pharmacol. 1992;42(5):922–30. [PubMed] [Google Scholar]
- 48.Hotelling H. The generalization of the Student's ratio. Ann Math Stat. 1931;2:360–78. [Google Scholar]
- 49.Trygg J, Wold S. Orthogonal projections to latent structures (O-PLS) J Chemometr. 2002;16(3):119–28. [Google Scholar]
- 50.Trygg J, Wold S. O2-PLS, a two-block (X-Y) latent variable regression (LVR) method with an integral OSC filter. J Chemometr. 2003;17(1):53–64. [Google Scholar]
- 51.Pounds SB. Estimation and control of multiple testing error rates for microarray studies. Brief Bioinform. 2006;7(1):25–36. doi: 10.1093/bib/bbk002. [DOI] [PubMed] [Google Scholar]
- 52.Martens H, Martens M. Modified Jack-knife estimation of parameter uncertainty in bilinear modelling by partial least squares regression (PLSR) Food Quality and Preference. 2000;11(1-2):5–16. [Google Scholar]
- 53.Pe'er I, Yelensky R, Altshuler D, Daly MJ. Estimation of the multiple testing burden for genomewide association studies of nearly all common variants. Genet Epidemiol. 2008;32(4):381–5. doi: 10.1002/gepi.20303. [DOI] [PubMed] [Google Scholar]
- 54.Akoka S, B L, Trierweiler M. Concentration measurement by proton NMR using the ERETIC method. Anal Chem. 1999;71(13):2254–2557. doi: 10.1021/ac981422i. [DOI] [PubMed] [Google Scholar]
- 55.Kohonen T. The self-organizing map. Proceedings of the IEEE. 1990;78(9):1464. [Google Scholar]
- 56.Gartland KP, Beddell CR, Lindon JC, Nicholson JK. Application of pattern recognition methods to the analysis and classification of toxicological data derived from proton nuclear magnetic resonance spectroscopy of urine. Mol Pharmacol. 1991;39(5):629–42. [PubMed] [Google Scholar]
- 57.Cloarec O, Dumas ME, Craig A, Barton RH, Trygg J, Hudson J, et al. Statistical total correlation spectroscopy: an exploratory approach for latent biomarker identification from metabolic 1H NMR data sets. Anal Chem. 2005;77(5):1282–9. doi: 10.1021/ac048630x. [DOI] [PubMed] [Google Scholar]
- 58.Griffin JL, Bonney SA, Mann C, Hebbachi AM, Gibbons GF, Nicholson JK, et al. An integrated reverse functional genomic and metabolic approach to understanding orotic acid-induced fatty liver. Physiol Genomics. 2004;17(2):140–9. doi: 10.1152/physiolgenomics.00158.2003. [DOI] [PubMed] [Google Scholar]
- 59.Kleno TG, Kiehr B, Baunsgaard D, Sidelmann UG. Combination of ‘omics’ data to investigate the mechanism(s) of hydrazine-induced hepatotoxicity in rats and to identify potential biomarkers. Biomarkers. 2004;9(2):116–38. doi: 10.1080/13547500410001728408. [DOI] [PubMed] [Google Scholar]
- 60.Craig A, Sidaway J, Holmes E, Orton T, Jackson D, Rowlinson R, et al. Systems toxicology: integrated genomic, proteomic and metabonomic analysis of methapyrilene induced hepatotoxicity in the rat. J Proteome Res. 2006;5(7):1586–601. doi: 10.1021/pr0503376. [DOI] [PubMed] [Google Scholar]
- 61.Rantalainen M, Cloarec O, Beckonert O, Wilson ID, Jackson D, Tonge R, et al. Statistically integrated metabonomic-proteomic studies on a human prostate cancer xenograft model in mice. J Proteome Res. 2006;5(10):2642–55. doi: 10.1021/pr060124w. [DOI] [PubMed] [Google Scholar]
- 62.Vilasi A, Cutillas PR, Maher AD, Zirah SF, Capasso G, Norden AW, et al. Combined proteomic and metabonomic studies in three genetic forms of the renal Fanconi syndrome. Am J Physiol Renal Physiol. 2007;293(2):F456–67. doi: 10.1152/ajprenal.00095.2007. [DOI] [PubMed] [Google Scholar]
- 63.Kochhar S, Jacobs DM, Ramadan Z, Berruex F, Fuerholz A, Fay LB. Probing gender-specific metabolism differences in humans by nuclear magnetic resonance-based metabonomics. Anal Biochem. 2006;352(2):274–81. doi: 10.1016/j.ab.2006.02.033. [DOI] [PubMed] [Google Scholar]
- 64.Psihogios NG, Gazi IF, Elisaf MS, Seferiadis KI, Bairaktari ET. Gender-related and age-related urinalysis of healthy subjects by NMR-based metabonomics. NMR Biomed. 2008;21(3):195–207. doi: 10.1002/nbm.1176. [DOI] [PubMed] [Google Scholar]
- 65.Slupsky CM, Rankin KN, Wagner J, Fu H, Chang D, Weljie AM, et al. Investigations of the effects of gender, diurnal variation, and age in human urinary metabolomic profiles. Anal Chem. 2007;79(18):6995–7004. doi: 10.1021/ac0708588. [DOI] [PubMed] [Google Scholar]
- 66.Lenz EM, Bright J, Wilson ID, Hughes A, Morrisson J, Lindberg H, Lockton A. Metabonomics, dietary influences and cultural differences: a 1H NMR-based study of urine samples obtained from healthy British and Swedish subjects. J Pharm Biomed Anal. 2004;36(4):841–9. doi: 10.1016/j.jpba.2004.08.002. [DOI] [PubMed] [Google Scholar]
- 67.Assfalg M, Bertini I, Colangiuli D, Luchinat C, Schäfer H, Schütz B, Spraul M. Evidence of different metabolic phenotypes in humans. Proc Natl Acad Sci U S A. 2008;105(5):1420–4. doi: 10.1073/pnas.0705685105. [DOI] [PMC free article] [PubMed] [Google Scholar]
- 68.Rezzi S, Ramadan Z, Martin FP, Fay LB, van Bladeren P, Lindon JC, et al. Human metabolic phenotypes link directly to specific dietary preferences in healthy individuals. J Proteome Res. 2007;6(11):4469–77. doi: 10.1021/pr070431h. [DOI] [PubMed] [Google Scholar]
- 69.Stella C, Beckwith-Hall B, Cloarec O, Holmes E, Lindon JC, Powell J, et al. Susceptibility of human metabolic phenotypes to dietary modulation. J Proteome Res. 2006;5(10):2780–8. doi: 10.1021/pr060265y. [DOI] [PubMed] [Google Scholar]