Abstract
Transforming growth factor-β1 (TGF-β1) regulates the tissue response to injury and is the principal driver of excessive scarring leading to fibrosis and eventual organ failure. The TGF-β1 effectors SMAD3 and p53 are major contributors to disease progression. While SMAD3 is an established pro-fibrotic factor, the role of p53 in the TGF-β1-induced fibrotic program is not clear. p53 gene silencing, genetic ablation/subsequent rescue, and pharmacological inhibition confirmed that p53 was required for expression of plasminogen activator inhibitor-1 (PAI-1), a major TGF-β1 target gene and a key causative element in fibrotic disorders. TGF-β1 regulated p53 activity by stimulating p53Ser15 and 9 phosphorylation and acetylation, promoting interactions with activated SMADs and subsequent binding of p53/SMAD3 to the PAI-1 promoter in HK-2 human renal tubular epithelial cells and HaCaT human keratinocytes. Immunohistochemistry revealed prominent co-induction of SMAD3, p53 and PAI-1 in the tubular epithelium of the obstructed kidney consistent with a potential in vivo role for p53 and SMADs in TGF-β1-driven renal fibrosis. TGF-β1-initiated phosphorylation of p53Ser15 and up-regulation of expression of several pro-fibrotic genes, moreover, was dependent on the rapid generation of reactive oxygen species (ROS). shRNA silencing of the p22Phox subunit of NADP(H) oxidases in HK-2 cells partially attenuated (over 50%) p53Ser15 phosphorylation and PAI-1 induction. These studies highlight the role of free radicals in p53 activation and subsequent pro-fibrotic reprogramming by TGF-β1 via the SMAD3-p53 transcriptional axis. Present findings provide a rationale for therapeutic targeting of SMAD3-p53 in aberrant TGF-β1 signaling associated with renal fibrosis.
Keywords: PAI-1, TGF-β1, p53, SMADs, transcription, gene expression, tissue fibrosis, reactive oxygen species, chromatin immunoprecipitation
1. Introduction
TGF-β1 is a prominent member of the TGF-β superfamily of pleotrophic ligands that regulate tissue homeostasis and injury repair [1, 2]. In this context, TGF-β1 signals through the ALK5 receptor and downstream effectors SMAD2/3, which exhibit a low DNA binding affinity and require non-canonical cofactors (e.g., FOX proteins, p53) for maximal target gene transcription [3–5]. SMAD3 and p53, moreover, are both functionally implicated in the pathophysiology of metabolic syndrome, diabetic and chronic renal disease and cardiac fibrosis [6–14]. Simultaneous activation of SMAD2/3 and p53 with downstream transcription of the potent pro-fibrotic plasminogen activator inhibitor-1 (PAI-1) gene are characteristic responses to renal obstructive nephropathy [15], a well-established largely TGF-β1-driven experimental model of fibrosis [16].
This paper provides evidence for co-localization of upregulated SMAD3, p53 and PAI-1 in the tubular epithelium of the obstructed kidney coinciding with tubular dilation and interstitial expansion, two hallmarks of renal fibrosis [16]. These observations, coupled with the findings that PAI-1 is a p53 target, at least in replicative senescence [17], and a prominent TGF-β1 responsive gene [18] causatively linked to the progression of renal fibrosis and vascular disease [19–21], prompted an assessment of potential SMAD3/p53 cooperation in TGF-β1-dependent pro-fibrotic gene expression. This study provides evidence that TGF-β1 induces post-translational modifications of p53 promoting interactions between activated p53 and SMAD proteins leading to the creation of a multi-component transcriptional complex on the PAI-1 promoter. p53Ser15 phosphorylation in response to TGF-β1, moreover, is ROS-dependent, in part through the NADP(H) oxidase subunit p22phox, consistent with the role of oxidative stress in gene reprogramming associated with tissue fibrosis [22].
2. Methods
2.1. Cell Culture
HaCaT human keratinocytes, p53+/+ and p53−/− MEFs, HK-2 human proximal tubular epithelial cells, IMR-90 human fetal lung fibroblasts, HepG2 human hepatocellular carcinoma and HaCaT cells stably-expressing YFP-tagged SMAD2 were cultured in DMEM supplemented with 10% FBS. Human renal proximal tubule cells (Lonza) were propagated in renal cell growth medium bulletkit (Lonza). PAI-1 promoter-luciferase reporter mink lung epithelial cells (Mv1Lu-800bp-Luc) [23] were grown in DMEM containing 10% FBS and 250 μg/ml Neomycin. p53−/− MEFs engineered to reexpress p53 (MEFp53−/−+WT p53) were propagated in DMEM/10% FBS/500 μg/ml neomycin. HaCaT cells were serum-deprived for two days prior to addition of 1 ng/mL human recombinant TGF-β1 (R&D Systems). MEFs and HK-2 cells were serum-starved for one day followed by stimulation with 0.1 ng/mL and 2 ng/mL TGF-β1, respectively. Mv1Lu-800bp-Luc were stimulated with 1ng/ml TGF-β1. Pharmacological inhibitors DPI (Sigma-Aldrich), actinomycin D (Sigma-Aldrich), or SIS3 (Calbiochem) were incubated at concentrations indicated in figures one hour prior to TGF-β1 treatment or alone. Pifithrin-α (A.G. Scientific, Inc.) pretreatment was for 18 hours prior to TGF-β1 stimulation. Crystal violet staining served to confirm cell viability following inhibitor treatment.
2.2. Gene Silencing
Semi-confluent (70%) cells were transfected with Accell Green non-targeting control or p53 SMARTpool® siRNA (Dharmacon; 1μM) constructs using Accell siRNA delivery medium for four days. HaCaT and HK-2 cells were serum deprived for 2 days and 1 day, respectively, prior to TGF-β1 treatment. Immunoblotting for p53 expression confirmed the efficiency of gene silencing.
2.3. Generation of Stable p53 Expression
Wild type p53 pcDNA™ 3.1+ vector or control plasmid pcDNA™ 3.1+ (Invitrogen) constructs were transfected into semi-confluent p53−/− MEFs using Lipofectamine (1:3 DNA lipid ratio) in DMEM for 6 hours. Cells were allowed to recovery in DMEM supplemented with 10% FBS. Stable-expressing transfectants were selected for in neomycin (400ug/ml) for 7 days. Immunoblotting for p53 confirmed the rescue of gene expression.
2.4. Immunoblotting
Cells were lysed and extracts prepared as described (24). Primary antibodies included: rabbit anti-PAI-1 (1:3000) [25], rabbit anti-p53 (1:2000; Cell Signaling), rabbit anti-ERK2 (1:5000; Santa Cruz); rabbit anti-phospho-SMAD2/3 (1:500; Santa Cruz), rabbit anti-β-actin (1:5000; Santa Cruz), mouse anti-Fibronectin (1:2000; BD Biosciences), rabbit anti-CTGF/CCN2 (1:2000, Abcam), mouse anti-α-smooth muscle actin (1:2000; BD Biosciences), rabbit anti-COX-2 (1:2000, Santa Cruz), rabbit anti-p21 (1:1000, Santa Cruz), rabbit anti-phospho-p53 sampler kit (1:1000; Cell Signaling), rabbit anti-phospho-p53Ser15 (1:1000; Cell Signaling), rabbit anti-phospho-SMAD3 (1:2000, Thermoscientfic), rabbit anti-lamin A C (1:1000, Santa Cruz), rabbit anti-SMAD3 (1:2000, Abcam), rabbit anti-SMAD2 (1:1000, Santa Cruz), mouse anti-GFP (1:2000, Santa Cruz), rabbit anti-acetyl-lysine (1:1000, Cell Signaling), rabbit anti-p300 (1:2000, Santa Cruz).
2.5. Sub-Cellular Fractionation
Whole cells in PBS were pelleted by centrifugation for 1 minute at 8000 rpm and resuspended in hypertonic Solution A (10 mM HEPES, pH 7.9, 10 mM KCl, 0.1 mM EDTA, 0.1 mM EGTA) supplemented with protease and phosphatase inhibitor cocktail and shaken on ice for 20 minutes. Solution B (3% NP-40) was added followed by centrifugation at 8000 rpm for 1 minute to isolate the cytoplasmic fraction. The remaining pellet was resuspended in Solution C (20 mM HEPES, pH 7.9, 0.42 M NaCl, 1 mM EDTA, 1 mM EGTA, 1 mM DTT) supplemented with protease and phosphatase inhibitor cocktail for overnight incubation. The nuclear (supernatant) and cytoskeletal (pellet) fractions were separated at 8000 rpm for 1 minute. Lamin A/C, a predominant nuclear protein, distinguished cytoplasmic and nuclear fractions.
2.6. ROS Assay
Cells were treated with TGF-β1 at the indicated times at 37°C, washed with PBS and incubated in 5 mM 2′,7′-dichlorofluorescein diacetate (DCF-DA, Molecular probes; C400) in PBS for 15 minutes. Triplicates of equal cell numbers were harvested simultaneously and the fluorescence signal was determined with a multi-detection microplate reader (Synergy HT; Bio-Tek) at an excitation wavelength of 495 nm.
2.7. Luciferase Assays
Mv1Lu-800bp-Luc cells were treated with inhibitors SIS3 or Pifithrin-α followed by 16 hours of TGF-β1 treatment. Signal was assessed with the Dual-Luciferase® Reporter Assay kit (Promega) according to manufacturers’ recommendations. Luciferase emission indicative of relative PAI-1 promoter activation was quantified by a Turner Designs TD-20/20 luminometer.
2.8. Co-Immunoprecipitation
HaCaT and HK-2 cells were stimulated with TGF-β1, lysates isolated in 150 mM NaCl, 1% NP-40, 0.5% deoxycholic acid, 50 mM HEPES, pH 7.5, 50 mM NaF buffer containing a protease inhibitor cocktail and phosphatase inhibitors. Mouse anti-p53 (pantropic, Calbiochem) and anti-GFP (to precipitate YFP-SMAD2; Santa Cruz) targeting antibodies pulled down p53 and GFP tagged proteins, respectively. Immune complexes were captured with protein AG agarose (Santa Cruz) for 2 hours at 4°C.
2.9. Chromatin Immunoprecipitation
Untreated and TGF-β1 treated HaCaT and HK-2 cells were fixed with formaldehyde for protein-DNA crosslinking followed by a 10 minute incubation with a final concentration of 125 mM glycine followed by nuclear lysate isolation (as above) and sonication to generate DNA fragments (~50–200 base pairs) used for ChIP analysis. 3 μg of ChIP-competent p53 (Active Motif) and SMAD3 (Abcam) antibodies were added to immunoprecipate DNA fragments bound by p53 or SMAD3, respectively. Real Time PCR reactions performed in a Bio-Rad iCycler iQ™ Real-Time PCR Detection System, using a mixture of Sybr Green® (Qiagen) and PAI-1 promoter primers (forward: CAACCTCAGCCAGACAAGGT; reverse: CTGAGGCATGTGTGTGTGTG) under optimizing PCR cycle conditions (10 minute 95°C; 45 cycles 95°C for 20s, 55°C for 30s, 72°C for 30s). Threshold cycle graphs yielded Ct values for each ChIP reaction. Calculated ΔΔCt values represent the increase of p53 or SMAD3 bound to the PAI-1 promoter.
2.10. Microarray Analysis
HK-2 cells were serum starved for a day then left untreated (control) or treated with TGF-β for 24 hours with or without Pifithrin-α pretreatment. Total RNA was extracted using RNeasy® Mini Kit (Qiagen) and converted to cDNA using the RT2 First Strand Kit (Qiagen) according to manufacturer’s recommendations. cDNA and Sybr Green® ROX qPCR mastermix was added to each well of the human TGF-β/BMP pathway PCR Array (SA Biosciences; PAHS-035Z) and subjected to RT-PCR analysis (3 minute 95°C; 45 cycles 95°C for 10s, 56°C for 60s) in a Bio-Rad iCycler iQ™ Real-Time PCR Detection System.
2.11. Unilateral Ureteral Obstruction (UUO)
Surgery was carried out in strict accordance with the recommendations in the Guide for the Care and use of laboratory Animals of the National Institutes of Health. Animal protocol #2599 was reviewed and approved by the Institutional Animal Care and Use Committee of the Indiana University School of Medicine. Adult male Sprague-Dawley rats weighing 200–250 grams were maintained on a standard pellet diet 1 week before experimentation. Rats were anesthetized using isoflurane inhalation prior to complete ligation of the left ureter via a midline laprotomy; the unmanipulated contralateral kidney served as a control. Seven days later, both kidneys were removed at necropsy and embedded in paraffin.
2.12. Immunohistochemistry
Obstructed and contralateral (CON) kidney sections were deparaffinized in xylene, rehydrated in ethanol, subjected to antigen retrieval in sodium citrate buffer with subsequent addition of TWEEN 20 and washed in water. Endogenous peroxidase activity was quenched in BLOXALL (Vector Labs, SP-6000) followed by blocking in 10% normal goat serum. Sections were overlayed for 30 minutes with rabbit anti-PAI-1 (1:1000), rabbit anti-p53 (Thermo Scientific, MA1-39548; 1:200) or rabbit anti-SMAD3 (Cell Signaling; 1:1000) antibodies in 1% bovine serum albumin followed by incubation with appropriate secondary biotinylated antibody (Vector Labs; anti-rabbit BA-1000, anti-mouse BA-9200) for 30-minutes. VECTASTAIN Elite ABC (Vector Labs, PK-7100) was added for 30 minutes and reactions developed with ImmPACT DAB (3,3′-diaminobenzidine) peroxidase substrate (Vector Labs, SK-4105) for 2 to 10-minutes (with timing titrated according to staining intensity) prior to counterstaining with Hematoxylin QS (Vector Labs, H-3404).
3. Results
3.1. p53 as a regulator of TGF-β1-induced gene expression
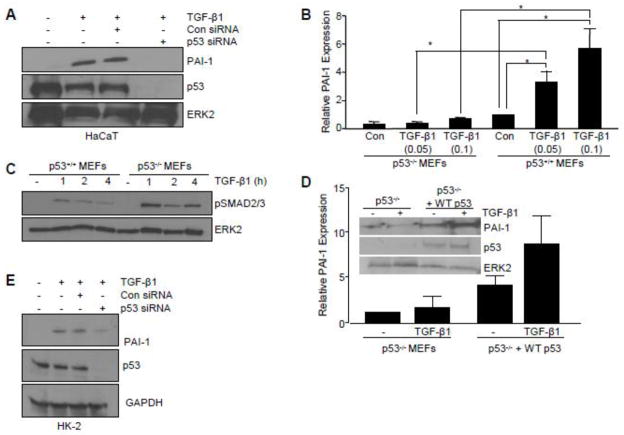
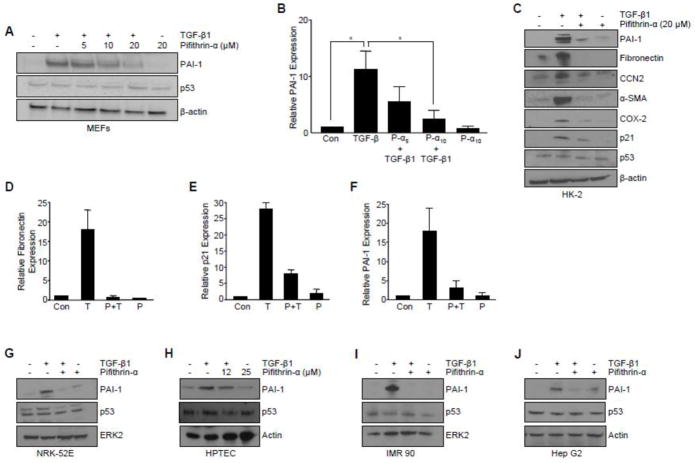
To investigate the role of p53 in TGF-β1-mediated pro-fibrotic gene activation, initial experiments used HaCaT keratinocytes, a well-established model for elucidating TGF-β1 signaling. siRNA-directed p53 silencing completely inhibited TGF-β1-mediated PAI-1 induction in HaCaT cells (Figure 1A). Genetic deletion of p53 (p53−/− MEFs) confirmed the requirement for p53 in TGF-β1-induced PAI-1 expression (Figure 1B). TGF-β1-stimulated SMAD2/3 phosphorylation, however, was retained in p53−/− cells (Figure 1C) indicating that the TGF-β1 canonical pathway was intact and p53-independent. Stable introduction of a p53 cDNA construct in p53-null fibroblasts (p53−/−+WT p53) rescued TGF-β1-dependent PAI-1 expression (Figure 1D), while Pifithrin-α, a p53 pharmacological inhibitor [25], attenuated TGF-β1-stimulated PAI-1 levels in p53+/+ MEFs (by 83% at 10 μM, Figure 2A, B).
Figure 1. Critical role of p53 in TGF-β target gene expression.
(A) Western analysis indicated that PAI-1 induction by TGF-β1 (2 ng/ml) was inhibited by transfection of HaCaT keratinocytes with SMARTpool p53 siRNA compared to control siRNA. Assessment of p53 levels confirmed knockdown efficacy. (B) Histogram illustrating PAI-1 expression at indicated TGF-β1 concentrations (0.05, 0.1 ng/ml) in p53+/+ and p53−/− mouse embryonic fibroblasts (MEFs). Data plotted represents mean ± standard deviation (s.d.) of three independent studies; Statistical significance for each condition was calculated using the t-test. *p<0.05.”. (C) Western analysis of increased phosphorylated SMAD2/3 (pSMAD2/3) in MEFs in response to TGF-β1 treatment indicates an intact TGF-β1 signaling network in p53−/− MEFs. (D) Western blotting of p53−/− MEFs transfected to stably-express control empty vector (p53−/−) or p53 cDNA (p53−/− +WTp53) followed by TGF-β1 stimulation confirmed successful reexpression of p53 following cDNA transfection and selection in neomycin. (E) Immunoblotting of TGF-β1-mediated PAI-1 expression following p53 knockdown in HK-2 cells. Blot of p53 confirms knockdown efficiency. TGF-β1 exposure was for 5 hours (A, B, D) or 24 hours (E). ERK2 (A, C, D) and GAPDH (E) served as loading controls.
Figure 2. Pharmacological inhibition of p53 attenuates TGF-β-mediated target gene expression.
(A) Effect of pretreatment with the p53 pharmacological inhibitor Pifithrin-α at indicated doses (5, 10, 20 ΔM) on TGF-β1-induced PAI-1 expression in p53+/+ MEFs. Graph (B) depicts mean ± s.d. of three independent studies; statistical significance determined with t-test *p<0.05. (C) Pifithrin-α blocked TGF-β1-induced expression of a subset of pro-fibrotic genes (i.e., PAI-1, fibronectin, CTGF/CCN2, α-SMA), the pro-inflammatory cytokine (i.e., COX-2), and a growth arrest gene (i.e., p21) in HK-2 human renal proximal tubular epithelial cells. Histogram in (D–F) quantitates the effect of Pifithrin-α on TGF-β1-dependent fibronectin, p21, and PAI-1 expression, respectively, as determined in replicate independent experiments. Pifithrin-α pretreatment effectively blocked PAI-1 induction in NRK-52E rat (G) and primary human proximal tubular epithelial cells (H). Pretreatment with p53 inhibitor Pifithrin-α abrogated TGF-β1-mediated PAI-1 levels in IMR-90 human lung fibroblasts (I) and HepG2 human hepatocytes (J). TGF-β1 exposure was for 5 hours (A, B, H–J) or 24 hours (C–G). β-actin (A, C, H, J) and ERK2 (G, I) served as loading controls.
Tubular epithelial cells contribute to the progression of chronic renal fibrosis through a p53-mediated growth arrest leading to a release of TGF-β1 [11]. p53 silencing in HK-2 human proximal tubular epithelial cells markedly reduced TGF-β1-dependent PAI-1 expression (Figure 1E). Pretreatment with Pifithrin-α prior to TGF-β1addition effectively suppressed induction of the TGF-β1-responsive genes PAI-1 (by 80%; Figure 2C, F), fibronectin (by 95%; Figure 2C, D), connective tissue growth factor (CTGF/CCN2), α-smooth muscle actin (α-SMA), cyclooxgenase-2 (COX-2) and p21 (by >70%; Fig. 2C, E). Pifithrin-α, moreover, inhibited TGF-β1-mediated PAI-1 expression in NRK-52E rat kidney epithelial cells (Figure 2G) and primary human renal tubular epithelial cells (Figure 2H) as well as IMR-90 human lung fibroblast (Figure 2I) and HepG2 human hepatocytes (Figure SJ). Collectively, these findings implicate p53 as a critical downstream regulator of the TGF-β1 pro-fibrotic genomic program.
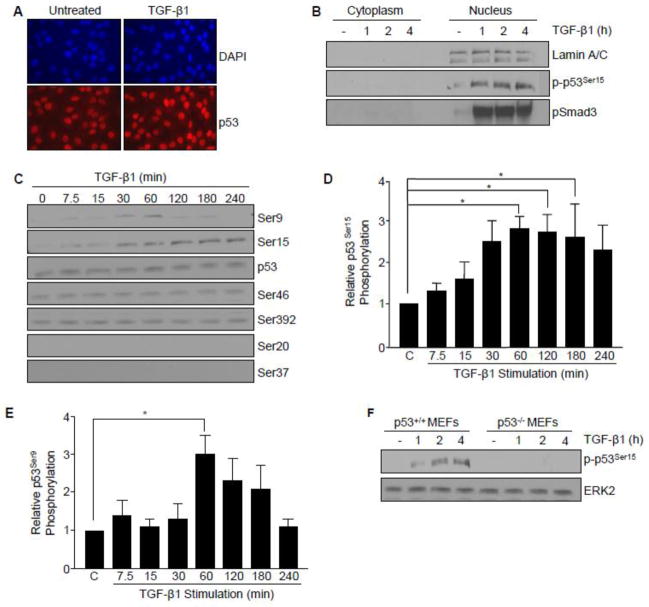
Post-translational modifications are major determinants of p53 transcriptional activity and target gene specificity [26]. Immunofluorescence and nuclear fractionation indicated that p53 localization was predominantly nuclear in HaCaT cells (Figure 3A, B). Using a panel of antibodies targeting specific phospho-p53 serine sites critical for transcriptional reprogramming in the contexts of cellular repair, growth arrest, senescence, and cell death, TGF-β1 stimulated phosphorylation of p53 at serine 9 and 15 (but not at Ser 46 or 392; while Ser 20 and 37 remained undetectable) (Figure 3C). p53Ser15 phosphorylation, a site involved in p53 tetramerization and stabilization [26] was rapid and remained elevated for at least 4 hours in HaCaT cells (Figure 3D) as well as in p53+/+ MEFs (Figure 3F). TGF-β1 transiently stimulated p53Ser9 phosphorylation peaking at one hour (Figure 3E), a site previously implicated in p53 and SMAD integration of activin/FGF-driven developmental processes in Xenopus [5]. TGF-β1 promoted nuclear accumulation of phosphorylated p53Ser15 with kinetics similar to that of pSMAD3 (Figure 3B) (1–4 hours) preceding optimal PAI-1 protein expression (5–6 hours) suggesting that p53 and SMAD3 may function as co-regulators of TGF-β1 signaling.
Figure 3. Post-translational modification of p53 by TGF-β.
(A) Immunofluorescence staining of the expression and localization of p53 (red) in untreated and TGF-β1 (1 hr) treated HaCaT cells. Nuclei (blue) were visualized by 4,6-diamidino-2-phenylindole (DAPI) staining. (B) Isolation of cytoplasmic and nuclear fractions in HaCaT keratinocytes. Immunoblot analysis confirmed TGF-β1-induced expression, subcellular localization, and kinetics of phosphorylated p53Ser15 (p-p53Ser15) and phosphorylated SMAD3 (pSMAD3) over a time course preceding optimal target gene expression (i.e. PAI-1). Lamin A/C provided a biochemical marker of the nuclear compartment. (C) Immunoblot assessment of specific p53 serine phosphorylation sites in response to TGF-β1. TGF-β1 treatment, up to 4 hours, did not significantly alter total p53 expression levels. (D, E) Histograms illustrate kinetics of TGF-β1-induced p53Ser15 and p53Ser9 phosphorylation, respectively, as mean ± s.d. of three separate experiments. (F) TGF-β1 promotes p53Ser15 phosphorylation in a time-dependent manner in p53+/+, but not p53−/− MEFs.
3.2. Transcriptional cooperativity of p53 and SMAD3 in TGF-β1-induced PAI-1 expression
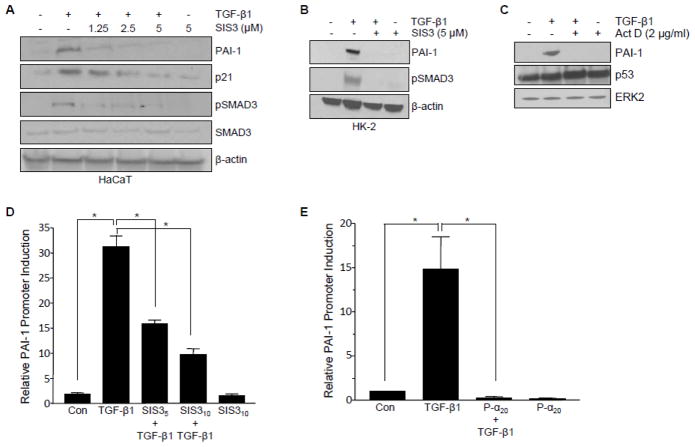
The pharmacological SMAD3 inhibitor SIS3 served to implicate the canonical SMAD pathway in TGF-β1-dependent pro-fibrotic gene induction. Inhibition of SMAD3 phosphorylation by SIS3 confirmed that TGF-β1-initiated PAI-1 and p21 expression required SMAD3 signaling in HaCaT keratinocytes (Figure 4A), HK-2 renal cells (Figure 4B) and MEFs [24]. SMADs are the main transcriptional effectors downstream TGF-β1 of the TGF-β receptor. Consistent with this requirement, PAI-1 promoter activation by TGF-β1 was effectively blocked by SIS3 (Figure 4D) in mink lung epithelial (Mv1Lu-800bp-Luc) cells engineered to stably-express a luciferase reporter driven by an 800bp fragment of the human PAI-1 promoter [23]. Since the upstream region of the human PAI-1 gene contains several p53 consensus sites [27], at least one in proximity to the SMAD-binding PE2 region, it was necessary to evaluate the effect of p53 pharmacologic blockade in this same system. Pifithrin-α preincubation, similar to the results obtained with SIS3, completely inhibited TGF-β1-dependent PAI-1 promoter-driven luciferase expression (Figure 4E).
Figure 4. Requirement for pSMAD3 and p53 in TGF-β1-induced transcription.
(A, B) Effect of the SMAD3 pharmacological inhibitor SIS3 on TGF-β1-induced PAI-1 and p21 expression in HaCaT (A) and HK-2 (B) cells. Blockade of SMAD3 phosphorylation confirmed the functionality of SIS3. β-actin served as loading control (A, B). (C) Effect of global blockade of transcription via actinomycin D on TGF-β1-mediated PAI-1 protein expression. Total p53 levels remained equal. ERK2 provided as loading control. Luciferase reporter analysis in Mv1Lu-800bp-Luc cells. Histograms depict the mean± s.d. for triplicate experiments of TGF-β1-mediated PAI-1 promoter activation (16 hrs), measured by luciferase emission, in the presence of SIS3 (D) or Pifithrin-α (E) at indicated doses; t-test determined statistical significance *p<0.05.
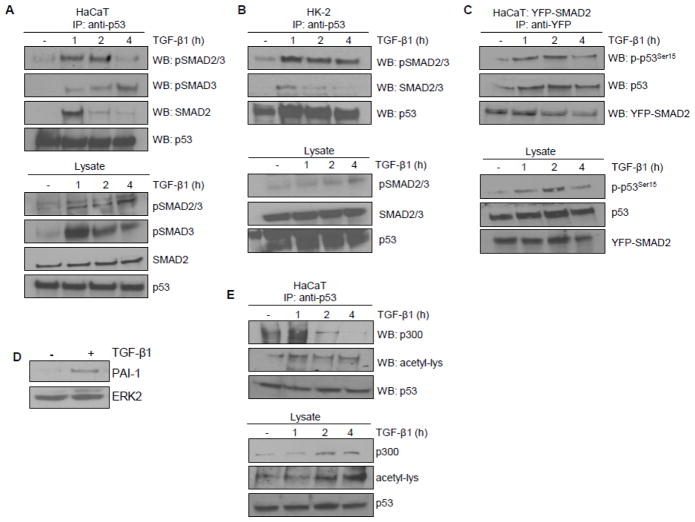
The requirement for SMAD3 and p53 in TGF-β1 reporter activation prompted an evaluation of potential SMAD3/p53 interactions in TGF-β1-dependent transcriptional regulation. Immunoprecipitation (IP) experiments revealed that TGF-β1 promoted complex formation between endogenous p53 and activated SMADs (pSMAD2/3, pSMAD3; maximal within 1–2 hours) in HaCaT keratinocytes (Figure 5A) as well as in HK-2 proximal tubular epithelial cells (Figure 5B). Interactions were similarly evident between activated p53 (p53Ser15) and exogenous YFP-tagged SMAD2-expressing HaCaT keratinocytes (Figure 5C). The SMAD tag, importantly, did not affect the physiologic response to TGF-β1 in the YFP-SMAD2-HaCaT system (Figure 5D). p53Ser15 phosphorylation recruits p300, a histone acetyltransferase, that promotes acetylation of p53 orchestrating subsequent transcriptional outcomes [26]. p53 acetylation was evident within one hour of TGF-β1 addition consistent with increased interaction between endogenous p53 and p300 (Figure 5E). Creation of a multi-component complex involving p300, which interacts with SMADs [28], and the non-SMAD cofactor p53 preceded optimal expression of the TGF-β1 target PAI-1 gene.
Figure 5. Transcriptional complex formation involving p53/SMAD3/p300 in response to TGF-β1.
(A,B) Immunoprecipitation analysis of p53 interactions with SMAD proteins. (A) Immunoprecipitation of endogenous p53 followed by immunoblotting for activated SMADs (pSMAD2/3, pSMAD3) and total SMAD2 following TGF-β1 (1, 2, 4 hr) treatment in HaCaT cells. Western analysis of lysates assessed the presence and phosphorylation status of SMADs in response to TGF-β1 exposure. Equivalent levels of immunoprecipated p53 was confirmed by immunoblotting. (B) p53 similarly interacts with activated and total SMAD2/3 in HK-2 cells. (C) Immunoprecipitation of ectopically-expressed YFP-SMAD2 in HaCaT cells followed by immunoblotting of activated (p-p53Ser15) and total p53. Pull down efficiency confirmed by western blotting with YFP antibody. (D) Retention of PAI-1 induction by TGF-β1 in YFP-SMAD2 HaCaT cells. (E) Immunoprecipitation of endogenous p53 followed by immunoblotting for p300 and acetyl-lysine (acetyl-lys) upon TGF-β1 stimulation of HaCaT keratinocytes.
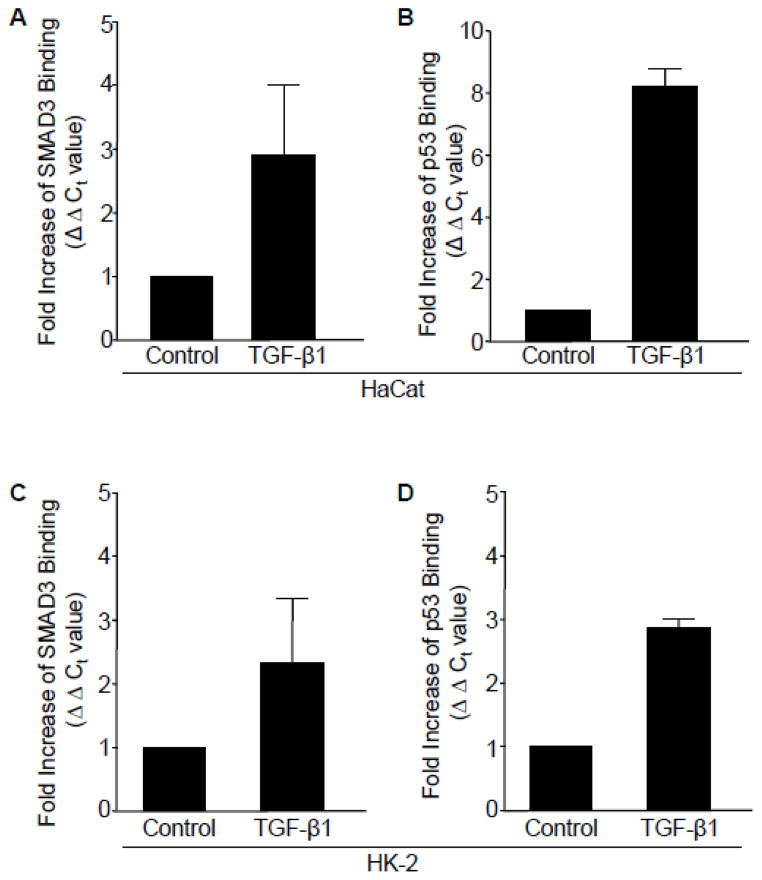
Chromatin immunoprecipitation (ChIP), using primers encompassing previously identified SMAD and p53 responsive elements in the PAI-1 gene, reflected a 3-fold increase (ΔΔCt value) in SMAD3 promoter binding (Figure 6A) following TGF-β1 treatment (at 2hrs) compared to control untreated HaCaT cells. Consistent with results implicating p53 in both PAI-1 transcription (Figure 4E) and endogenous interactions with pSMAD3 (Figure 5A, B), there was a significant increase (Figure 3E) in p53 engagement, concurrent with SMAD3, on the PAI-1 gene in response to TGF-β1 stimulation in HaCaT cells (Figure 6A, B). TGF-β1 promoted a simultaneous increase in occupancy of both SMAD3 and p53 to the PAI-1 promoter in HK-2 renal tubular cells (Figure 6C, D).
Figure 6. Simultaneous occupancy of SMAD3 and p53 on TGF-β1 target PAI-1 promoter.
(A–D) Chromatin immunoprecipiation (ChiP) analysis using antibodies targeting SMAD3 or p53 following 2 hour TGF-β1 treatment and subsequent RT-PCR analysis, using primers encompassing the SMAD and p53 response elements in the PAI-1 promoter. Data plotted indicates the fold-increase in SMAD3 (A) or p53 (B) binding (calculated by ΔΔCt values) in HaCaT cells. TGF-β1 stimulation (for 24 hr) also increased SMAD3 (C) and p53 (D) occupancy on the PAI-1 promoter in HK-2 cells. Graphs (A–D) represent mean ± s.d. of triplicate experiments.
3.3. Requirement of ROS in TGF-β1-dependent pro-fibrotic gene induction and p53 activation
ROS generation is necessary for TGF-β1-induced PAI-1 expression in vascular smooth muscle cells as well as MEFs [24]. Hydrogen peroxide (H2O2), moreover, stimulates rapid p53Ser15 phosphorylation [15] highlighting redox control of p53 activation. This prompted an assessment of the potential role of oxidative stress in TGF-β1-dependent p53 activation and pro-fibrotic gene induction. TGF-β1 rapidly generated ROS, quantified by DCF-DA emission, within 15 minutes in HaCaT (Figure 7A) and HK-2 (Figure 7D) cells. DPI, a NADP(H) oxidase/ROS inhibitor, effectively blocked TGF-β1-mediated PAI-1 (by 75% at 40 μM; Figure 7B, C), fibronectin, CTGF and p21 expression in HaCaT keratinocytes (Figure 7B) as well as the induction of PAI-1, fibronectin, and COX-2 in the HK-2 cells (Figure 7E). DPI also inhibited TGF-β1-induced p53Ser15 phosphorylation in HaCaT (Figure 7F, G) and HK-2 (Figure 7H) cells highlighting a novel link between ROS and p53, where ROS is an upstream regulator of p53 activation, downstream of TGF-β1 in the pro-fibrotic program.
Figure 7. TGF-β induction of target genes and phosphorylation of p53Ser15 is ROS-dependent.
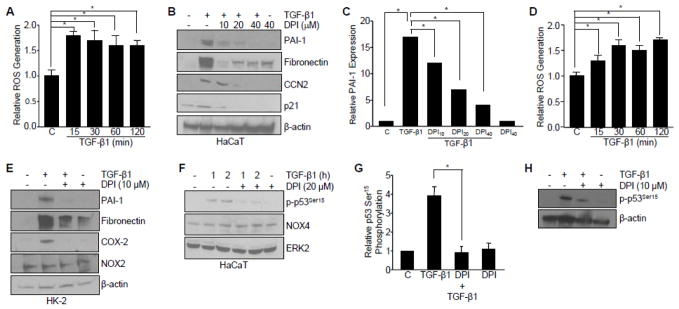
(A) Rapid ROS generation as assessed by 2′,7′-dichlorfluorescein-diacetate (DCF-DA) emission during the time course of TGF-β1 treatment (0, 15, 30, 60, 120 min) in HaCaT cells. Graph represents mean ± s.d. of three independent experiments; *p<0.05. (B) Western analysis of the effect of pretreatment with the ROS inhibitor diphenyleneiodonium chloride (DPI) on TGF-β1-dependent target gene expression (5 hrs) in HaCaT cells. (C) Graph of PAI-1 protein expression illustrating the mean ± s.d. of three replicate experiments; *p<0.05. (D) TGF-β1 rapidly generates ROS, as measured using DCF-DA, in HK-2 proximal tubular epithelial cells. (E) Inhibition of ROS with DPI blocks TGF-β1-mediated PAI-1, fibronectin, and COX-2 expression (for 24 hrs) in HK-2 cells. (F–H) Effect of ROS inhibition by DPI on TGF-β1-stimulated p53Ser15 phosphorylation in HaCaT (F, G) and HK-2 (H) cells. Bar graph in (G) represents the mean ± s.d. of three separate immunoblots from (F); *p<0.05. β-actin (B, E, H) and ERK2 (F) are loading controls. Statistical significance of the indicated groups was calculated by t-test in histograms (A, C, D, G).
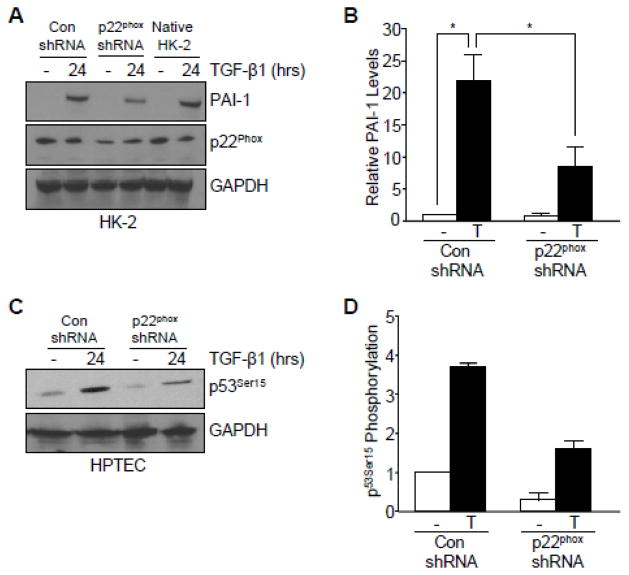
NOX proteins are a critical source of ROS in gene reprogramming related to fibrotic disease [22] and p22phox, a subunit of NOX1/2/4, expression is robustly upregulated in one-week obstructed kidneys compared to the contralateral controls in vivo [29]. It was important, therefore, to evaluate the potential role of this NOX subunit in TGF-β1-induced PAI-1 expression and p53Ser15 phosphorylation. Genetic silencing of p22phox abrogated TGF-β1-induced PAI-1 expression (by 64%; Figure 8A, B) compared to control shRNA and native HK-2 cells. Knockdown of p22phox, moreover, partially blocked p53Ser15 phosphorylation (by 50%; Figure 7C, D) in response to TGF-β1.
Figure 8. Involvement of p22phox in TGF-β1-mediated target gene expression and p53 activation.
(A, B) Genetic silencing of p22phox attenuated PAI-1 expression following TGF-β1 exposure in HK-2 cells. Histogram in (B) illustrates the mean ± s.d. of two separate experiments from (I). (C, D) TGF-β1-induced p53Ser15 phosphorylation was abrogated following knockdown of p22phox in human proximal tubular epithelial cells. Graph in (D) depicts the mean ± s.d. of two separate immunoblots from (C). GAPDH (A, C) serves as a loading control. Statistical significance of the indicated groups was calculated by t-test (B, D).
3.4. Co-localization of p53, SMAD3, and PAI-1 expression in the tubular epithelium of the fibrotic kidney
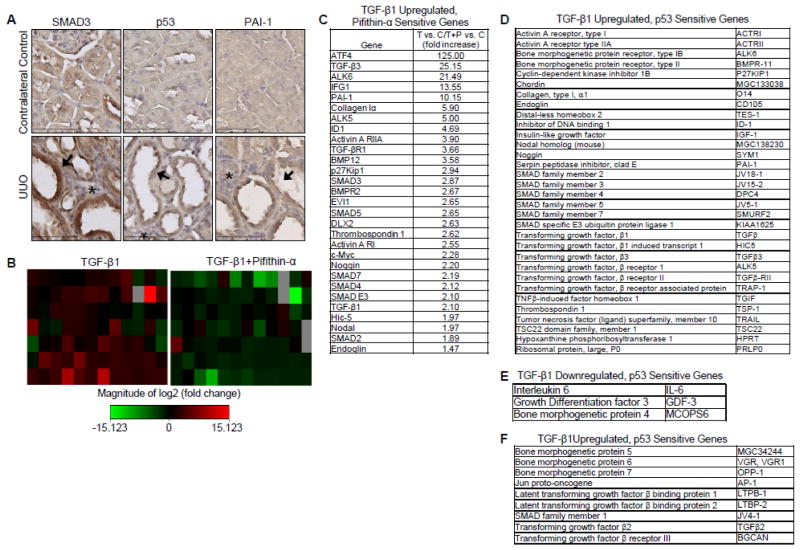
To identify the potential consequences of p53/SMAD3 signaling in target gene control in vivo, unilateral ureteral obstruction (UUO), a well-characterized experimental model of TGF-β1-driven renal fibrosis [16] in which PAI-1 is a causative element in disease progression [15,19] was utilized. At day 7, the ligated kidney exhibited marked tubular dilation and interstitial expansion (Figure 9A), two hallmarks of renal fibrosis [16]. Prominent co-expression of SMAD3 and p53 correlated with PAI-1 up-regulation in the tubular epithelium of the obstructed kidney compared to the contralateral control (Figure 9A). To further investigate the requirement for p53 in the repertoire of TGF-β1-regulated genes in the renal tubular epithelium, HK-2 human proximal tubular epithelial cells were stimulated with TGF-β1 for 24 hours with or without pretreatment of Pifithrin-α prior to array analysis (Figure 9B). Microarray results revealed a subset of TGF-β1-upregulated genes encoding pro-fibrotic (e.g., PAI-1, collagen 1α, TGF-β1) and growth arrest (e.g., p27kip1, TGF-β1) factors (Figure 9C, D) that were both p53 dependent and possessed previously identified p53 responsive elements [27]. Additional genes were identified to be TGF-β1 downregulated, p53 sensitive genes (e.g., Interleukin 6) (Figure 9E) and TGF-β1 upregulated, p53 insensitive genes (e.g., bone morphogenetic protein 7) (Figure 9F).
Figure 9. Prominent co-localization of SMAD3 and p53 correlate with increased PAI-1 expression in the tubular epithelium of obstructed rat kidneys.
(A) Representative immunohistochemical images for SMAD3, p53, and PAI-1 localization in contralateral control (top) and obstructed UUO (bottom) rat kidneys. Nuclei were counterstained with hematoxylin. Arrows indicate tubular dilation while asterisks indicate interstitial expansion consistent with UUO-induced renal fibrosis. Contralateral kidneys without surgical manipulation served as control. (B) Heat maps of 24-hr TGF-β1-stimulated HK-2 tubular epithelial cells with or without Pifithrin-α pretreatment prior to analysis of mRNA transcripts using the TGF-β/BMP pathway PCR Array. Fold increase or decrease of gene expression is depicted as red and green, respectively. (C) Microarray results of selected target genes upregulated by TGF-β1 and sensitive to pifithrin-α pretreatment. Genes identified by PCR Array were classified as (D) TGF-β1Upregulated, p53 Sensitive Genes, (E) TGF-β1 Downregulated, p53 Sensitive Genes, and (F) TGF-β1 Upregulated, p53 Insensitive.
4. Discussion
p53 is a well-established regulator of cell cycle arrest, senescence and apoptosis [24,27]. This study implicates p53 in the TGF-β1-initiated transcriptional regulation of a subset of genes known to promote a pro-fibrotic microenvironment (Figure 10). p53 silencing, genetic ablation, re-expression in p53-deficient cells, and pharmacological inhibition confirmed that p53 is critical for TGF-β1 induction of PAI-1 and other target genes (e.g., CTGF). p53 is serine-phosphorylated and lysine-acetylated in response to TGF-β1 and the rapid ROS generation by TGF-β1 is a key upstream regulator of p53Ser15 phosphorylation and pro-fibrotic gene transcription. These novel findings link ROS and p53 as key transducers of TGF-β1 signaling and yield translationally-relevant opportunities to target non-SMAD elements to suppress fibrotic disease driven by aberrant TGF-β1 expression. TGF-β1, moreover, promotes interactions between activated p53 and SMAD3 that precede PAI-1 and CTGF induction. PAI-1, collagen 1α, sma-α and other pro-fibrotic effectors do, indeed, have p53 responsive element(s) in their promoter regions [27]. ChIP analysis confirmed TGF-β1-dependent binding of both wild-type (HK-2) and mutant (HaCaT) p53 to the PAI-1 promoter. These data are consistent with the recognition that p53 mutations confer differential DNA binding capacities. Mutant p53 and serum response element-binding proteins (SREBPs), in fact, cooperate in the transcriptional regulation of metabolic genes involved in the melvonate pathway [30]. TGF-β1-induced complex formation between mutant p53/SMAD/p63 inhibited expression of p63 target genes (e.g., Sharp-1) [31] highlighting both transcriptional and non-transcriptional mechanisms initiated by mutant p53 downstream of TGF-β1.
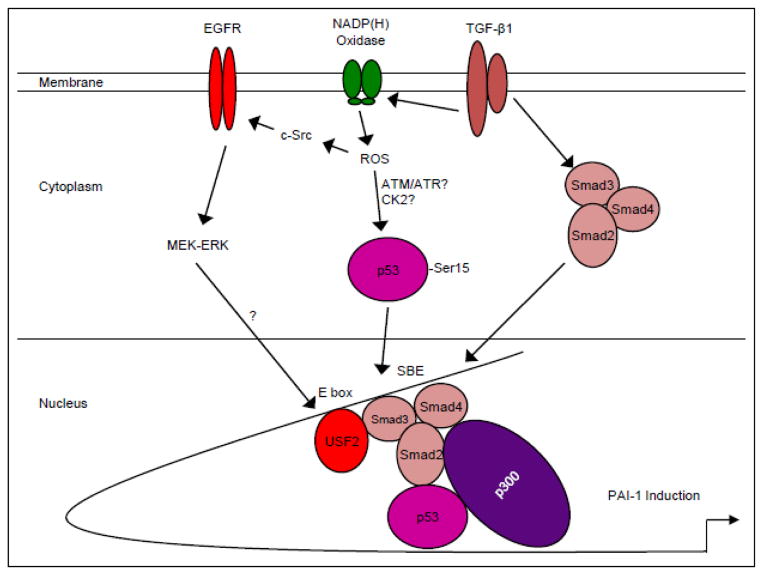
Figure 10. Hypothetical model of TGF-β1-induced PAI-1 transcription.
TGF-β1 receptor activation initiates both SMAD2/3 phosphorylation, via the ALK5/type I TGF-β1 receptor, as well as non-SMAD (e.g. EGFR, MAPK, c-Src) signaling cascades. These pathways have downstream consequences on gene expression (e.g. PAI-1, ECM structural elements) as well as cellular phenotypic responses (e.g., excessive matrix deposition/ fibrosis, myofibroblast induction, growth arrest). TGF-β1 stimulates ROS-dependent EGFRY845 transactivation by pp60c-src which initiates, in turn, downstream MAP kinase (e.g. ERK, p38) pathway signaling to promote a USF1 to USF2 activator switch at the PE2 site E box of the PAI-1 promoter [15]. TGF-β1 generation of ROS phosphorylates p53 leading to complex formation with SMAD2/3/4 and p300 on the PAI-1 promoter inducing optimal PAI-1 transcription.
Several recent studies also suggest the therapeutic potential in targeting SMAD3 and p53 in the progression of renal disease. Indeed, inhibition of SMAD3 activation by SIS3 attenuated streptozotocin-induced diabetic nephropathy in an animal model [9]. Similarly, Pifithrin-α ameliorated the progression of chronic renal disease induced by acute kidney injury [12]. Co-induction of p53, SMAD3, and PAI-1 in the tubular epithelium of the injured kidney is consistent with the concept that targeting the p53/SMAD3 axis may provide a novel approach to suppress development of fibrosis initiated by aberrant TGF-β1 signaling.
Conclusions
TGF-β1 activates p53 resulting in creation of p53/SMAD complexes on the PAI-1 promoter. p53Ser15 phosphorylation in response to TGF-β is ROS-dependent involving, in part, the NADP(H) oxidase subunit p22phox consistent with the role of oxidative stress in gene reprogramming associated with tissue fibrosis. These studies highlight the upstream role of free radicals and the NADP(H) oxidases in p53 activation and subsequent pro-fibrotic reprogramming by TGF-β1 via the SMAD3-p53 transcriptional axis. The findings presented in this paper provide a rationale for therapeutic targeting of SMAD3-p53 in TGF-β1-initiated fibrotic disease.
Highlights.
The TGF-β1 effectors SMAD3 and p53 are major contributors to tissue fibrosis. Although SMAD3 is an established pro-fibrotic factor, the role of p53 in the TGF-β1-induced fibrotic program is not clear.
Present findings confirmed that p53 was required for expression of plasminogen activator inhibitor-1 (PAI-1), a major TGF-β1 target gene and a key causative element in fibrotic disorders.
TGF-β1 regulated p53 activity by stimulating p53Ser15 and 9 phosphorylation and acetylation, promoting interactions with activated SMADs and subsequent binding of p53/SMAD3 to the PAI-1 promoter.
TGF-β1-initiated phosphorylation of p53Ser15 and up-regulation of expression of several pro-fibrotic genes was dependent on the rapid generation of reactive oxygen species. shRNA
Silencing of the p22Phox subunit of NADP(H) oxidases attenuated p53Ser15 phosphorylation and PAI-1 induction.
These studies highlight the role of free radicals in p53 activation and subsequent pro-fibrotic reprogramming by TGF-β1 via the SMAD3-p53 transcriptional axis.
Acknowledgments
Supported by NIH grant GM05272 (PJH) and the generous support of the Graver Family Endowed Fund for Cancer Research.
Abbreviations
- TGF-β1
transforming growth factor-β1
- PAI-1
plasminogen activator inhibitor-1
- ROS
reactive oxygen species
- MEFs
mouse embryo fibroblasts
- HPTEC
human proximal tubular epithelial cells
- DMEM
Dulbecco’s modified Eagle’s Medium
- DPI
diphenyleneiodonium
- α-SMA
α-smooth muscle actin
- DCF-DA
dichlorofluorescein
- ChIP
chromatin immunoprecipitation
- PCR
polymerase chain reaction
- UUO
unilateral ureteral obstruction
- DAB
diaminobenzidine
- COX-2
cyclooxygenase
- CTGF
connective tissue growth factor
- NOX
NADP(H) oxidase
Footnotes
Author Contributions
JMO, RS and PJH conceived and designed the experiments; JMO and RS performed the experiments and analyzed the data; KKM contributed key reagents/materials; JMO, RS and PJH wrote the paper.
Disclosure
The authors have no conflict of interest.
Publisher's Disclaimer: This is a PDF file of an unedited manuscript that has been accepted for publication. As a service to our customers we are providing this early version of the manuscript. The manuscript will undergo copyediting, typesetting, and review of the resulting proof before it is published in its final citable form. Please note that during the production process errors may be discovered which could affect the content, and all legal disclaimers that apply to the journal pertain.
References
- 1.Lopez-Hernandez FJ, Lopez-Novoa JM. Cell Tissue Res. 2012;347:141–154. doi: 10.1007/s00441-011-1275-6. [DOI] [PubMed] [Google Scholar]
- 2.Toma I, McCaffrey TA. Cell Tissue Res. 2012;347:155–175. doi: 10.1007/s00441-011-1189-3. [DOI] [PMC free article] [PubMed] [Google Scholar]
- 3.Massague J. Cell. 2008;134:215–230. doi: 10.1016/j.cell.2008.07.001. [DOI] [PMC free article] [PubMed] [Google Scholar]
- 4.Derynck R, Zhang RYE. Nature. 2003;425:577–584. doi: 10.1038/nature02006. [DOI] [PubMed] [Google Scholar]
- 5.Cordenonsi M, Montagner M, Adorno M, Zacchigna L, Martello G, Mamidi A, Soligo S, Dupont S, Piccolo S. Science. 2007;315:840–843. doi: 10.1126/science.1135961. [DOI] [PubMed] [Google Scholar]
- 6.Tan CK, Leuenberger N, Tan MJ, Yan YW, Chen Y, Kambadur R, Wahli W, Tan NS. Diabetes. 2011;60:464–476. doi: 10.2337/db10-0801. [DOI] [PMC free article] [PubMed] [Google Scholar]
- 7.Yadav H, Quijano C, Kamaraju AK, Gavrilova O, Malek R, Chen W, Zerfas P, Zhigang D, Wright EC, Stuelten C, Sun P, Lonning S, Skarulis M, Sumner AE, Finkel T, Rane SG. Cell Metab. 2011;14:67–79. doi: 10.1016/j.cmet.2011.04.013. [DOI] [PMC free article] [PubMed] [Google Scholar]
- 8.Minamino T, Orimo M, Shimizu I, Kunieda T, Yokoyama M, Ito T, Nojima A, Nabetani A, Oike Y, Hatsubara H, Ishikawa F, Komuro I. Nat Med. 2009;15:1082–1087. doi: 10.1038/nm.2014. [DOI] [PubMed] [Google Scholar]
- 9.Li J, Qu X, Yao J, Caruana G, Ricardo SD, Yamamoto Y, Yamamoto H, Bertram JF. Diabetes. 2010;10:2612–2624. doi: 10.2337/db09-1631. [DOI] [PMC free article] [PubMed] [Google Scholar]
- 10.Brezniceanu ML, Liu F, Wei CC, Chenier I, Godin N, Zhang SL, Filep JG, Ingelfinger JR, Chan JS. Diabetes. 2007;57:451–459. doi: 10.2337/db07-0013. [DOI] [PubMed] [Google Scholar]
- 11.Sato M, Muragaki Y, Saika S, Roberts AB, Ooshima A. J Clin Invest. 2003;112:1486–1494. doi: 10.1172/JCI19270. [DOI] [PMC free article] [PubMed] [Google Scholar]
- 12.Yang L, Besschetnova TY, Brooks CR, Shah JV, Bonventre JV. Nat Med. 2010;16:535–543. doi: 10.1038/nm.2144. [DOI] [PMC free article] [PubMed] [Google Scholar]
- 13.Zeisberg EM, Tarnavaski O, Zeisberg M, Dorfman AL, McMullen JR, Gustafsson E, Chandraker A, Yuan X, Pu WT, Roberts AB, Neilson EG, Sayegh MH, Izumo S, Kalluri R. Nat Med. 2007;13:952–961. doi: 10.1038/nm1613. [DOI] [PubMed] [Google Scholar]
- 14.von der Thusen JH, van Vlijmen BJ, Hoeben RC, Kockx MM, Havekes LM, van Berkel TJ, Biessen EA. Circulation. 2002;17:2064–2070. doi: 10.1161/01.cir.0000015502.97828.93. [DOI] [PubMed] [Google Scholar]
- 15.Samarakoon R, Overstreet JM, Higgins SP, Higgins PJ. Cell Tissue Res. 2011;347:117–128. doi: 10.1007/s00441-011-1181-y. [DOI] [PMC free article] [PubMed] [Google Scholar]
- 16.Chevalier RL, Forbes MS, Thronhill BA. Kidney Int. 2009;75:1145–1152. doi: 10.1038/ki.2009.86. [DOI] [PubMed] [Google Scholar]
- 17.Kortlever RM, Higgins PJ, Bernards R. Nat Cell Biol. 2006;8:877–884. doi: 10.1038/ncb1448. [DOI] [PMC free article] [PubMed] [Google Scholar]
- 18.Samarakoon R, Higgins PJ. Thromb Haemost. 2008;100:976–983. [PMC free article] [PubMed] [Google Scholar]
- 19.Eddy AA, Fogo AB. J Am Soc Nephrol. 2006;17:2999–3012. doi: 10.1681/ASN.2006050503. [DOI] [PubMed] [Google Scholar]
- 20.Brown NJ. Ther Adv Cardiovasc Dis. 2009;4:315–324. doi: 10.1177/1753944710379126. [DOI] [PubMed] [Google Scholar]
- 21.Otsuka G, Agah R, Frutkin AD, Wight TN, Dichek DA. Arterioscler Thromb Vasc Biol. 2006;26:737–743. doi: 10.1161/01.ATV.0000201087.23877.e1. [DOI] [PubMed] [Google Scholar]
- 22.Samarakoon R, Overstreet JM, Higgins PJ. Cell Signal. 2013;1:264–268. doi: 10.1016/j.cellsig.2012.10.003. [DOI] [PMC free article] [PubMed] [Google Scholar]
- 23.Abe M, Harpel JG, Metz CN, Nunes I, Loskutoff DJ, Rifkin DB. Anal Biochem. 1994;216:276–284. doi: 10.1006/abio.1994.1042. [DOI] [PubMed] [Google Scholar]
- 24.Samarakoon R, Chitnis SS, Higgins SP, Higgins CE, Krepinsky JC, Higgins PJ. PLoS One. 2011;6:e22896. doi: 10.1371/journal.pone.0022896. [DOI] [PMC free article] [PubMed] [Google Scholar]
- 25.Komarov PG, Komarova EA, Kondratov RV, Christov-Tselkov K, Coon JS, Chernov MV, Gudkov AV. Science. 1999;285:1733–1737. doi: 10.1126/science.285.5434.1733. [DOI] [PubMed] [Google Scholar]
- 26.Meek DW, Anderson CW. Cold Spring Harb Perspect Biol. 2009;1:a000950. doi: 10.1101/cshperspect.a000950. [DOI] [PMC free article] [PubMed] [Google Scholar]
- 27.Riley T, Sontag E, Chen P, Levine A. Nat Rev Mol Cell Biol. 2008;9:402–412. doi: 10.1038/nrm2395. [DOI] [PubMed] [Google Scholar]
- 28.Feng XH, Zhang Y, Wu RY, Derynck R. Genes Dev. 1998;12:2153–2163. doi: 10.1101/gad.12.14.2153. [DOI] [PMC free article] [PubMed] [Google Scholar]
- 29.Samarakoon R, Dobberfuhl AD, Cooley C, Overstreet JM, Patel S, Goldschmeding R, Meldrum KK, Higgins PJ. Cell Signal. 2013;25:2198–2209. doi: 10.1016/j.cellsig.2013.07.007. [DOI] [PubMed] [Google Scholar]
- 30.Freed-Pastor WA, Mizuno H, Zhao X, Langerod A, Moon SH, Rodriguez-Barrueco R, Barsotti A, Chicas A, Li W, Polo9tskaia A, Bissell MJ, Osborne TF, Tian B, Lowe SW, Silva JM, Borresen-Dale AL, Levin AJ, Bargonetti J, Prives C. Cell. 2012;148:244–258. doi: 10.1016/j.cell.2011.12.017. [DOI] [PMC free article] [PubMed] [Google Scholar]
- 31.Adorno M, Cordenonsi M, Montagner M, Dupont S, Wong C, Hann B, Solari A>, Bobisse S, Rondina MB, Guzzardo V, Parenti AR, Rosato A, Bicciato S, Blamain A, Piccolo S. Cell. 2009;137:87–98. doi: 10.1016/j.cell.2009.01.039. [DOI] [PubMed] [Google Scholar]


