Abstract
Only a few studies, primarily limited to small samples, have examined the relationship between leukocyte telomere length (LTL) data generated by Southern blots, expressed in kilobases, versus quantitative PCR data, expressed in the telomere product/a single gene product (T/S). In the present study, we compared LTL data generated by the two methods in 681 elderly participants (50% African Americans, 50% of European origin, 49.2% women, mean age 73.7±2.9 years) in the Health Aging and Body Composition Study. The correlation between the data generated by the two methods was modest (R 2 = .27). Both methods captured the age effect on LTL and the longer LTL in women than in men. However, only the Southern blot method showed a significantly longer LTL in African Americans than in European decent individuals, which might be attributed to the larger measurement error of the quantitative PCR–based method than the Southern blots.
Key Words: Leukocyte telomere length, Quantitative PCR, Southern blots.
Leukocyte telomere length (LTL) is heritable (1–3), inversely related to age, and is typically longer in women than in men (4–8). However, inconsistent findings have been reported about whether there is a difference in LTL between African Americans (AfAms) and European decent individuals (EDIs). Studies that measured LTL by Southern blots of the mean length of the terminal restriction fragments (TRFs) reported that LTL was longer in AfAms than EDIs (9,10). In contrast, studies using the quantitative PCR (qPCR)-based method to quantify telomere DNA content (expressed in telomere DNA [T]/reference single gene [S] ratio) in leukocytes reported mixed findings. Some of these studies found a lower leukocyte T/S ratio in AfAms than EDIs (7,11), whereas others observed a higher T/S ratio in AfAms than EDIs (4,9,12). Whether LTL is related to age, sex, and ethnicity is highly relevant because a shorter LTL has been linked to cardiovascular disease, primarily in EDIs (13). In this study, we have leveraged existing data and leukocyte DNA samples from the Health Aging and Body Composition (ABC) Study (14) to (a) examine the relationship between LTL data derived from Southern blots versus that derived from of the qPCR method in a sample comprising both AfAms and EDIs and (b) examine the association of LTL data derived from both measurement techniques with age, sex, and ethnicity.
Methods
Participants
The Health ABC Study is a longitudinal study comprising 3,075 elderly individuals (50% men, 40% AfAms, aged 70–79 years at baseline examination), who have been residing in Pittsburgh, Pennsylvania, and Memphis, Tennessee. The design, sampling strategies, and examination techniques of the cohort have been described previously (14). All participants gave their written informed consent, and the Institutional Review Board of the University of Pittsburgh and the University of Tennessee approved the study.
Comparisons of LTL measurements by Southern blots and qPCR were performed in a subset of the cohort, comprising 681 participants (50% AfAms, 50% EDIs, 49.2% women, mean age 73.7±2.9 years). DNA samples for measurements of LTL by Southern blot analysis were selected based on the availability of DNA and prior results in the database of the Health ABC Study of leukocyte T/S ratio (Table 1). Samples were only included in this study if LTL was measured using both methods.
Table 1.
Baseline Parameters of 681 Health Aging and Body Composition Participants That Were Included in This Study
| Parameter | EDIs (N = 340), mean (SD) | AfAms (N = 341), mean (SD) |
|---|---|---|
| Age (y) | 73.7 (2.9) | 73.6 (2.8) |
| BMI (kg/m2) | 26.7 (4.3) | 28.9 (5.3) |
| N (%) | N (%) | |
| Female participants | 171 (50.3) | 164 (48.1) |
| Smoking | 189 (55.6) | 190 (55.7) |
| LTL | Median | Median |
| qPCR (T/S ratio) | 1.09 | 1.12 |
| Southern blots (kb)* | 6.01 | 6.22 |
Notes: AfAms = African Americans; BMI = body mass index; EDIs = European descent individuals; LTL = leukocyte telomere length; qPCR = quantitative PCR.
*Measured in DNA from the second year of data collection.
Measurements of LTL
The T/S ratio (15), measured by qPCR, and the mean TRF length (16), measured by Southern blot, were obtained as previously described. The measurement error, expressed in the interassay coefficient of variation (CV), of the qPCR data was 5.8% in all participants in the Health ABC cohort in whom mean LTL was measured at baseline (17). T/S ratio was determined in DNA that was collected at baseline (mean age of participants 73.7 ± 2.9 years); TRF length was measured in DNA that was collected in the second year of data collection (mean age 74.7±2.9 years). Only mean T/S values were available in the database of the Health ABC Study. The Southern blots were performed in duplicate on different gels and occasions. The interassay CV of these duplicates was 1.5%.
Data Analysis
Linear regression was used to obtain the correlation between the methods of T/S ratio and the mean TRF length, both in a univariate model and a multivariate model. As measures of LTL by both qPCR and Southern blot were not normally distributed, we performed regression analyses on inverse transformed values. To assess the associations of LTL (as dependent variable) with age, sex, and ethnicity, we used a multivariate linear regression model. For analyses related to T/S ratio, we added the batch number as a covariate in the model to account for batch effects. Statistical analyses were performed using the Statistical Package for the Social Sciences (version 19). Population characteristics were described using mean and SD (for normally distributed variables), median (for the LTL measures that failed to satisfy the assumption of normality), and number and frequency (for categorical variables). Statistical significance was set at p < .05.
Results
General Characteristics
The AfAm and EDI subcohorts were of similar age and displayed similar sex ratios (Table 1). Our sample displayed a narrow age range of about a decade and wide interindividual variation in LTL.
Correlation between the qPCR and Southern blot data.—
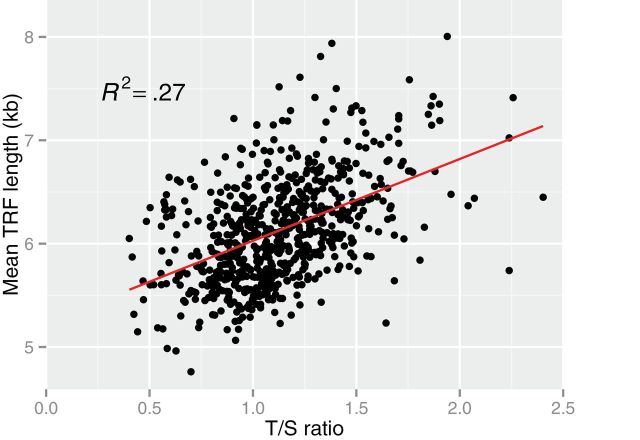
The linear relation between the TRF length and the T/S ratio, although highly significant, was modest (R 2 = .27; Figure 1). Adjusting for age, sex, and ethnicity did not change the correlation (R 2 = .27). We also tested a curvilinear model but found no improvement in the correlation.
Figure 1.
The relation between mean terminal restriction fragment (TRF) length and the T/S ratio in 679 participants. Analyses were adjusted for batch effect in the quantitative PCR measurements. Two outliers were excluded as their T/S ratios were four times the SD away from the mean.
The associations of LTL (based on qPCR and Southern blot data) with age, sex, and ethnicity.—
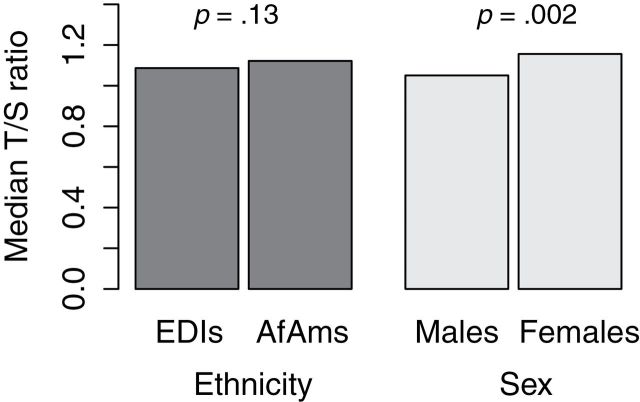
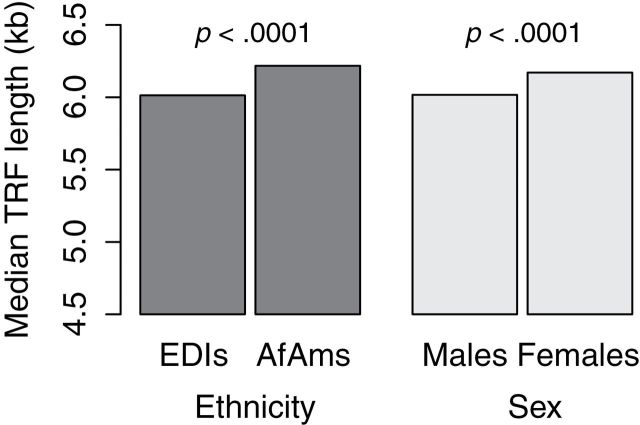
In spite the narrow age range of the cohort, both the T/S ratio and the mean TRF length showed significant and inverse association with age (p = .04 for qPCR values and p = .009 for Southern blot measures; Table 2). Multivariate adjustment by sex and ethnicity attenuated the association with a p = .07 for qPCR values and a p = .02 for Southern blot measures. In addition, based on both the T/S ratio and the mean TRF length, women displayed a significantly longer univariate- and multivariate-adjusted LTL compared with men (p = .001 [univariate] and p = .002 [multivariate] for qPCR measures and p < .0001 for Southern blot measures; Figure 2). However, although the Southern blot data showed a significant association for ethnicity with LTL, with AfAms displaying a longer LTL than for EDIs (p < .0001; Figure 3), based on the qPCR data, the association between ethnicity and LTL was not significant (p = .13; Figure 2). Adjustment for sex and age did not change these association for both qPCR and Southern blots.
Table 2.
Association of Age With LTL Length, Measured by T/S Ratio and TRF Length
| Parameter | Beta (SD) | p Value |
|---|---|---|
| T/S ratio | −0.73 (0.38) | .04 |
| T/S ratio, adjusted model* | −0.63 (0.38) | .07 |
| TRF length | −0.43 (0.22) | .009 |
| TRF length, adjusted model† | −0.39 (0.22) | .02 |
Notes: LTL = leukocyte telomere length; TRF = terminal restriction fragment.
*Adjusted for batch, sex, and ethnicity.
†Adjusted for sex and ethnicity.
Figure 2.
Median leukocyte telomere length by sex and ethnicity, measured by quantitative PCR–based method and Southern blot analysis. p Values are adjusted for batch number to account for batch effect.
Figure 3.
Median leukocyte telomere length by sex and ethnicity, measured by Southern blot analysis.
Discussion
This is the largest study that has compared LTL, measured by qPCR, with that measured by Southern blots. Previous work, limited to small sample size, showed stronger correlations of the T/S ratio with the mean TRF length data (R 2 = .68–.83) than the present work (15,18–20). Moreover, two of these works (19,20) found that the best fit of the relation between the Southern blot and qPCR data was curvilinear. Close inspection of the other two studies (15,18) suggests a similar trend. In the present study, a linear model showed a comparable estimate with a curvilinear model.
As the mean age of participants in the Health ABC Study is high (73.7±2.9 years), a survival bias that affects the results cannot be excluded. Individuals that died prior to reaching age 70 could never have been selected for this elderly Health ABC cohort, leaving in the “survivors” with relatively longer telomeres and a narrower range in LTL. However, our study aims to investigate the relationship of the two measures of LTL, and all samples with the same survival bias are included in both the Southern blot measurements and the qPCR measurements.
Cross-sectionally, our sample displayed a narrow age range of about a decade and wide interindividual variation in LTL. Yet, in spite of only modest correlation between the mean TRF length and T/S ratio, both the qPCR and Southern blot data showed that LTL was inversely correlated with age and that women had a longer LTL than men. However, although the Southern blot method easily detected a significantly longer LTL in AfAms than EDIs, the qPCR-based method detected a nonsignificant difference between the two ethnic groups.
One potential explanation for the discrepancy between the qPCR and Southern blot data in general and with respect to ethnicity is that while the qPCR method only measures the canonical region (strictly TTAGGG repeats), the Southern blot method measures both the canonical region and the subtelomeric (noncanonical) region up to the nearest restriction site, which is the target of the restriction enzymes used to generate the TRFs. The low correlation between mean TRF length and qPCR measurement could be attributed by interdonor variability in the size of the nontelomeric component of the TRF. It is possible, therefore, that the longer LTL in AfAms versus EDIs, based on the Southern blot data, might stem from a longer subtelomeric region in AfAms due to polymorphic differences in the restriction sites between the two ethnic groups. However, three lines of evidence suggest that this is unlikely to be the explanation. First, other studies that used qPCR also found that AfAms had a longer LTL than EDIs (4,9,12). Second, a study that employed both Southern blots and qPCR methods to measure LTL observed a longer LTL in young adult AfAms than in EDIs using both methods (9). Third, to further exclude the potential influence of polymorphic differences in the restriction sites between the two ethnic groups, that study also used two different cocktails of restriction enzymes (HinfI/RsaI or HphI/MnII) (9). These two cocktails of restriction enzymes yield different admixtures of TRFs comprising both canonical and noncanonical telomere repeats at the proximal region of the telomeres. Both showed that LTL was longer in AfAms than in EDIs (9). Notably, the ethnic difference in LTL narrows with age (9), and the mean ages of participants in studies showing by qPCR and Southern blots a longer LTL in AfAms than in EDIs were considerably younger than that of participants of the present study. The measurement error, expressed in the interassay CV, of the qPCR data was 5.8% in the entire Health ABC Study (17). Based on an impartial comparison, the CV of the qPCR is almost four times larger than that of the Southern blots (19), which is confirmed in this study. It is thus possible that the higher measurement error of the qPCR than the Southern blots explains the difference between the two methods with respect to the ethnicity effect on LTL. Notably, a modified qPCR-based method of telomere DNA content has more recently reported an interassay CV of 3.13% (18), and it is possible that this method might be able to show the difference in LTL.
In conclusion, in the largest study of its kind, we observed only a modest correlation between the qPCR and Southern blot results of LTL. Both methods captured the effect of age and sex on LTL, but the Southern blot method was better in capturing the effect of ethnicity on LTL.
Funding
CCE was supported by a Rubicon grant from the Netherlands Organization for Scientific Research (NWO). AA’s NIH research support for this work includes R01AG030678 and R01HD071180.
Conflict of Interest
None declared.
References
- 1. Slagboom PE, Droog S, Boomsma DI. Genetic determination of telomere size in humans: a twin study of three age groups. Am J Hum Genet. 1994;55:876–882 [PMC free article] [PubMed] [Google Scholar]
- 2. Vasa-Nicotera M, Brouilette S, Mangino M, et al. Mapping of a major locus that determines telomere length in humans. Am J Hum Genet. 2005;76:147–151 [DOI] [PMC free article] [PubMed] [Google Scholar]
- 3. Andrew T, Aviv A, Falchi M, et al. Mapping genetic loci that determine leukocyte telomere length in a large sample of unselected female sibling pairs. Am J Hum Genet. 2006;78:480–486 [DOI] [PMC free article] [PubMed] [Google Scholar]
- 4. Zhu H, Wang X, Gutin B, et al. Leukocyte telomere length in healthy Caucasian and African-American adolescents: relationships with race, sex, adiposity, adipokines, and physical activity. J Pediatr. 2011;158:215–220 [DOI] [PMC free article] [PubMed] [Google Scholar]
- 5. Honig LS, Kang MS, Schupf N, Lee JH, Mayeux R. Association of shorter leukocyte telomere repeat length with dementia and mortality. Arch Neurol. 2012;69:1332–1339 [DOI] [PMC free article] [PubMed] [Google Scholar]
- 6. Kark JD, Goldberger N, Kimura M, Sinnreich R, Aviv A. Energy intake and leukocyte telomere length in young adults. Am J Clin Nutr. 2012;95:479–487 [DOI] [PMC free article] [PubMed] [Google Scholar]
- 7. Njajou OT, Hsueh WC, Blackburn EH, et al. ; Health ABC Study. Association between telomere length, specific causes of death, and years of healthy life in health, aging, and body composition, a population-based cohort study. J Gerontol A Biol Sci Med Sci. 2009;64:860–864 [DOI] [PMC free article] [PubMed] [Google Scholar]
- 8. Vasan RS, Demissie S, Kimura M, et al. Association of leukocyte telomere length with circulating biomarkers of the renin-angiotensin-aldosterone system: the Framingham Heart Study. Circulation. 2008;117:1138–1144 [DOI] [PMC free article] [PubMed] [Google Scholar]
- 9. Hunt SC, Chen W, Gardner JP, et al. Leukocyte telomeres are longer in African Americans than in whites: the National Heart, Lung, and Blood Institute Family Heart Study and the Bogalusa Heart Study. Aging Cell. 2008;7:451–458 [DOI] [PMC free article] [PubMed] [Google Scholar]
- 10. Fitzpatrick AL, Kronmal RA, Gardner JP, et al. Leukocyte telomere length and cardiovascular disease in the cardiovascular health study. Am J Epidemiol. 2007;165:14–21 [DOI] [PubMed] [Google Scholar]
- 11. Diez Roux AV, Ranjit N, Jenny NS, et al. Race/ethnicity and telomere length in the Multi-Ethnic Study of Atherosclerosis. Aging Cell. 2009;8:251–257 [DOI] [PMC free article] [PubMed] [Google Scholar]
- 12. Hofmann JN, Baccarelli A, Schwartz K, et al. Risk of renal cell carcinoma in relation to blood telomere length in a population-based case-control study. Br J Cancer. 2011;105:1772–1775 [DOI] [PMC free article] [PubMed] [Google Scholar]
- 13. Aviv A. Genetics of leukocyte telomere length and its role in atherosclerosis. Mutat Res. 2012;730:68–74 [DOI] [PMC free article] [PubMed] [Google Scholar]
- 14. Visser M, Pahor M, Tylavsky F, et al. One- and two-year change in body composition as measured by DXA in a population-based cohort of older men and women. J Appl Physiol. 2003;94:2368–2374 [DOI] [PubMed] [Google Scholar]
- 15. Cawthon RM. Telomere measurement by quantitative PCR. Nucleic Acids Res. 2002;30:e47. [DOI] [PMC free article] [PubMed] [Google Scholar]
- 16. Kimura M, Stone RC, Hunt SC, et al. Measurement of telomere length by the Southern blot analysis of terminal restriction fragment lengths. Nat Protoc. 2010;5:1596–1607 [DOI] [PubMed] [Google Scholar]
- 17. Sanders JL, Cauley JA, Boudreau RM, et al. Health ABC Study. Leukocyte telomere length is not associated with BMD, osteoporosis, or fracture in older adults: results from the Health, Aging and Body Composition Study. J Bone Miner Res. 2009;24:1531–1536 [DOI] [PMC free article] [PubMed] [Google Scholar]
- 18. Cawthon RM. Telomere length measurement by a novel monochrome multiplex quantitative PCR method. Nucleic Acids Res. 2009;37:e21. [DOI] [PMC free article] [PubMed] [Google Scholar]
- 19. Aviv A, Hunt SC, Lin J, Cao X, Kimura M, Blackburn E. Impartial comparative analysis of measurement of leukocyte telomere length/DNA content by Southern blots and qPCR. Nucleic Acids Res. 2011;39:e134. [DOI] [PMC free article] [PubMed] [Google Scholar]
- 20. Kimura M, Aviv A. Measurement of telomere DNA content by dot blot analysis. Nucleic Acids Res. 2011;39:e84. [DOI] [PMC free article] [PubMed] [Google Scholar]


