

Abstract
Spinal muscular atrophy (SMA) is characterized by motor neuron loss, caused by mutations or deletions in the ubiquitously expressed survival motor neuron 1 (SMN1) gene. We recently identified a novel role for Smn protein in glucose metabolism and pancreatic development in both an intermediate SMA mouse model (Smn2B/−) and type I SMA patients. In the present study, we sought to determine if the observed metabolic and pancreatic defects are SMA-dependent. We employed a line of heterozygous Smn-depleted mice (Smn+/−) that lack the hallmark SMA neuromuscular pathology and overt phenotype. At 1 month of age, pancreatic/metabolic function of Smn+/−mice is indistinguishable from wild type. However, when metabolically challenged with a high-fat diet, Smn+/−mice display abnormal localization of glucagon-producing α-cells within the pancreatic islets and increased hepatic insulin and glucagon sensitivity, through increased p-AKT and p-CREB, respectively. Further, aging results in weight gain, an increased number of insulin-producing β cells, hyperinsulinemia and increased hepatic glucagon sensitivity in Smn+/−mice. Our study uncovers and highlights an important function of Smn protein in pancreatic islet development and glucose metabolism, independent of canonical SMA pathology. These findings suggest that carriers of SMN1 mutations and/or deletions may be at an increased risk of developing pancreatic and glucose metabolism defects, as even small depletions in Smn protein may be a risk factor for diet- and age-dependent development of metabolic disorders.
INTRODUCTION
Spinal muscular atrophy (SMA) is a genetically inherited neuromuscular disorder. It is responsible for more infant deaths than any other known genetically inherited disease, affecting 1 in 6000–10 000 live births (1,2). SMA is caused by deletions or mutations within the survival motor neuron 1 (SMN1) gene (3). SMN depletion results in the degeneration of spinal cord motor neurons, muscle atrophy and paralysis (1). While the complete loss of Smn protein is embryonic lethal (4), a recent duplication event in humans gave rise to the SMN2 copy gene (3). A critical C to T substitution in exon 7 of the SMN2 gene results in aberrant exon 7 splicing and the production of an unstable SMNΔ7 protein (3,5). However, the SMN2 gene still produces a small percentage of full-length (FL) Smn protein, enough to circumvent embryonic lethality but not motor neuron degeneration. Disease severity is dependent on SMN2 copy number; the more copies, the lesser the disease impact (3,6).
To explain the specific loss of spinal cord motor neurons in SMA, various neuronal roles have been proposed for the Smn protein, such as axonal outgrowth and pathfinding (7,8), axonal transport (9,10), regulation of actin dynamics (11–14), small nuclear ribonucleoprotein (snRNP) biogenesis (15–17) and regulation of mRNA translation (18). More recently, non-neuronal roles for Smn have been uncovered at the neuromuscular junction (NMJ) (19–21), in the muscle (22–24), and in the heart (25–27). Furthermore, recent work from our laboratory has identified a novel role for Smn in glucose metabolism and pancreatic development (28). Analysis of an intermediate SMA mouse model, Smn2B/−, revealed fasting hyperglycemia, hyperglucagonemia, glucose resistance as well as a dramatic increase in glucagon-producing α-cells at the expense of insulin-producing β-cells within pancreatic islets. Analysis of pancreatic islets from deceased type 1 SMA children demonstrated similar abnormalities in islet composition. A subset of these patients also suffered glucose intolerance.
In the present study, we sought to determine if metabolic and pancreatic defects observed in Smn2B/−mice are SMA-dependent or can occur in the absence of any overt neurological abnormalities. To this end, we analyzed Smn heterozygous mice (Smn+/−), a model devoid of an overt SMA phenotype (4). We report that non-pathological Smn depletion results in abnormal α-cell localization within pancreatic islets, increased β cell number over time, increased hepatic insulin and glucagon sensitivity, and hyperinsulinemia. Our study uncovers and highlights a functional role for Smn protein in pancreatic islet development and glucose metabolism independent of canonical SMA pathology. These findings suggest carriers of SMN1 mutations and/or deletions [and SMA patients undergoing partial Smn expression restoration therapies (29,30)] may be at an increased risk of developing pancreatic and metabolic defects later in life. Thus, SMN depletion, even ‘non-pathological’, may be a risk factor for the age-dependent development of metabolic disorders.
RESULTS
Pancreatic Smn expression
We recently demonstrated dramatic defects in pancreatic islet composition and glucose metabolism in an intermediate SMA mouse model (28). However, it remains unclear if these abnormalities were SMA-dependent or independent. To address this question, we analyzed Smn heterozygous mice (Smn+/−). These animals have reduced Smn levels (∼50% of wild type) but do not display any overt neurodegeneration and/or neuromuscular phenotype typical of SMA pathogenesis (4). We first assessed pancreatic Smn protein levels from P21 mice. Fluorescent immunoblot analysis demonstrates abundant levels of Smn protein in wild-type pancreas with a significant reduction in Smn+/−mice (Fig. 1A and B). The heterozygotes therefore provide a useful model to study pancreatic development and glucose metabolism independent of the canonical SMA phenotype.
Figure 1.

Smn+/− mice do not display canonical SMA pathological hallmarks. (A) Fluorescent immunoblot analysis of Smn protein levels in the pancreas of P21 wild type (WT) and Smn+/− mice shows high levels in WT animals with an observable decrease in the pancreas of Smn+/− mice. Actin served as a loading control. (B) Quantification of Smn/Actin ratio from the pancreas of P21 WT (n = 3) and Smn+/− (n = 3) mice. (Data are mean ± SD; t-test; *P = 0.02.) (C) Representative images of motor neuron cell bodies within the ventral horn region of the lumbar spinal cord labeled with Nissl (green). Scale bar = 100 μm. (D) Quantification of the number of motor neuron cell bodies within the ventral horn area of the lumbar spinal cord of 5–month-old wild-type (WT) and Smn+/− mice shows no significant difference between groups. (Data are mean ± SD; t-test; NS = not significant.) (E) Representative images of TVA NMJs from 1-year-old WT and Smn+/− mice. Neurofilament (NF) and synaptic vesicle protein 2 (SV2) denote the pre-synaptic portion of the NMJ (red) and Bungarotoxin (Btx) the postsynaptic portion (green). NMJs from Smn+/− mice are morphologically normal, with >98% complete innervation. Scale bar = 85 μm. (F) Representative cross-sections of the tibialis anterior (TA) muscle of 5-month and 1-year-old WT and Smn+/− mice stained with hematoxylin and eosin. Scale bar = 100 μm. (G) Frequency distribution histograms of TA myofiber areas and their respective Gaussian fit reveal similar TA myofiber sizes between 5-month and 1-year-old WT and Smn+/− mice.
Smn+/− mice do not display canonical SMA neuromuscular pathology even at later stages
When first described, Smn+/− mice lacked the typical SMA motor neuron loss (4). However, subsequent investigation suggested mild pathology later in life (31). We therefore sought to characterize our Smn+/− line and establish whether mild motor neuron and/or muscle SMA-like pathology was present in our aged model (5 months and 1 year). We first quantified motor neuron cell body number in the ventral horn of the lumbar spinal cord. At 5 months, no significant difference was observed between wild-type and Smn+/− littermates (Fig. 1C and D). Another hallmark of early SMA pathology is NMJ denervation, seen in muscles such as the transversus abdominis (TVA) (21,32). Relative to wild type, TVA NMJs from 1-year-old Smn+/− mice appeared healthy and did not exhibit signs of denervation (Fig. 1E). Greater than 98% of NMJ endplates from 1 year old Smn+/− mice were fully occupied, pointing to a general lack of motor axon degeneration. Finally, as SMA mice are also characterized by severe skeletal muscle atrophy (33), we measured the cross-sectional area of tibialis anterior (TA) myofibers from 5-month and 1-year-old mice. At both time points, wild-type and Smn+/− mice show similar frequency distributions of TA myofiber area (Fig. 1F and G), suggesting that Smn+/− mice, at least up to 1 year of age, do not display skeletal muscle atrophy that normally typifies SMA. Older Smn+/− mice are therefore devoid of motor neuron loss, NMJ denervation and muscle atrophy, pointing to an absence of the canonical SMA phenotype. These results are consistent with our previous findings in Smn2B/2B mice, another Smn-depleted model, which appear phenotypically normal (32). While we cannot fully consolidate discrepancies between our characterization of the Smn+/− mouse model and that of others (4,31), we are the first to go beyond spinal cord motor neuron counts—taking into account neurodegenerative outcomes—and convincingly demonstrate an absence of gross motor neuron degeneration.
Smn depletion does not impact glucose metabolism in 1-month-old mice
Smn2B/−mice, an intermediate SMA mouse model, display fasting hyperglycemia and glucose resistance at a young age (28). We assessed the impact of non-pathological Smn depletion by fasting 1-month-old wild type and Smn+/−mice overnight, followed by an intraperitoneal glucose tolerance test (IPGTT). Comparison of both random-fed and fasting glucose levels between groups did not reveal any gross metabolic abnormalities (Fig. 2A). The IPGTT curves also suggest the absence of glucose defects in 1-month-old Smn-depleted mice, as both groups displayed similar glucose clearance over time (Fig. 2B). Further, quantification of the area under the curve (AUC) for the IPGTT revealed no significant differences (Fig. 2C).
Figure 2.

Glucose metabolism, pancreatic composition and insulin and glucagon serum levels are similar between 1-month-old wild-type and Smn+/− mice. (A) Random fed and fasting glucose levels are not significantly different between WT (n = 4) and Smn+/− (n = 4) mice. (Data are mean ± SD; t-test; NS, not significant.) (B) WT (n = 4) and Smn+/− (n = 4) mice were fasted overnight, followed by an IPGTT test. Comparison of IPGTT curves reveals similar glucose clearance in 1-month-old WT and Smn+/− mice. (Data are mean ± SD; multiple t-test.) (C) Quantification of the IPGTT area under the curve (AUC) indicates no significant difference between 1-month-old WT and Smn+/− mice. (Data are mean ± SD; t-test; NS, not significant.) (D) Representative images of pancreatic islets from WT and Smn+/− mice co-labeled with insulin (β-cells, red) and glucagon (α-cells, green). Scale bar = 100 μm. (E) Quantification of the ratio of the number of α-cells/number of β-cells per pancreatic islet in 1-month-old WT (n = 3) and Smn+/− (n = 4) mice shows no significant difference in islet composition. (Data are mean ± SD; t-test; NS, not significant.) (F) Serum insulin (left) and glucagon (right) levels are not significantly different between random fed 1-month-old WT (n = 3) and Smn+/− (n = 4) mice. (Data are mean ± SD; t-test; NS, not significant.)
We previously reported a dramatic increase in pancreatic islet α-cell number at the expense of β-cells in young Smn2B/− mice (28). We thus performed immunohistochemistry labeling for insulin-producing β-cells and glucagon-producing α-cells on pancreatic tissue of 1-month-old wild-type and Smn+/−mice (Fig. 2D). Analysis revealed no significant difference in α- and β-cell number between wild-type and Smn+/− mice (Fig. 2E). Serum analysis from random-fed wild-type and Smn+/−mice demonstrated no significant shift in circulating insulin or glucagon levels (Fig. 2F). Our results, not unexpectedly, suggest normal metabolic/pancreatic function during early development in a non-pathological Smn-depletion mouse model.
High-fat diet influences glucose clearance and α-cell localization in Smn-depleted mice
As 1-month-old Smn+/−mice do not display metabolic/pancreatic abnormalities, we next assessed the Smn-depleted model under metabolic stress conditions. P21 males were placed on either a regular diet (RD; 18% calories from fat) or a high-fat diet (HFD; 45% calories from fat) for 16 weeks. The mice were weighed every 4 weeks. Weight curve comparisons demonstrated similar weight gains between wild-type and Smn+/−mice on both RD and HFD (Fig. 3A).
Figure 3.

Diet-induced obesity affects glucose clearance in Smn+/− mice. At P21, WT [n = 5 (RD), 4 (HFD)] and Smn+/− [n = 4 (RD and HFD)] males were placed either on a regular (RD) or high-fat diet (HFD) for 16 weeks. Mice were weighed every 4 weeks. At the end of the 16-week diet, mice were fasted overnight, followed by an IPGTT test. (A) Comparison of weight curves of mice on the RD (left) and HFD (right) shows similar weight gains between WT and Smn+/− mice. (Data are mean ± SD; multiple t-test.) (B) Glucose levels of random fed and fasted WT and Smn+/− mice on both the RD (left) and HFD (right) are not significantly different. (Data are mean ± SD; two-way ANOVA; NS, not significant.) (C) Comparison of IPGTT curves of WT and Smn+/− mice on the RD reveals similar glucose clearance between groups. (Data are mean ± SD; multiple t-test.) (D) The IPGTT AUC of WT and Smn+/− mice on the RD are not significantly different. (Data are mean ± SD; t-test; NS, not significant.) (E) Comparison of IPGTT curves of WT and Smn+/− mice on the HFD displays significantly more glucose in Smn+/− mice 120 min following the IP of glucose. (Data are mean ± SD; multiple t-test; *P = 0.01.) (F) Comparison of the IPGTT AUC of WT and Smn+/− mice on the HFD is not significantly different. (Data are mean ± SD; t-test; NS, not significant.)
To evaluate the effect of HFD on glucose metabolism in Smn-depleted males, we performed an IPGTT on mice fasted overnight following the 16-week diet. Comparison of random-fed and fasting glucose levels for mice on both RD and HFD revealed no significant difference between wild-type and Smn+/−animals (Fig. 3B). Analysis of RD IPGTT curves also demonstrates normal glucose clearance at all time points in the Smn-depleted model (Fig. 3C). Further, no difference in AUC was observed for the two genotypes (Fig. 3D). Interestingly, glucose clearance in Smn+/− mice was affected by the 16-week HFD regimen. In wild-type mice, glucose levels peaked at 30 min post-IP followed by a steady decline toward baseline (Fig. 3E). Similarly, glucose levels peaked at 30 min post-IP in Smn+/− mice, but then failed to revert. Instead, glucose levels plateaued over 90 min, indicating glucose intolerance in Smn-depleted mice (Fig. 3E). Analysis of AUC for the HFD, whereas higher in the Smn+/− mice, was not significant relative to wild type (Fig. 3F). Our results suggest that while Smn+/− mice on RD tolerate large shifts in blood glucose, a combination of HFD and Smn depletion manifests as an inability to maintain glucose homeostatic balance.
We next assessed islet composition of mice placed on RD or HFD. Pancreatic sections were co-labeled for insulin-producing β-cells and glucagon-producing α-cells (Fig. 4A). On either the RD or HFD, cellular composition for each islet (measured as an α- to β-cell ratio) was similar between wild-type and Smn+/−mice (Fig. 4A–C).
Figure 4.

Abnormal localization of pancreatic islet α-cells in Smn+/− mice is diet-independent. At P21, WT [n = 5 (RD), 4 (HFD)] and Smn+/− [n = 4 (RD and HFD)] males were placed either on an RD or HFD for 16 weeks. At the end of the 16-week diet, whole pancreas was collected and sectioned. (A) Representative images of pancreatic islets of WT and Smn+/− mice on the RD and HFD co-labeled with insulin (β-cells, red) and glucagon (α-cells, green). Scale bar = 100 μm. (B and C) Quantification of the ratio of the number of α-cells/number of β-cells per pancreatic islet in mice on the RD (B) and HFD (C) shows similar islet composition between WT and Smn+/− mice. (Data are mean ± SD; t-test; NS, not significant.) (D) Islet size of WT and Smn+/− mice on both the RD (left) and HFD (right) is not significantly different. (Data are mean ± SD; t-test; NS, not significant.) (E) Quantification of percentage of islets containing abnormally localized α-cells within the islet core demonstrates a significant increase in Smn+/− mice on both the RD (left) and HFD (right). [Data are mean ± SD; *P = 0.04 (RD) and 0.02 (HFD).]
A significant loss of β-cell mass was observed in the pancreas of the Smn2B/− SMA model mice (28). Since a positive correlation exists between β-cell mass and islet size (34), we measured the area of the largest islets per pancreatic section to determine the effect of non-pathological Smn-depletion on β-cell mass. We found no significant difference in islet size between wild-type and Smn+/−mice on either the RD or HFD (Fig. 4D), suggesting islet size is not altered when Smn levels are reduced. We did, however, observe a significant increase in abnormally located α cells within the islet core of Smn+/− mice (Fig. 4E). Murine islets are typically composed of a β-cell core and a non-β-cell mantle. Importantly, previous reports have highlighted the functional requirement of cell–cell contact between neighbor β-cells (35–38). Aberrant α-cell localization within Smn+/− islet cores may therefore impede β-cell function possibly altering the ability of the mice to properly respond to spikes in blood glucose (as observed in Fig. 3E).
Increased hepatic insulin and glucagon sensitivity in Smn-depleted mice
Our previous work with the Smn2B/− mice revealed an intriguing phenotype—the mice were hyperglucagonemic but retained normal insulin levels (28). We therefore explored whether a similar phenotype was at play in Smn+/−mice placed on the 16-week RD or HFD. Analysis of serum insulin and glucagon levels showed no significant difference between wild-type and Smn+/−mice for either the RD or HFD (Fig. 5A and B), suggesting non-pathological Smn depletion does not affect circulating levels of either hormone even in combination with a 16-week metabolic stress diet.
Figure 5.

Increased hepatic insulin and glucagon sensitivity in Smn+/− mice. At P21, WT [n = 5 (RD), 4 (HFD)] and Smn+/−males [n = 4 (RD and HFD)] were placed either on an RD or HFD for 16 weeks. At the end of the 16-week diet, serum and liver tissues were collected from random fed mice. (A) There is no significant difference between insulin serum levels of WT and Smn+/− mice on both the RD and HFD. (Data are mean ± SD; t-test; NS, not significant.) (B) There is no significant difference between glucagon serum levels of WT and Smn+/− mice on both the RD and HFD. (Data are mean ± SD; t-test; NS, not significant.) (C) Representative immunoblots of p-AKT and total AKT protein in the livers of WT and Smn+/− mice on an RD and HFD. Images were cropped from the same immunoblot. (D) Quantification of the p-AKT/total AKT ratios reveals that there is no significant difference between WT (n = 4) and Smn+/− (n = 4) mice on the RD. On the HFD, however, p-AKT/total AKT ratios of Smn+/− (n = 4) mice are significantly higher compared with WT (n = 4), suggesting increased hepatic insulin sensitivity. [Data are mean ± SD; t-test; NS, not significant (RD); ***P = 0.007 (HFD)]. (E) Representative immunoblots of p-CREB and total CREB protein in the livers of WT and Smn+/− mice on an RD and HFD. Images were cropped from the same immunoblot. (F) Quantification of p-CREB/total CREB ratios reveals a significant increase in p-CREB levels in Smn+/− mice on both the RD (left) (n = 3) and HFD (right) (n = 3) compared with WT mice (n = 3 for RD and HFD), indicative of increased glucagon sensitivity. [Data are mean ± SD; t-test; ***P = 0.0003 (RD); **P = 0.0015 (HFD).]
Our initial work on the Smn2B/− SMA model mice also revealed a significant increase in hepatic p-AKT (28), a marker for increased insulin sensitivity (reviewed in 39). To determine whether the observed increase would carry over into the Smn+/−mice, we performed immunoblot analysis of livers from random-fed wild-type and Smn+/−mice on both RD and HFD. There was no significant difference in p-AKT levels between wild-type and Smn heterozygotes on RD, suggesting similar hepatic insulin sensitivities (Fig. 5C and D). However, in HFD-fed wild-type mice, we observed a decrease in p-AKT (relative to RD) (Fig. 5C and D), typical of diet-induced hepatic insulin resistance (reviewed in 39). Interestingly, HFD Smn+/−mouse livers have significantly more p-AKT than wild type (Fig. 5C and D), implying an increase in hepatic insulin sensitivity. The observed increase suggests metabolic stress coupled with partial Smn loss sensitizes the liver to insulin. Taking into account normal insulin and glucagon levels in HFD Smn+/− mice (Fig. 5A and B), we believe insulin sensitization is compensatory for a general decrease in ability of HFD Smn+/− mice to adequately clear high glucose levels (as observed in Fig. 3E). However, we cannot exclude the possibility that HFD Smn+/− mice are unable to produce requisite levels of insulin over the time course measured (for the forced glucose spike), as we assessed blood insulin at baseline only. The earlier observed disruption of cell–cell contact between β cells (and therefore function, see Fig. 4E) by α-cell mislocalization could potentially explain such an outcome.
We next evaluated hepatic glucagon sensitivity in Smn-depleted mice through p-CREB analysis, an upstream effector of the hepatic glucagon signaling pathway (reviewed in 40,41). Livers from Smn+/−mice were analyzed to determine if non-pathological Smn loss affects hepatic glucagon sensitivity. Livers from both RD- and HFD-fed Smn+/−mice had increased p-CREB levels, suggesting hepatic glucagon sensitization (Fig. 5E and F). This increase in p-CREB levels was independent of diet type (in juxtaposition to p-AKT as seen in Fig. 5C). We thus assessed whether increased hepatic glucagon sensitivity, as measured by p-CREB and CREB expression, was a commonality of Smn depletion (regardless of the total amount of depleted protein). To address the question, we employed P2–3 severe SMA mice (Smn−/−;SMN2) and their non-pathological Smn-depleted heterozygote littermates (Smn+/−;SMN2) (42) and P21 Smn2B/− mice, an intermediate SMA mouse model (32,43). Interestingly, when normalized to actin loading control, livers from P2–3 Smn+/−;SMN2 heterozygotes that lack any overt neurological phenotype displayed increased CREB levels and, subsequently, increased p-CREB levels relative to wild-type (Smn+/+;SMN2) littermates. Since there was a similar increase in both total CREB and p-CREB expression, there was no difference relative to wild-type mice when p-CREB levels were normalized to total CREB (Supplementary Material, Fig. S1A and B). CREB and p-CREB levels from livers of the severe Smn−/−;SMN2 SMA mice, while not significantly different from wild type, trended higher. Following a similar pattern, the livers of Smn2B/− mice contained higher p-CREB and total CREB than wild-type mice (Supplementary Material, Fig. S1C). Here, the association of SMA pathology with increased hepatic glucagon sensitivity is most likely due to the hyperglucagonemia previously observed in the Smn2B/− mice (28). As all murine models studied (irrespective of diet) display increased p-CREB expression, aberrant hepatic glucagon sensitization appears to be a common feature of Smn depletion, whether it be mild or severe.
Similar to our p-AKT results, hepatic glucagon sensitivity appears to be independent of serum insulin and glucagon levels as these are found at normal levels in Smn+/− mice (Fig. 5A and B). Although it remains unclear what causes this increased p-CREB activation, it may participate in the decreased glucose clearance ability of HFD Smn+/− mice by promoting hepatic gluconeogenesis and thus keeping circulating glucose levels high. Together, our results demonstrate that non-pathological Smn depletion enhances both hepatic insulin and glucagon sensitivity.
One-year-old Smn-depleted mice are heavier and hyperglycemic
To account for possible long-term effects of hypomorphic Smn depletion on pancreatic/metabolic homeostasis, we analyzed male mice at 1 year of age. Smn+/−mice were ∼15–20% heavier than wild-type littermates, suggesting general metabolic dyshomeostasis (Fig. 6A). We next assessed glucose levels in random-fed and fasted mice. Blood glucose from random-fed Smn+/−mice was normal relative to age-matched controls (Fig. 6B). However, when fasted, 1-year-old Smn+/−mice displayed hyperglycemia (Fig. 6B). To test for general defects in glucose clearance/absorption (a possible explanation for the aforementioned fasting hyperglycemia), we performed an IPGTT. While IPGTT curves trend higher for Smn+/−mice, no significant difference between heterozygotes and controls was observed at any time point (Fig. 6C). Concomitantly, there was no change in IPGTT AUC between the two groups, suggesting normal glucose clearance/absorption in 1-year-old Smn+/−mice (Fig. 6D). Our results therefore point to an increase in fasting glucose levels independent of defects in glucose clearance/absorption in aging Smn-depleted mice. Precisely how this contributes to increased weight gain remains to be determined.
Figure 6.

Increased weight and fasting glucose levels in 1-year-old Smn+/− mice. One-year-old WT (n = 4) and Smn+/− (n = 4) males were weighed then fasted overnight, followed by an IPGTT test. (A) One-year-old Smn+/− mice weighed significantly more than 1-year-old WT mice. (Data are mean ± SD; t-test; **P = 0.0087.) (B) Random fed serum glucose levels are similar between WT and Smn+/− mice. Fasting serum glucose levels, however, are significantly higher in Smn+/− mice compared with WT mice, suggesting a defect in glucose metabolism. (Data are mean ± SD; two-way ANOVA; **P < 0.01; NS, not significant.) (C) IPGTT curves between WT and Smn+/− mice. Although trending higher than WT, at no single time point did Smn+/−blood glucose deviate significantly from WT. (Data are mean ± SD; multiple t-test.) (D) Quantification and comparison of the IPGTT AUCs shows no significant difference between WT and Smn+/− mice. (Data are mean ± SD; t-test; NS, not significant.)
One-year-old Smn-depleted mice display pancreatic defects
We performed morphological and composition analysis of pancreatic islets from 1-year-old wild-type and Smn+/−mice. Surprisingly, and in stark contrast to our studies in Smn2B/−mice where islets are primarily composed of α-cells (28), Smn+/−islets at 1 year consisted of significantly fewer α-cells than β-cells (Supplementary Material, Fig. S2), leading to significantly lower α/β ratios (Fig. 7A and B). Furthermore, unlike mice on the 16-week RD or HFD (Fig. 4A and E), by 1 year, there is no significant difference in the number of centrally located α-cells between wild-type and Smn+/− mice (Fig. 7C). We also assessed islet size in Smn+/− and control mice as a correlative measure of β-cell mass (34). The trend was for larger islets in Smn+/− mice relative to wild type (P = 0.05) (Fig. 7D). Therefore, the phenotypic scenario depicted herein demonstrates non-pathological Smn depletion gradually gives rise to larger islets with lower α/β ratios compared with wild type.
Figure 7.
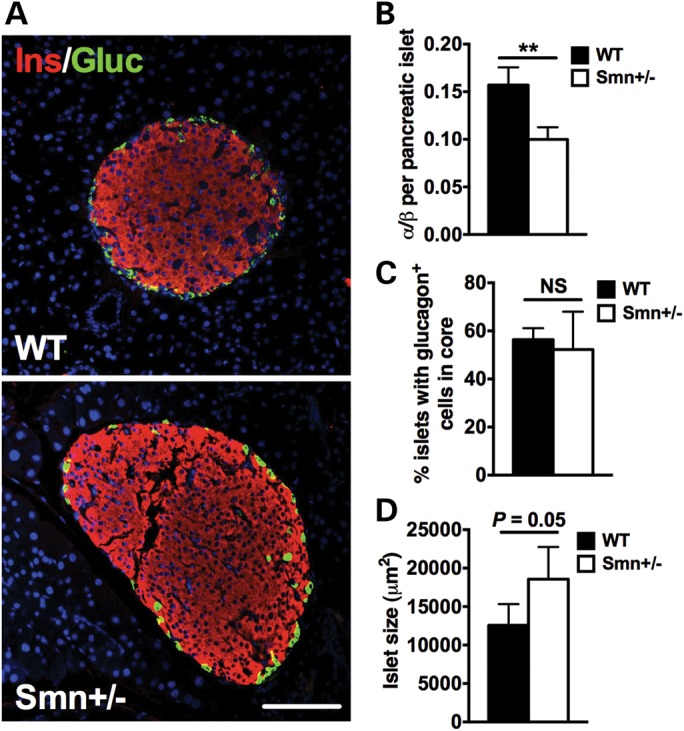
Aging decreases α/β-cell ratio in pancreatic islets of Smn+/− mice. (A) Representative images of pancreatic islets from 1-year-old WT and Smn+/− mice co-labeled with insulin (β-cells, red) and glucagon (α-cells, green). Scale bar = 100 μm. (B) Quantification of the ratio of the number of α-cells/number of β-cells per islet in WT (n = 4) and Smn+/− (n = 4) mice. The α/β ratio of Smn+/− mice is significantly smaller compared with WT. (Data are mean ± SD; t-test; **P = 0.0023.) (C) Quantification of percentage islets with aberrant α-cell localization. No difference in patterning was observed (WT, n = 4 and Smn+/−, n = 4). (Data are mean ± SD; t-test; NS, not significant.) (D) Comparison of average islet size between WT (n = 4) and Smn+/− (n = 4) mice shows a trend for larger islets in Smn+/−mice. (Data are mean ± SD; t-test; P = 0.05.)
One-year-old Smn-depleted mice display hyperinsulinemia and increased hepatic glucagon sensitivity
We next determined the effect of natural aging on general metabolic features of non-pathological Smn depletion. Interestingly, we found that 1-year-old Smn+/− mice were hyperinsulinemic (Fig. 8A). Unfortunately, we were unable to ascertain glucagon levels at this age as multiple samples across both wild-type and Smn+/− mice were below detectable levels (data not shown). While no significant difference was observed for hepatic p-AKT/AKT ratios between genotypes (a measure of insulin sensitivity), there was extreme p-AKT intervariability among Smn+/−mice, which was not seen in wild-type mice (Fig. 8B and C). Analysis of hepatic p-CREB (a measure of glucagon sensitivity) did, however, reveal increased p-CREB/CREB ratios in Smn+/− mice (Fig. 8D and E). As CREB regulates hepatic gluconeogenesis (44), we sought to determine if its increased phosphorylation in Smn+/− livers reflects an overactive gluconeogenic program. A key driver of hepatic gluconeogenesis is phosphoenolpyruvate carboxy kinase (Pck1 or PEPCK), an enzyme transcriptionally activated by CREB upon activation of gluconeogenic signaling (45,46). Immunoblot analysis of Pck1 protein revealed elevated levels in 1-year-old Smn+/− livers relative to wild-type littermates (Fig. 8F and G), suggesting increased induction of the glucagon-dependent CREB-Pck1 gluconeogenic pathway. This aberrant activation of the hepatic glucagon signaling pathway and subsequent gluconeogenesis may be responsible for the fasting hyperglycemia in Smn+/− mice (Fig. 6B). Further, hyperinsulinemia, loss of α cells and increased islet size (see Figs 7B and D and 8A) could all be compensatory mechanisms that arise over time to counteract increased hepatic glucagon sensitization, the result of integrative crosstalk between the liver and pancreas to affect and maintain glucose and metabolic homeostatis (47,48).
Figure 8.

Hyperinsulinemia and increased hepatic glucagon sensitivity in 1-year-old Smn+/− mice. (A) Comparison of serum insulin levels from random fed 1-year-old WT (n = 4) and Smn+/− (n = 4) males reveals hyperinsulinemia in Smn+/− mice. (Data are mean ± SD; t-test; ***P = 0.0006.) (B) Representative immunoblots of p-AKT and total AKT protein in livers of 1-year-old WT and Smn+/−mice. Images were cropped from the same immunoblot. (C) Quantification of p-AKT/total AKT ratios reveals variability in hepatic p-AKT with no significant differences between WT (n = 3) and Smn+/− (n = 3) mice. (Data are mean ± SD; t-test; NS, not significant.) (D) Representative immunoblots of p-CREB and total CREB protein in livers of 1-year-old WT and Smn+/−mice. Images were cropped from the same immunoblot. (E) Quantification of p-CREB/total CREB ratios in livers of WT (n = 3) and Smn+/− (n = 3) mice shows a significant increase in hepatic p-CREB in Smn+/− mice, suggesting increased glucagon sensitivity. (Data are mean ± SD; t-test; *P = 0.03.) (F) Representative fluorescent immunoblots of Pck1 and GAPDH protein in livers of 1-year-old WT and Smn+/−mice. (G) Quantification of Pck1/GAPDH ratios in livers of WT (n = 3) and Smn+/− (n = 3) mice shows a significant increase in hepatic Pck1 levels in Smn+/− mice, suggesting increased hepatic gluconeogenesis (Data are mean ± SD; t-test; **P < 0.01.) (H) Representative fluorescent immunoblots of CARM1 and GAPDH protein in livers of 1-year-old WT and Smn+/−mice. (I) Quantification of CARM1/GAPDH ratios in livers of WT (n = 3) and Smn+/− (n = 3) mice shows no significant difference in CARM1 protein levels between WT and mutants (Data are mean ± .d.; t-test; NS, not significant.)
However, it is also possible that increased hepatic p-CREB is a direct consequence of Smn depletion. The protein arginine methyltransferase 1 (CARM1) is a transcriptional co-activator reported to activate CREB-Pck1 gluconeogenic signaling (49). Interestingly, Smn protein was recently shown to govern CARM1 translation, as evidenced by increased CARM1 levels in the spinal cord of SMA mice as well as in primary fibroblasts obtained from SMA patients (18). We tested the hypothesis that reduced hepatic Smn levels could also result in increased CARM1 expression and subsequent CREB activation. However, immunoblot analysis revealed hepatic CARM1 protein levels similar to wild-type mice at 1 year (Fig. 8H and I), suggesting a tissue/cell-specific regulation of CARM1 mRNA by Smn.
Combined, our results suggest that over time, non-pathological Smn depletion leads to increased body mass, with accompanying fasting hyperglycemia, decreased α-cell number, hyperinsulinemia and hepatic glucagon sensitivity independent of CARM1 up-regulation.
DISCUSSION
We are the first to identify a novel role for Smn protein in pancreatic/metabolic function independent of overt SMA neuropathology. Indeed, non-pathological heterozygous Smn+/−mice that are metabolically stressed either by an HFD or natural aging display compromised islet morphology and composition, problematic glucose clearance, increased weight, hyperinsulinemia, aberrant (increased) hepatic insulin sensitivity and overall increased hepatic glucagon sensitivity. Not only do these findings hold import for our understanding of SMA pathophysiology, they also provide novel insight into the molecular mediators of glucose metabolism and pancreatic islet development.
We have previously shown that type I SMA patients, afflicted with the most severe form of the disease, display an increased number of glucagon-producing α-cells within islets as well as abnormal glucose levels (28). Past reports have identified metabolic abnormalities in SMA patients, including metabolic acidosis, abnormal fatty acid metabolism, hyperlipidemia and hyperglycemia (50–53). Here, we highlight the fact that patients with milder forms of SMA (types II, III and IV), may, overtime, exhibit metabolic dysfunction that is a direct result of ‘low’ level Smn protein reduction. Indeed, a type II adult SMA patient has recently been described as developing diabetes mellitus and diabetic ketoacidosis (54). Of note, while the Smn+/− mice used in this study display an array of metabolic abnormalities, their overall phenotype is not typical of other diabetic models, which are normally characterized by glucose intolerance, random-fed hyperglycemia, hepatic insulin resistance, β-cell hyperplasia and hyperglucagonemia. Thus, types II, III and IV patients, and even symptom-free carriers, could develop a subset of subtle and progressive pancreatic/metabolic defects that may evade detection, and therefore, proper monitoring. Our study also highlights the exacerbatory potential of environmental and natural factors, such as an HFD and aging, on numerous metabolic and pancreatic functions in non-pathological Smn-depleted mice. Therefore, the presence and extent of potential symptoms arising in SMA patients or carriers may be inherently linked to genotype, individual lifestyle and age.
The consistent increase in p-CREB at all ages studied was intriguing (16 weeks RD, 16 weeks HFD and 1 year), suggesting a constitutively active hepatic glucagon-signaling pathway in Smn+/−mice. It was interesting to note a similar increase in hepatic p-CREB in P2 Smn+/−;SMN2 and P21 Smn2B/− mice, an intermediate SMA mouse model (see Supplementary Material, Fig. S1). As we do not detect an increase in serum glucagon levels at any time point measured in Smn+/− mice, the increase in p-CREB is most likely a result of heightened glucagon sensitivity. This heightened sensitivity is also independent of age and diet, which leads us to postulate that the increase in glucagon sensitivity is the driving force behind all other metabolic/pancreatic defects observed in the Smn+/− model. Typically, p-CREB promotes hepatic gluconeogenesis (reviewed in 40,41) and our results suggest increased activation of the CREB-Pck1 gluconeogenic program in the livers of Smn+/− mice. As a defense against runaway glucose production, Smn-deficient mice may modulate glucose homeostasis via α/β-cell ratio in the islets, increased islet size, hyperinsulinemia and in some cases, increased hepatic insulin sensitivity. This type of integrative organ crosstalk, modulating the function of pancreas and liver, has recently been described (47,48). Pancreatic compensation for overactive glucagon-dependent hepatic gluconeogenesis might explain why overall glucose levels are not abnormally high in Smn+/− mice except when fasted at 1 year, where the aforementioned compensatory mechanisms may no longer be sufficient.
How reduction in SMN protein leads to up-regulation of hepatic p-CREB remains unclear. In the present study, we tested the theory that SMN's previously described role as a translational regulator for CREB's co-activator CARM1 (18,49) could be responsible for increased CREB phosphorylation in the livers of Smn+/− mice. However, CARM1 levels are unchanged in Smn-depleted livers. Despite this, a direct relationship between SMN and CREB may still exist as Smn has been shown to also interact with PRMT5 (55), another CREB co-activator (56). Further, the SMN promoter region contains a CREB docking site and the expression of the two is possibly interdependent (57,58). Future studies should therefore aim at identifying SMN effectors regulating, directly or indirectly, hepatic glucagon and/or insulin pathways. It is also important to take into consideration the more general function of CREB as a transcription factor (reviewed in 59). Increased p-CREB activity has the potential to dramatically alter the liver's expression profile, impacting a slew of downstream metabolic and pancreatic pathways. Identifying changes in overall gene expression profiles may therefore provide mechanistic insight into SMN's potential role as affector of the hepatic CREB pathway.
Our work also places in stark contrast differences in pathology between Smn2B/−mice and the non-pathological Smn-depleted Smn+/− mouse model. Whereas islets from Smn2B/−mice are smaller, have a dramatic increase in α-cell number and are characterized by hyperglucagonemia (28), Smn+/−mice instead display normal glucagon levels, a decreased α/β ratio and hyperinsulinemia at 1 year of age. The Smn+/−mice even gain weight relative to controls, a phenotype, to the best of our knowledge, undescribed in an Smn depletion mouse model. One explanation is the necessity for SMN protein levels to be above a given threshold during development. In the Smn2B/− model, SMN levels are below threshold, the end result being an early and dramatic metabolic/pancreatic pathology, while Smn+/−mice have sufficient Smn protein to maintain metabolic/pancreatic homeostasis early in development. Pathology in these mice only arises later when either higher thresholds are required or SMN function transitions in the maturing animal. It is clear that varying degrees of SMN protein loss can have dramatically different effects on glucose metabolism and islet development. The precise mechanisms underlying the dramatic shift painted by either model, not only for metabolic/pancreatic function but for general outcome as well, is a lingering question that needs to be addressed as the field moves forward.
Our present findings expand upon our initial work in the Smn2B/−model, validating SMN as a novel player in metabolic and pancreatic homeostasis. The metabolic abnormalities observed in Smn+/− mice are independent of typical SMA pathological hallmarks as the mice are devoid of an overt neurological and/or neuromuscular phenotype (4). It is thus possible that SMN acts as a modifier or susceptibility gene in the development of a subset of metabolic disorders. This could have implications for SMN1 mutations and/or deletion carriers, who represent 1 out of every 40 people, which typically express lower levels of SMN protein without presenting neuromuscular symptoms. Furthermore, in light of the rapid progress in development of therapeutic strategies that the field of SMA is currently undergoing, metabolic/pancreatic pathologies must also be considered following partial SMN expression restoration treatments in SMA patients (29,30). Our work strongly suggests that in the absence of Smn-dependent neuromuscular pathologies, there is still potential for Smn-dependent metabolic complications as surviving SMA patients (without full life-long restoration of SMN levels) age and acquire various lifestyle habits.
MATERIAL AND METHODS
Antibodies
The primary antibodies used and the dilutions were as follows: guinea pig anti-insulin (1:50; Dako), mouse anti-glucagon (1:200; Abcam), mouse anti-actin (1:800; Fitzgerald), mouse anti-Smn (1:5000; BD Transduction Laboratories), rabbit anti-phospho-AKT (Ser473) (1:500; Cell Signaling), rabbit anti-AKT (1:500; Cell Signaling), rabbit anti-phospho-CREB (Ser133) (1:500; Cell Signaling), rabbit anti-CREB (1:500; Cell Signaling), rabbit anti-Pck1 (1:1000; Abcam), rabbit anti-CARM1 (1:5000; Bethyl Laboratories) mouse anti-2H3 (neurofilament 165 kDa, 1:100; Hybridoma Bank) and mouse anti-SV2 (1:250; Hybridoma Bank). The secondary antibodies used were as follows: donkey anti-guinea pig biotin-SP-conjugated (1:200; Jackson Immuno Research), streptavidin-Cy3-conjugated (1:600; Jackson Immuno Research), Alexa Fluor 488 goat anti-mouse (1:500; Molecular Probes), HRP-conjugated goat anti-rabbit IgG (1:5000; Bio-Rad) and HRP-conjugated goat anti-mouse IgG (1:5000; Bio-Rad).
Animal models
Wild-type and Smn+/− mice are on a pure C57BL/6 background. The Smn knock-out allele was previously described by Schrank et al. (4) and Smn+/− mice were obtained from The Jackson Laboratory. The Smn2B/− mice were established in our laboratory and maintained in our animal facility on a C57BL/6×CD1 hybrid background (32,43). The 2B mutation consists of a substitution of three nucleotides in the exon splicing enhancer of exon 7 (60). Smn+/−;SMN2 mice were obtained from Jackson Laboratory (strain 005024) and used to generate the Smn+/+;SMN2 and Smn−/−;SMN2 mice. This mouse model carries a copy of the human SMN2 gene and has previously been described (42). For diet studies, P21 Smn+/− males were placed on an RD (Harlan Teklad Lab Animal Diets, 2018l; 18% calories from fat) or an HFD (Harlan Teklad Lab Animal Diets, TD.06415; 45% calories from fat) for 16 weeks. All animal procedures were performed in accordance with institutional guidelines (Animal Care and Veterinary Services and Ethics, University of Ottawa).
Immunohistochemistry of pancreas sections
Whole pancreas was dissected from 1-month, 19-week and 1-year-old mice and placed overnight in 4% paraformaldehyde. Tissues were embedded in paraffin and cut at a thickness of 4 μm. For immunohistochemistry, pancreas sections were first deparaffinized in xylene (3 × 10 min), fixed in 100% ethanol (2 × 10 min), rehydrated in 95% and 75% ethanol (5 s each) and placed 5 min in 1 m Tris–HCl pH 7.5. The pancreas sections were then incubated for 2 h at room temperature (RT) in blocking solution [TBLS (10% NaN3), 20% goat serum, 0.3% Triton X-100]. This was followed by an overnight incubation at 4°C with the primary antibodies. Sections were then washed three times with PBS, incubated 1 h at RT with the secondary antibodies and then washed three times with PBS. Hoechst (1:1000) was added to the last PBS wash. Slides were mounted in Fluorescent Mounting Medium (Dako). Images were taken with a Zeiss confocal microscope, employing a 20× objective, equipped with filters suitable for FITC/Cy3/Hoechst fluorescence.
Immunohistochemistry of spinal cord sections
Mice were anesthetized with tribromoethanol (Avertin) and perfused transcardially with 4% paraformaldehyde. Spinal cords were removed and post-fixed in 4% paraformaldehyde, followed by 30% sucrose in PBS. The lumbar area of the spinal cord was removed and flash-frozen in a mixture of OCT/30% sucrose. Twenty-micrometer thick frozen sections were cut. For immunohistochemical analysis of motor neuron number, sections were first rehydrated 40 min in PBS followed by 10 min permeabilization in 0.1% Triton X. Sections were washed in PBS and stained with Neurotrace 500/525 green fluorescent Nissl (1 in 500; Invitrogen). Sections were then washed in PBS, counterstained with DAPI and mounted in Dako Fluorescent mounting media. Images were captured with a Zeiss Axiovert 200M microscope and ×20 objective. Quantitative analysis was performed on 3 mice per group, 10 sections per mouse.
NMJ immunohistochemistry
Tranversus abdominis (TVA) muscles were immunohistochemically labeled to allow quantification of neuromuscular innervation as described previously (21). Briefly, TVA muscles were immediately dissected from recently euthanized mice and fixed in 4% paraformaldehyde (Electron Microscopy Science) in PBS for 15 min. Post-synaptic acetylcholine receptors (AChRs) were labeled with α-bungarotoxin (αBTX) conjugated to Alexa Fluor 488 for 10 min. Muscles were permeabelized in 2% Triton X for 30 min then blocked in 4% bovine serum albumin (BSA)/1% Triton X in 0.1 m PBS for 30 min before incubation overnight in primary antibodies and visualized with Cy3-conjugated secondary antibodies. TVA muscles were then whole-mounted in Dako Fluorescent mounting media. Images were captured with a Zeiss confocal microscope and Zeiss Axiovert 200M microscope. A minimum of five fields of view (FOV) were quantified per muscle. For each FOV, the percentage of fully occupied endplates was noted. Fully occupied endplates were defined as motor endplates completely covered by the presynaptic terminal labeled with SV2 and NF.
Hematoxylin and eosin staining of TA sections
TA muscle sections (5 µm) were deparaffinized in xylene and fixed in 100% ethanol. Following a rinse in water, samples were stained in hematoxylin (Fisher) for 3 min, rinsed in water, dipped 40 times in a solution of 0.02% HCl in 70% ethanol and rinsed in water again. The sections were stained in a 1% eosin solution (BDH) for 1 min, dehydrated in ethanol, cleared in xylene and mounted with Permount (Fisher). Images were taken with a Zeiss Axioplan2 microscope, with a 20× objective. Quantitative assays were performed on three mice for each genotype and five sections per mouse. The area of muscle fiber within designated regions of the TA muscle sections was measured using the Image J software.
Immunoblot analysis
Equal amounts of protein were separated by electrophoresis on 10% SDS–polyacrylamide gels and blotted onto a PVDF membrane (Millipore). Membranes were blocked in 5% non-fat milk in TBST [10 mm Tris–HCl pH 8.0, 150 mm NaCl and 0.1% Tween 20 (Sigma)], and incubated overnight at 4°C with primary antibody. Membranes were then incubated at RT with secondary antibody for 1 h, followed by three TBST washes. Signals were visualized using ECL or ECL plus detection kit (Amersham). All blots used for comparison purposes (between wild type and Smn+/−mice) were done on the same gel and then cropped (Figs 5C and E and 8B and D).
For fluorescent western blots, equal amounts of samples were separated by electrophoresis on 8–12% SDS–polyacrylamide gels and blotted onto a PVDF membrane (Millipore). The membranes were blocked in Odyssey blocking buffer (LI-COR), then incubated with the primary antibody overnight at 4°C. The membranes were then rinsed in TBST and incubated for 1 h at RT with IRDye 688 or 800 (LI-COR) secondary antibody. Fluorescent signals were detected using the Odyssey Infrared Imaging System (LI-COR).
Glucose tests
All blood glucose readings were done using the OneTouch®Ultra2® glucometer. Random-fed 1-month, 19-week and 1-year-old mice were evaluated at the same time of day for non-fasting glucose levels. For fasting glucose levels, 1-month, 19-week and 1-year-old mice were fasted overnight and glucose levels recorded the following morning.
The IPGTT was performed on 1-month, 19-week and 1-year-old mice fasted overnight. Mice were administered a 20% glucose solution (2 g glucose/kg body weight) through IP injection the following morning. Glucose levels were measured at 0, 15, 30, 90 and 120 min in blood samples collected from the tail vein.
Measurement of insulin and glucagon serum levels
Serum was collected from random-fed 1-month, 19-week and 1-year-old mice. Insulin and glucagon levels were measured using the mouse Bio-Plex Pro™ diabetes magnetic bead-based immunoassay (Bio-Rad) following manufacturer's instructions. Data acquisition and analysis were done using the Bio-Plex 200 Luminex-based reader and the accompanying Bio-Plex Manager software.
Statistical analysis
All statistical analyses were done with the Graphpad Prism software. When appropriate, a Student's two-tail t-test, a multiple t-test, a one-way analysis of variance (ANOVA) or a two-way ANOVA comparison test was used. Data were considered significantly different at P < 0.05.
SUPPLEMENTARY MATERIAL
FUNDING
This project was funded by a grant from the Canadian Institutes of Health Research (CIHR), and The Muscular Dystrophy Association to R.K. M.B. was a recipient of a Frederick Banting and Charles Best CIHR Doctoral Research Award for the major part of this work and presently holds an EMBO Long-Term Fellowship. J.-P.M. is a recipient of a Frederick Banting and Charles Best CIHR Doctoral Research Award. L.M.M. is a recipient of an Emerging Investigator Award from Fight SMA and Gwendolyn Strong Foundation. R.K. is a recipient of a University Health Research Chair from the University of Ottawa. Funding to pay the Open Access publication charges for this article was provided by The University of Ottawa.
Supplementary Material
ACKNOWLEDGEMENTS
We are grateful to the Kothary laboratory for helpful discussions. We also thank Dr Jocelyn Côté (University of Ottawa) for the CARM1 antibody.
Conflict of Interest statement. All authors declare having no financial interests or connections, direct or indirect, or other situations that might raise the question of bias in the work reported or the conclusions, implications, or opinions stated—including pertinent commercial or other sources of funding for the individual author(s) or for the associated department(s) or organization(s), personal relationships or direct academic competition.
REFERENCES
- 1.Crawford T.O., Pardo C.A. The neurobiology of childhood spinal muscular atrophy. Neurobiol. Dis. 1996;3:97–110. doi: 10.1006/nbdi.1996.0010. [DOI] [PubMed] [Google Scholar]
- 2.Pearn J. Incidence, prevalence, and gene frequency studies of chronic childhood spinal muscular atrophy. J. Med. Genet. 1978;15:409–413. doi: 10.1136/jmg.15.6.409. [DOI] [PMC free article] [PubMed] [Google Scholar]
- 3.Lefebvre S., Burglen L., Reboullet S., Clermont O., Burlet P., Viollet L., Benichou B., Cruaud C., Millasseau P., Zeviani M., et al. Identification and characterization of a spinal muscular atrophy-determining gene. Cell. 1995;80:155–165. doi: 10.1016/0092-8674(95)90460-3. [DOI] [PubMed] [Google Scholar]
- 4.Schrank B., Gotz R., Gunnersen J.M., Ure J.M., Toyka K.V., Smith A.G., Sendtner M. Inactivation of the survival motor neuron gene, a candidate gene for human spinal muscular atrophy, leads to massive cell death in early mouse embryos. Proc. Natl Acad. Sci. USA. 1997;94:9920–9925. doi: 10.1073/pnas.94.18.9920. [DOI] [PMC free article] [PubMed] [Google Scholar]
- 5.Lorson C.L., Hahnen E., Androphy E.J., Wirth B. A single nucleotide in the SMN gene regulates splicing and is responsible for spinal muscular atrophy. Proc. Natl Acad. Sci. USA. 1999;96:6307–6311. doi: 10.1073/pnas.96.11.6307. [DOI] [PMC free article] [PubMed] [Google Scholar]
- 6.Lefebvre S., Burlet P., Liu Q., Bertrandy S., Clermont O., Munnich A., Dreyfuss G., Melki J. Correlation between severity and SMN protein level in spinal muscular atrophy. Nat. Genet. 1997;16:265–269. doi: 10.1038/ng0797-265. [DOI] [PubMed] [Google Scholar]
- 7.Rossoll W., Jablonka S., Andreassi C., Kroning A.K., Karle K., Monani U.R., Sendtner M. Smn, the spinal muscular atrophy-determining gene product, modulates axon growth and localization of beta-actin mRNA in growth cones of motoneurons. J. Cell Biol. 2003;163:801–812. doi: 10.1083/jcb.200304128. [DOI] [PMC free article] [PubMed] [Google Scholar]
- 8.McWhorter M.L., Monani U.R., Burghes A.H., Beattie C.E. Knockdown of the survival motor neuron (Smn) protein in zebrafish causes defects in motor axon outgrowth and pathfinding. J. Cell Biol. 2003;162:919–931. doi: 10.1083/jcb.200303168. [DOI] [PMC free article] [PubMed] [Google Scholar]
- 9.Akten B., Kye M.J., Hao le T., Wertz M.H., Singh S., Nie D., Huang J., Merianda T.T., Twiss J.L., Beattie C.E., et al. Interaction of survival of motor neuron (SMN) and HuD proteins with mRNA cpg15 rescues motor neuron axonal deficits. Proc. Natl Acad. Sci. USA. 2011;108:10337–10342. doi: 10.1073/pnas.1104928108. [DOI] [PMC free article] [PubMed] [Google Scholar]
- 10.Peter C.J., Evans M., Thayanithy V., Taniguchi-Ishigaki N., Bach I., Kolpak A., Bassell G.J., Rossoll W., Lorson C.L., Bao Z.Z., et al. The COPI vesicle complex binds and moves with survival motor neuron within axons. Hum. Mol. Genet. 2011;20:1701–1711. doi: 10.1093/hmg/ddr046. [DOI] [PMC free article] [PubMed] [Google Scholar]
- 11.Bowerman M., Shafey D., Kothary R. Smn depletion alters profilin II expression and leads to upregulation of the RhoA/ROCK pathway and defects in neuronal integrity. J. Mol. Neurosci. 2007;32:120–131. doi: 10.1007/s12031-007-0024-5. [DOI] [PubMed] [Google Scholar]
- 12.Bowerman M., Beauvais A., Anderson C.L., Kothary R. Rho-kinase inactivation prolongs survival of an intermediate SMA mouse model. Hum. Mol. Genet. 2010;19:1468–1478. doi: 10.1093/hmg/ddq021. [DOI] [PubMed] [Google Scholar]
- 13.Nolle A., Zeug A., van Bergeijk J., Tonges L., Gerhard R., Brinkmann H., Al Rayes S., Hensel N., Schill Y., Apkhazava D., et al. The spinal muscular atrophy disease protein SMN is linked to the Rho-kinase pathway via profilin. Hum. Mol. Genet. 2011;20:4865–4878. doi: 10.1093/hmg/ddr425. [DOI] [PubMed] [Google Scholar]
- 14.van Bergeijk J., Rydel-Konecke K., Grothe C., Claus P. The spinal muscular atrophy gene product regulates neurite outgrowth: importance of the C terminus. FASEB J. 2007;21:1492–1502. doi: 10.1096/fj.06-7136com. [DOI] [PubMed] [Google Scholar]
- 15.Liu Q., Fischer U., Wang F., Dreyfuss G. The spinal muscular atrophy disease gene product, SMN, and its associated protein SIP1 are in a complex with spliceosomal snRNP proteins. Cell. 1997;90:1013–1021. doi: 10.1016/s0092-8674(00)80367-0. [DOI] [PubMed] [Google Scholar]
- 16.Zhang Z., Lotti F., Dittmar K., Younis I., Wan L., Kasim M., Dreyfuss G. SMN deficiency causes tissue-specific perturbations in the repertoire of snRNAs and widespread defects in splicing. Cell. 2008;133:585–600. doi: 10.1016/j.cell.2008.03.031. [DOI] [PMC free article] [PubMed] [Google Scholar]
- 17.Buhler D., Raker V., Luhrmann R., Fischer U. Essential role for the tudor domain of SMN in spliceosomal U snRNP assembly: implications for spinal muscular atrophy. Hum. Mol. Genet. 1999;8:2351–2357. doi: 10.1093/hmg/8.13.2351. [DOI] [PubMed] [Google Scholar]
- 18.Sanchez G., Dury A.Y., Murray L.M., Biondi O., Tadesse H., El Fatimy R., Kothary R., Charbonnier F., Khandjian E.W., Cote J. A novel function for the survival motoneuron protein as a translational regulator. Hum. Mol. Genet. 2013;22:668–684. doi: 10.1093/hmg/dds474. [DOI] [PubMed] [Google Scholar]
- 19.Kong L., Wang X., Choe D.W., Polley M., Burnett B.G., Bosch-Marce M., Griffin J.W., Rich M.M., Sumner C.J. Impaired synaptic vesicle release and immaturity of neuromuscular junctions in spinal muscular atrophy mice. J. Neurosci. 2009;29:842–851. doi: 10.1523/JNEUROSCI.4434-08.2009. [DOI] [PMC free article] [PubMed] [Google Scholar]
- 20.Kariya S., Park G.H., Maeno-Hikichi Y., Leykekhman O., Lutz C., Arkovitz M.S., Landmesser L.T., Monani U.R. Reduced SMN protein impairs maturation of the neuromuscular junctions in mouse models of spinal muscular atrophy. Hum. Mol. Genet. 2008;17:2552–2569. doi: 10.1093/hmg/ddn156. [DOI] [PMC free article] [PubMed] [Google Scholar]
- 21.Murray L.M., Comley L.H., Thomson D., Parkinson N., Talbot K., Gillingwater T.H. Selective vulnerability of motor neurons and dissociation of pre- and post-synaptic pathology at the neuromuscular junction in mouse models of spinal muscular atrophy. Hum. Mol. Genet. 2008;17:949–962. doi: 10.1093/hmg/ddm367. [DOI] [PubMed] [Google Scholar]
- 22.Walker M.P., Rajendra T.K., Saieva L., Fuentes J.L., Pellizzoni L., Matera A.G. SMN complex localizes to the sarcomeric Z-disc and is a proteolytic target of calpain. Hum. Mol. Genet. 2008;17:3399–3410. doi: 10.1093/hmg/ddn234. [DOI] [PMC free article] [PubMed] [Google Scholar]
- 23.Mutsaers C.A., Wishart T.M., Lamont D.J., Riessland M., Schreml J., Comley L.H., Murray L.M., Parson S.H., Lochmuller H., Wirth B., et al. Reversible molecular pathology of skeletal muscle in spinal muscular atrophy. Hum. Mol. Genet. 2011;20:4334–4344. doi: 10.1093/hmg/ddr360. [DOI] [PubMed] [Google Scholar]
- 24.Martinez-Hernandez R., Soler-Botija C., Also E., Alias L., Caselles L., Gich I., Bernal S., Tizzano E.F. The developmental pattern of myotubes in spinal muscular atrophy indicates prenatal delay of muscle maturation. J. Neuropathol. Exp. Neurol. 2009;68:474–481. doi: 10.1097/NEN.0b013e3181a10ea1. [DOI] [PubMed] [Google Scholar]
- 25.Bevan A.K., Hutchinson K.R., Foust K.D., Braun L., McGovern V.L., Schmelzer L., Ward J.G., Petruska J.C., Lucchesi P.A., Burghes A.H., et al. Early heart failure in the SMNDelta7 model of spinal muscular atrophy and correction by postnatal scAAV9-SMN delivery. Hum. Mol. Genet. 2010;19:3895–3905. doi: 10.1093/hmg/ddq300. [DOI] [PMC free article] [PubMed] [Google Scholar]
- 26.Shababi M., Habibi J., Yang H.T., Vale S.M., Sewell W.A., Lorson C.L. Cardiac defects contribute to the pathology of spinal muscular atrophy models. Hum. Mol. Genet. 2010;19:4059–4071. doi: 10.1093/hmg/ddq329. [DOI] [PubMed] [Google Scholar]
- 27.Heier C.R., Satta R., Lutz C., DiDonato C.J. Arrhythmia and cardiac defects are a feature of spinal muscular atrophy model mice. Hum. Mol. Genet. 2010;19:3906–3918. doi: 10.1093/hmg/ddq330. [DOI] [PMC free article] [PubMed] [Google Scholar]
- 28.Bowerman M., Swoboda K.J., Michalski J.P., Wang G.S., Reeks C., Beauvais A., Murphy K., Woulfe J., Screaton R.A., Scott F.W., et al. Glucose metabolism and pancreatic defects in spinal muscular atrophy. Ann. Neurol. 2012;72:256–268. doi: 10.1002/ana.23582. [DOI] [PMC free article] [PubMed] [Google Scholar]
- 29.Foust K.D., Wang X., McGovern V.L., Braun L., Bevan A.K., Haidet A.M., Le T.T., Morales P.R., Rich M.M., Burghes A.H., et al. Rescue of the spinal muscular atrophy phenotype in a mouse model by early postnatal delivery of SMN. Nat. Biotechnol. 2010;28:271–274. doi: 10.1038/nbt.1610. [DOI] [PMC free article] [PubMed] [Google Scholar] [Retracted]
- 30.Porensky P.N., Mitrpant C., McGovern V.L., Bevan A.K., Foust K.D., Kaspar B.K., Wilton S.D., Burghes A.H. A single administration of morpholino antisense oligomer rescues spinal muscular atrophy in mouse. Hum. Mol. Genet. 2012;21:1625–1638. doi: 10.1093/hmg/ddr600. [DOI] [PMC free article] [PubMed] [Google Scholar]
- 31.Jablonka S., Schrank B., Kralewski M., Rossoll W., Sendtner M. Reduced survival motor neuron (Smn) gene dose in mice leads to motor neuron degeneration: an animal model for spinal muscular atrophy type III. Hum. Mol. Genet. 2000;9:341–346. doi: 10.1093/hmg/9.3.341. [DOI] [PubMed] [Google Scholar]
- 32.Bowerman M., Murray L.M., Beauvais A., Pinheiro B., Kothary R. A critical smn threshold in mice dictates onset of an intermediate spinal muscular atrophy phenotype associated with a distinct neuromuscular junction pathology. Neuromuscul. Disord. 2012;22:263–276. doi: 10.1016/j.nmd.2011.09.007. [DOI] [PubMed] [Google Scholar]
- 33.Lee Y.I., Mikesh M., Smith I., Rimer M., Thompson W. Muscles in a mouse model of spinal muscular atrophy show profound defects in neuromuscular development even in the absence of failure in neuromuscular transmission or loss of motor neurons. Dev. Biol. 2011;356:432–444. doi: 10.1016/j.ydbio.2011.05.667. [DOI] [PMC free article] [PubMed] [Google Scholar]
- 34.Kido Y., Burks D.J., Withers D., Bruning J.C., Kahn C.R., White M.F., Accili D. Tissue-specific insulin resistance in mice with mutations in the insulin receptor, IRS-1, and IRS-2. J. Clin. Invest. 2000;105:199–205. doi: 10.1172/JCI7917. [DOI] [PMC free article] [PubMed] [Google Scholar]
- 35.Orci L., Unger R.H. Functional subdivision of islets of Langerhans and possible role of D cells. Lancet. 1975;2:1243–1244. doi: 10.1016/s0140-6736(75)92078-4. [DOI] [PubMed] [Google Scholar]
- 36.Gannon M., Ray M.K., Van Zee K., Rausa F., Costa R.H., Wright C.V. Persistent expression of HNF6 in islet endocrine cells causes disrupted islet architecture and loss of beta cell function. Development. 2000;127:2883–2895. doi: 10.1242/dev.127.13.2883. [DOI] [PubMed] [Google Scholar]
- 37.Bosco D., Orci L., Meda P. Homologous but not heterologous contact increases the insulin secretion of individual pancreatic B-cells. Exp. Cell Res. 1989;184:72–80. doi: 10.1016/0014-4827(89)90365-0. [DOI] [PubMed] [Google Scholar]
- 38.Samols E., Stagner J.I. Intra-islet regulation. Am. J. Med. 1988;85:31–35. doi: 10.1016/0002-9343(88)90395-6. [DOI] [PubMed] [Google Scholar]
- 39.Postic C., Girard J. Contribution of de novo fatty acid synthesis to hepatic steatosis and insulin resistance: lessons from genetically engineered mice. J. Clin. Invest. 2008;118:829–838. doi: 10.1172/JCI34275. [DOI] [PMC free article] [PubMed] [Google Scholar]
- 40.Altarejos J.Y., Montminy M. CREB and the CRTC co-activators: sensors for hormonal and metabolic signals. Nat. Rev. Mol. Cell Biol. 2011;12:141–151. doi: 10.1038/nrm3072. [DOI] [PMC free article] [PubMed] [Google Scholar]
- 41.Quesada I., Tuduri E., Ripoll C., Nadal A. Physiology of the pancreatic alpha-cell and glucagon secretion: role in glucose homeostasis and diabetes. J. Endocrinol. 2008;199:5–19. doi: 10.1677/JOE-08-0290. [DOI] [PubMed] [Google Scholar]
- 42.Monani U.R., Sendtner M., Coovert D.D., Parsons D.W., Andreassi C., Le T.T., Jablonka S., Schrank B., Rossoll W., Prior T.W., et al. The human centromeric survival motor neuron gene (SMN2) rescues embryonic lethality in Smn(−/−) mice and results in a mouse with spinal muscular atrophy. Hum. Mol. Genet. 2000;9:333–339. doi: 10.1093/hmg/9.3.333. [DOI] [PubMed] [Google Scholar]
- 43.Hammond S.M., Gogliotti R.G., Rao V., Beauvais A., Kothary R., DiDonato C.J. Mouse survival motor neuron alleles that mimic SMN2 splicing and are inducible rescue embryonic lethality early in development but not late. PLoS One. 2010;5:e15887. doi: 10.1371/journal.pone.0015887. [DOI] [PMC free article] [PubMed] [Google Scholar]
- 44.Oh K.J., Han H.S., Kim M.J., Koo S.H. CREB and FoxO1: two transcription factors for the regulation of hepatic gluconeogenesis. BMB Rep. 2013;46:567–574. doi: 10.5483/BMBRep.2013.46.12.248. [DOI] [PMC free article] [PubMed] [Google Scholar]
- 45.Jiang G., Zhang B.B. Glucagon and regulation of glucose metabolism. Am. J. Physiol. Endocrinol. Metab. 2003;284:E671–E678. doi: 10.1152/ajpendo.00492.2002. [DOI] [PubMed] [Google Scholar]
- 46.Leahy P., Crawford D.R., Grossman G., Gronostajski R.M., Hanson R.W. CREB binding protein coordinates the function of multiple transcription factors including nuclear factor I to regulate phosphoenolpyruvate carboxykinase (GTP) gene transcription. J. Biol. Chem. 1999;274:8813–8822. doi: 10.1074/jbc.274.13.8813. [DOI] [PubMed] [Google Scholar]
- 47.El Ouaamari A., Kawamori D., Dirice E., Liew C.W., Shadrach J.L., Hu J., Katsuta H., Hollister-Lock J., Qian W.J., Wagers A.J., et al. Liver-derived systemic factors drive beta cell hyperplasia in insulin-resistant states. Cell Rep. 2013;3:401–410. doi: 10.1016/j.celrep.2013.01.007. [DOI] [PMC free article] [PubMed] [Google Scholar]
- 48.Longuet C., Robledo A.M., Dean E.D., Dai C., Ali S., McGuinness I., de Chavez V., Vuguin P.M., Charron M.J., Powers A.C., et al. Liver-specific disruption of the murine glucagon receptor produces alpha-cell hyperplasia: evidence for a circulating alpha-cell growth factor. Diabetes. 2013;62:1196–1205. doi: 10.2337/db11-1605. [DOI] [PMC free article] [PubMed] [Google Scholar]
- 49.Krones-Herzig A., Mesaros A., Metzger D., Ziegler A., Lemke U., Bruning J.C., Herzig S. Signal-dependent control of gluconeogenic key enzyme genes through coactivator-associated arginine methyltransferase 1. J. Biol. Chem. 2006;281:3025–3029. doi: 10.1074/jbc.M509770200. [DOI] [PubMed] [Google Scholar]
- 50.Crawford T.O., Sladky J.T., Hurko O., Besner-Johnston A., Kelley R.I. Abnormal fatty acid metabolism in childhood spinal muscular atrophy. Ann. Neurol. 1999;45:337–343. doi: 10.1002/1531-8249(199903)45:3<337::aid-ana9>3.0.co;2-u. [DOI] [PubMed] [Google Scholar]
- 51.Dahl D.S., Peters H.A. Lipid disturbances associated with spiral muscular atrophy. Clinical, electromyographic, histochemical, and lipid studies. Arch. Neurol. 1975;32:195–203. doi: 10.1001/archneur.1975.00490450075011. [DOI] [PubMed] [Google Scholar]
- 52.Quarfordt S.H., DeVivo D.C., Engel W.K., Levy R.I., Fredrickson D.S. Familial adult-onset proximal spinal muscular atrophy. Report of a family with type II hyperlipoproteinemia. Arch. Neurol. 1970;22:541–549. doi: 10.1001/archneur.1970.00480240061009. [DOI] [PubMed] [Google Scholar]
- 53.Tein I., Sloane A.E., Donner E.J., Lehotay D.C., Millington D.S., Kelley R.I. Fatty acid oxidation abnormalities in childhood-onset spinal muscular atrophy: primary or secondary defect(s)? Pediatr. Neurol. 1995;12:21–30. doi: 10.1016/0887-8994(94)00100-g. [DOI] [PubMed] [Google Scholar]
- 54.Lamarca N.H., Golden L., John R.M., Naini A., De Vivo D.C., Sproule D.M. Diabetic ketoacidosis in an adult patient with spinal muscular atrophy type ii: further evidence of extraneural pathology due to survival motor neuron 1 mutation? J. Child Neurol. 2013;8:1517–1520. doi: 10.1177/0883073812460096. [DOI] [PubMed] [Google Scholar]
- 55.Meister G., Fischer U. Assisted RNP assembly: SMN and PRMT5 complexes cooperate in the formation of spliceosomal UsnRNPs. EMBO J. 2002;21:5853–5863. doi: 10.1093/emboj/cdf585. [DOI] [PMC free article] [PubMed] [Google Scholar]
- 56.Tsai W.W., Niessen S., Goebel N., Yates J.R., III, Guccione E., Montminy M. PRMT5 modulates the metabolic response to fasting signals. Proc. Natl Acad. Sci. USA. 2013;110:8870–8875. doi: 10.1073/pnas.1304602110. [DOI] [PMC free article] [PubMed] [Google Scholar]
- 57.Majumder S., Varadharaj S., Ghoshal K., Monani U., Burghes A.H., Jacob S.T. Identification of a novel cyclic AMP-response element (CRE-II) and the role of CREB-1 in the cAMP-induced expression of the survival motor neuron (SMN) gene. J. Biol. Chem. 2004;279:14803–14811. doi: 10.1074/jbc.M308225200. [DOI] [PMC free article] [PubMed] [Google Scholar] [Retracted]
- 58.Mincheva S., Garcera A., Gou-Fabregas M., Encinas M., Dolcet X., Soler R.M. The canonical nuclear factor-kappaB pathway regulates cell survival in a developmental model of spinal cord motoneurons. J. Neurosci. 2011;31:6493–6503. doi: 10.1523/JNEUROSCI.0206-11.2011. [DOI] [PMC free article] [PubMed] [Google Scholar]
- 59.Shaywitz A.J., Greenberg M.E. CREB: a stimulus-induced transcription factor activated by a diverse array of extracellular signals. Annu. Rev. Biochem. 1999;68:821–861. doi: 10.1146/annurev.biochem.68.1.821. [DOI] [PubMed] [Google Scholar]
- 60.DiDonato C.J., Lorson C.L., De Repentigny Y., Simard L., Chartrand C., Androphy E.J., Kothary R. Regulation of murine survival motor neuron (Smn) protein levels by modifying Smn exon 7 splicing. Hum. Mol. Genet. 2001;10:2727–2736. doi: 10.1093/hmg/10.23.2727. [DOI] [PubMed] [Google Scholar]
Associated Data
This section collects any data citations, data availability statements, or supplementary materials included in this article.