

Abstract
The oxygenation state of erythrocytes is known to impact several cellular processes. As the only known O2-binding protein in red blood cells, haemoglobin has been implicated in the oxygenation-mediated control of cell pathways and properties. Band 3, an integral membrane protein linked to the spectrin/actin cytoskeleton, preferentially binds deoxygenated haemoglobin at its N-terminus, and has been postulated to participate in the mechanism by which oxygenation controls cellular processes. Because the ankyrin-binding site on band 3 is located near the deoxyHb (deoxygenated haemoglobin)-binding site, we hypothesized that deoxyHb might impact the association between band 3 and the underlying erythrocyte cytoskeleton, a link that is primarily established through band 3–ankyrin bridging. In the present paper we show that deoxygenation of human erythrocytes results in displacement of ankyrin from band 3, leading to release of the spectrin/actin cytoskeleton from the membrane. This weakening of membrane–cytoskeletal interactions during brief periods of deoxygenation could prove beneficial to blood flow, but during episodes of prolonged deoxygenation, such as during sickle cell occlusive crises, could promote unwanted membrane vesiculation.
Keywords: band 3–ankyrin bridge, deoxygenated haemoglobin (deoxyHb), erythrocyte membrane, membrane mechanical properties, red cell cytoskeleton
INTRODUCTION
In the course of respiratory gas exchange, an average human erythrocyte will cycle from its oxygenated state in the arteries to its deoxygenated state in the veins ~1500 times each day. Consistent with this O2 transport function, the human erythrocyte has evolved O2-sensitive mechanisms that allow it to respond to the O2 tension in its environment with adaptive changes in cell properties [1–3]
One major erythrocyte property that responds to oxygen tension is the partitioning of glucose metabolism between glycolysis and the PPP (pentose phosphate pathway) [4,5]. Glycolytic enzymes interact with regulatory sites on the erythrocyte membrane in fully oxygenated cells and dissociate from these sites in deoxygenated cells [6,7]. The net consequence of this reversible enzyme binding is a shift in glucose consumption from the PPP in oxygenated cells to glycolysis in deoxygenated cells [5]. This shift has been argued to be adaptive, since haemoglobin undergoes constant oxidation to methaemoglobin in oxygenated cells, and its reduction back to haemoglobin would be facilitated by the enhanced production of NADPH in the PPP.
Ion transport represents a second process in the RBC (red blood cell) that is regulated by O2 tension. Deoxygenation stimulates both Na+ /K+ /2Cl− co-transport and Na+ /H+ exchange, but decreases KCl co-transport [8,9]. All are thought to be involved in erythrocyte volume regulation, yielding a net volume decrease upon deoxygenation [10]. Although the adaptive advantage of modulating cell volume with O2 tension remains to be established, it has been suggested that an O2-regulated cation influx pathway termed Psickle contributes to the pathology of sickle cells during prolonged deoxygenation [11,12]
A third major O2-regulated process in human RBCs involves the erythrocyte’s modulation of vascular tone. Work by Sprague and Ellsworth [13] and others suggests that intra-erythrocyte ATP is discharged into the bloodstream during periods of low O2 tension. This ATP release can stimulate vasodilation (presumably via activation of NO production), thereby increasing perfusion of the constricted capillaries and enabling entrapped/retarded erythrocytes to transit more freely to the lungs. Along similar lines, Tejero et al. [14] and Singel and Stamler [15] have reported that haemoglobin-associated NO is released during periods of erythrocyte deoxygenation, also leading to vasodilation.
One mechanism to explain O2-regulated processes in erythrocytes involves the reversible association of deoxyHb (deoxygenated haemoglobin) with the cytoplasmic domain of the anion transport protein, band 3 [also known as AE1 (anion-exchanger protein 1) or SLC4A1 (soluble carrier family 4, anion-exchanger member 1)]. Because haemoglobin is the only known O2-binding protein in RBCs, and since band 3 contains the only known membrane-binding site for haemoglobin, it seemed logical to look for an O2-dependent switch in the haemoglobin–band 3 interaction. Motivation to explore a role for band 3 in this switch was strengthened by the observation that the band 3–haemoglobin interaction is O2-dependent, with deoxyHb showing much higher affinity for band 3 than oxygenated haemoglobin [7]. In the case of metabolic regulation by O2, the evidence for a band 3-mediated switch includes the observation that glycolytic enzymes associate with the N-terminus of band 3 in oxygenated cells, but are released from band 3 into the cytoplasm of deoxygenated cells [6,7]. Because the binding sites for glycolytic enzymes directly overlap with the docking site for deoxyHb, the simplest explanation of this behaviour is that deoxyHb (but not oxygenated haemoglobin) displaces the enzymes from band 3 [4–6,16,17]. Although no direct association of cation pumps or ATP transporters with band 3 has ever been demonstrated, the fact that the O2-dependence of cation transport [9] and ATP release [18] follows the O2-dependence of the haemoglobin–O2 interaction suggests that the reversible association of deoxyHb with band 3 might also somehow mediate a change in transport protein function.
A major bridge between the erythrocyte membrane and its spectrin/actin cytoskeleton involves the interaction between ankyrin and the cytoplasmic domain of band 3 [19,20]. Because the residues on band 3 that directly contact ankyrin lie adjacent to the sequence on band 3 that binds deoxyHb [21] the question naturally arose whether erythrocyte deoxygenation might similarly affect membrane–cytoskeletal linkages. In the present paper, we examine the effect of haemoglobin oxygenation on the association of ankyrin with band 3.
MATERIALS AND METHODS
Human whole blood was purchased from the Indiana Blood Center and was used at least 3 weeks before its expiration date. Na125I was obtained from PerkinElmer Life Science. Acrolein and DFP [di(propan-2-yl) phosphorofluoridate] were purchased from Sigma–Aldrich; chemiluminescence reagents and Triton X-100 were obtained from Pierce. The monoclonal anti-ankyrin antibody was purchased from Santa Cruz, whereas the anti-rabbit secondary antibody was obtained from Jackson ImmunoResearch. Streptavidin Q-dot 525 was from Invitrogen. All other chemicals were obtained from Sigma–Aldrich.
Ankyrin D3/D4 domain purification and radiolabelling
The D3/D4 band 3-binding domains of ankyrin were expressed as an intact 43 kDa polypeptide in Escherichia coli cells [BL21 (DE3)/pLysS strain purchased from Invitrogen]. The vector encoding amino acids 403–827 with an N-terminal Met-Ala-Ser sequence was a gift from Dr Vann Bennett (Duke University Medical Center, Durham, NC, U.S.A.). D3/D4 ankyrin expressed from this construct was purified according to the protocol developed by Davis and Bennett [20]. Protein concentration was determined using the Lowry protein assay. Ankyrin was radiolabelled to a specific activity of 25000 c.p.m./μg with 1 mCi of Na125I as described previously [19]. Prior to use, ankyrin was centrifuged at 40000 g for 2 h at 4°C to remove any insoluble material.
Preparation of erythrocytes and KI-IOVs (potassium iodide-stripped inside-out membrane vesicles) for protein-binding studies
KI-IOVs were prepared from fresh blood as described previously [19]. Briefly, RBCs were washed with PBS (137 mM NaCl, 2.7 mM KCl, 8.1 mM K2HPO4 and 1.5 mM KH2PO4, pH 7.4), and the ghosts were lysed in a hypotonic solution of 5 mM sodium phosphate and 1 mM EDTA, pH 8.0 containing 30 μg/ml PMSF. The lysate was centrifuged at 25000 g for 20 min at ??°C, and, and the supernatant was removed. Membrane pellets were re-suspended and washed three additional times in lysis buffer. Ghosts were then re-suspended in a 100-fold excess of buffer containing 0.5 mM EDTA, 0.5 mM DTT (dithiothreitol), 40 μg/ml PMSF, pH 8.0, at 4°C, and then warmed to 37°C over 30 min, followed by centrifugation at 25000 g for 30 min to pellet the inside-out membrane vesicles. The remaining peripheral proteins were removed by incubation for 30 min at 37°C in a 100-fold excess of 1 M KI, 25 mM sodium phosphate, 1 mM EDTA, 0.5 mM DTT and 40 μg/ml PMSF, pH 7.5. The resulting KIIOVs were centrifuged for 30 min at 25000 g, and then washed twice with a solution of 5 mM sodium phosphate, 1 mM EDTA and 0.5 mM DTT, pH 8.0. A Bradford protein assay kit (Bio-Rad Laboratories) was used to determine membrane protein concentrations.
Haemoglobin lysate preparation
Haemoglobin was prepared from freshly drawn human blood following informed consent. Briefly, RBCs were isolated from the plasma and buffy coat and then washed three times with isotonic NaCl. Cells were haemolysed in a solution of 5 mM sodium phosphate and 1 mM EDTA, pH 8.0 containing 30 μg/ml PMSF, and centrifuged at 40000 g for 20 min at 4°C. Supernatants were purified on a Sephadex G-100 gel filtration column in 0.1 M NaCl and then dialysed overnight in >40-fold excess of 0.01 M Hepes buffer, pH 7.7. This separation method removes 2,3-diphosphoglycerate and other modulating ligands from haemoglobin. The haemoglobin was then stored at − 80°C.
Ankyrin-binding assay
KI-IOVs (30 μg/ml) were suspended in binding buffer (5% sucrose, 50 mM sodium phosphate, 50 mM boric acid, 30 mM NaCl, 1 mM EDTA and 0.2 mM DTT, pH 7.2) and allowed to incubate with 250 μM oxygenated haemoglobin or deoxyHb for 1 h at room temperature (20°C) in a 2-ml tube sealed tightly with a rubber septum. When deoxygenation was desired, a hypodermic syringe was inserted into the septum and used to blow humidified argon over the surface of the suspension. A second syringe was inserted through the same septum to allow escape of the humidified argon from the compartment. In other studies, haemoglobin deoxygenation was achieved by the injection of 10 mM dithionite through the septum into the suspension. [125I]Ankyrin fragments (final concentration 6 μg/ml) were also added through the septum, and the suspension was further treated with argon for the 2-h binding period. Samples were then centrifuged at 43000 g for 30 min at 4°C, and pellets were assayed for [125I]ankyrin using a Cobra Auto-Gamma counter (Packard).
Analysis of band 3 content in detergent extracted membrane cytoskeletons
Quantifictation of intact band 3 in RBC cytoskeletons was difficult due to the diffuse nature of the anion transporter’s banding pattern in SDS/PAGE. To avoid this problem, RBCs were isolated from freshly drawn blood, washed three times with PBS and then incubated at 50% haematocrit with 1 mg/ml α-chymotrypsin for 1 h at 37°C. Chymotrypsin was then inhibited by incubating the RBCs in 100 μM Tos-Phe-CH2Cl (tosylphenylalanylchloromethane or TPCK) for 1 h at room temperature. After washing twice in PBS to remove unbound chymotrypsin, half of the erythrocytes were deoxygenated for 90 min using the previously described argon flush procedure. To corroborate that chymotrypsin digestion did not affect the association of band 3 with ankyrin, a non-digested sample of washed erythrocytes was also run in parallel to the chymotrypsin-digested sample. Samples of both oxy- and deoxy-genated RBCs were solubilized in 2% n-octyl glucoside, 20 μg/ml pepstatin A, 40 μg/ml PMSF, 20 μg/ml leupeptin, 0.5 mM DTT and 1 mM EDTA, and the solubilized membrane fraction and insoluble membrane skeletons were separated by layering on to a 35% sucrose cushion and centrifuging at 85000 g for 90 min at 4°C. Pellets were dissolved in SDS and run on a 4–15% gradient SDS polyacrylamide gel as described by Laemmli [21b]. After staining, the bands were quantified using densitometry scanning.
Immunofluorescence assay of ankyrin
Immunofluorescence of fixed and permeabilized erythrocytes was performed according to previously published protocols [6]. Briefly, blood was obtained via venepuncture from a healthy human donor following informed consent. RBCs were isolated by centrifuging the blood at 2000 g for 10 min at room temperature, and then discarding the plasma and buffy coat. RBCs were washed with PBS, re-suspended at 10% haematocrit, gently evacuated for 10 min and finally deoxygenated for 50 min by mild flushing with humidified argon. RBCs were fixed for 20 min in 1% paraformaldehyde, centrifuged and then re-suspended in freshly prepared 0.5% acrolein in PBS without glucose. Fixed erythrocytes were washed in PBS containing 0.1 M glycine and permeabilized in the same buffer containing 0.1% Triton X-100 for 5 min. RBCs were washed in PBS containing 0.05 M glycine and 0.2% fish skin gelatin, and then blocked for 1 h in the same buffer. A monoclonal anti-ankyrin antibody or a goat anti-(lactate dehydrogenase) antibody was incubated with the RBC suspension, and antibody binding was visualized using a Cy2 (carbocyanine)-conjugated, anti-goat or a Cy3 (indocarbocyanine)-conjugated anti-mouse secondary antibody. A Bio-Rad Laboratories MRC1024 confocal microscope on a Diaphot 300 inverted microscope (Nikon) using a 60× 1.4 NA (numerical aperture) oil-immersion lens was used to image the samples. The acquisition software used was Lasersharp 2000 version 5.0 (Bio-Rad Laboratories). Images were converted to tif format using ThumbsPlus version 6.0 (Cerious Software) and assembled into Figures using Photoshop version 7.0 (Adobe Systems).
Single-particle tracking of band 3 diffusion in oxygenated and deoxygenated intact RBCs
The detailed method for labelling band 3 in intact erythrocytes with quantum dots for subsequent single particle tracking studies has been described previously [22]. Briefly, blood from healthy volunteers was drawn by venepuncture following informed consent. Cells were centrifuged at 1000 g for 2 min at 20°C to remove both plasma and white cells, and the residual erythrocytes were washed three times in PBS containing 5 mM glucose. Washed erythrocytes were incubated with sufficient DIDS (4,4′-di-isothiocyanostilbene-2,2′-disulfonate)–biotin conjugate for 1.5 h at 37°C to label ~1 band 3 molecule per cell, after which the cells were incubated with streptavidin-coupled quantum dots for 25 min. Labelled cells were placed in a sealed cuvette and exposed to a stream of argon until fully deoxygenated, as determined by their absorption spectrum. Deoxygenated RBCs were then transferred via an argon-flushed syringe to a glass-bottom chamber (Ted) that was sealed with a septum. This assembly maintained the cells in their deoxygenated state during the subsequent single particle tracking analyses.
RESULTS
Deoxygenation reduces ankyrin binding to band 3
To explore whether changes in O2 tension might regulate the linkage between the erythrocyte membrane and its spectrin/actin-based cytoskeleton, we first examined the effects of oxygenation on the binding of the prominent integral membrane protein, band 3, to ankyrin, the major bridge between the membrane bilayer and its spectrin-based cytoskeleton. Initial biochemical studies were performed using the D3/D4 domain of ankyrin that has been demonstrated to display similar band 3-binding affinity to intact ankyrin [23]. The purified, 125I-radiolabelled 45.6 kDa ankyrin fragment was allowed to bind to KI-IOVs in a sealed tube containing oxygenated haemoglobin or deoxyHb (see the Materials and methods section), after which the tube was centrifuged and the amount of radiolabeled ankyrin in the pellet was measured. As seen in Figure 1, a 2.8-fold reduction in ankyrin binding to band 3 was observed in the presence of deoxyHb compared to oxygenated haemoglobin. Similarly, when the binding assay was performed in the presence of 10mM dithionite, a molecule commonly used to consume free oxygen, a 3.8-fold reduction in ankyrin binding was observed (Figure 1).
Figure 1. DeoxyHb blocks ankyrin binding to KI-IOVs.
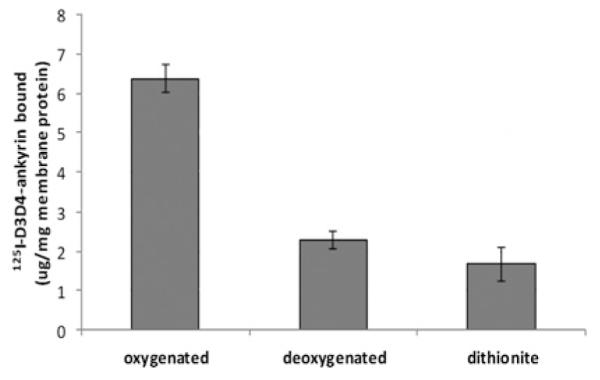
KI-IOVs (final concentration of 30 μg/) were mixed with 250 μM oxygenated haemoglobin or deoxyHb (humidified argon flush in vacuum) for 1 h at room temperature in a 2-ml tube sealed tightly with a rubber septum. Ankyrin fragment was added (final concentration of 6 μg/ml) to the closed system and the suspension was further treated with argon throughout the 2 h binding period. The suspensions were centrifuged in their sealed tubes at 25000 g and pellets were assayed for [125I]ankyrin binding using a gamma counter. Results are means ± S.D., n = 4. As a negative control, 10 mM dithionite was used in place of argon.
To determine the concentration dependence of the deoxyHb-induced blockade of ankyrin association with KI-IOVs, the concentration of D3/D4 ankyrin and membrane protein concentrations were kept constant, while increasing amounts of deoxyHb were incubated with the KI-IOVs. Using the same methods described above, half-maximal ankyrin competition was observed at ~18 μM deoxyHb, and binding was reduced to 20% of that in oxygenated erythrocytes by 32 μM deoxyHb (Figure 2). Since the total concentration of haemoglobin in red cells is 5 mM (tetramer) [24], more than sufficient deoxyHb can obviously be generated in deoxygenated tissues to influence ankyrin binding in vivo.
Figure 2. Concentration dependence of deoxyHb blockade of ankyrin binding to KI-IOVs.

KI-IOVs (30 μg/ml) were incubated in an air-tight 2-ml plastic tube with increasing concentrations of haemoglobin at room temperature. The system was then either left untreated (oxygenated) or mildly flushed with humidified argon for 1 h. Ankyrin (final concentration of 6 μg/ml) was added through the rubber stopper and its binding to KI-IOVs was measured as described in Figure 1. Results are means ± S.D., n = 3.
Detergent extracts from deoxygenated RBC membranes display reduced band 3 retention
If RBC deoxygenation indeed leads to disruption of the ankyrin– band 3 bridge, one would expect band 3 to dissociate from the cytoskeleton under deoxygenated conditions in intact cells. To test this hypothesis, whole red cells were either oxygenated or deoxygenated, as described in Materials and methods section, and then extracted under the same conditions in 2% n-octyl glucoside to quantify the band 3 retained in the spectrin/actin cytoskeletons. As anticipated from the in vitro data, ~1.5 times more band 3 (normalized to actin) was retained in the detergent-insoluble cytoskeletal fraction under oxygenated compared with deoxygenated conditions, regardless of whether the amount of retained band 3 was quantified by densitometry of the intact polypeptide or analysis of the more sharply defined 65 kDa cleavage product (Figure 3). These data demonstrate that the O2-regulated rupture of the band 3–ankyrin bridge also occurs in intact erythrocytes.
Figure 3. Quantification of band 3 retention in membrane cytoskeletons following detergent extraction of intact erythrocytes under oxygenated and deoxygenated conditions.
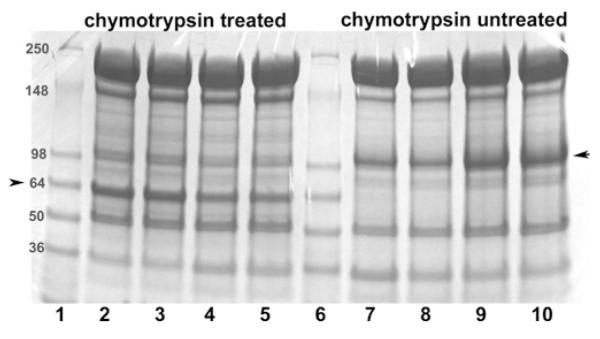
To improve the quantification of band 3 in detergent-extracted membrane cytoskeletons, a fraction of the intact erythrocytes were either treated with chymotrypsin (lanes 2–5) or left unmodified (lanes 7–10). Mild digestion with chymotrypsin selectively cleaves an external loop on band 3, yielding a 65 kDa non-glycosylated N-terminal fragment and 35 kDa glycosylated C-terminal fragment (see the Materials and methods section). Because the non-glycosylated N-terminal fragment migrates more sharply and in an emptier region of the SDS/PAGE gel than intact band 3, it can be more precisely quantified than intact band 3. Importantly, under the digestion conditions used, no other known membrane proteins are cleaved and the two complementary fragments of band 3 remain tightly associated, allowing band 3 to retain all normal functions including unmodified anion transport and ankyrin binding [47,48]. Following the above treatments and prior to detergent extraction, both RBC preparations (digested or undigested) were equilibrated under a gentle stream of humidified argon or air, as described in the Materials and methods section. n-Octyl glucoside (2%) was then added to the sealed tubes and membrane cytoskeletons were extracted by centrifugation through a sucrose cushion at 85000 g. The relative amount of band 3 retained in the spectrin/actin cytoskeletons was then determined using 4–15% gradient SDS/PAGE gels followed by staining with Coomassie Blue. Lanes 1 and 6: molecular mass markers (in kDa); lanes 2 and 3, chymotrypsin-digested oxygenated samples; lanes 4 and 5, chymotrypsin-digested deoxygenated samples; lanes 7 and 8, deoxygenated non-digested samples; and lanes 9 and 10, oxygenated non-digested samples. Each pair of identical lanes was performed on a parallel, but different preparation of erythrocytes and hence constitute independent experiments. The position of band 3 or its 65 kDa fragment is marked with an arrow. The band 3/actin ratio (R) in the cytoskeletal pellet derived from oxygenated and deoxygenated cells was determined using the following formula: R = R oxy/Rdeoxy, where Roxy = band 3oxy/actinoxy and Rdeoxy = band 3deoxy/actindeoxy. Because the presence of residual n-octyl glucoside in the pelleted cytoskeletons, led to somewhat diffuse protein bands, the above experiment was repeated 11 times and the aforementioned ratio was averaged from all eleven experiments, yielding the average value of 1.5 ± 0.17.
Ankyrin remains bound to the cytoskeleton under deoxygenated conditions in vivo
Although retention of band 3 in the detergent-resistant spectrin/actin skeletons was found to decrease in response to deoxygenation, we still wished to know whether the dissociated ankyrin would be completely released from the membrane or remain bound to the ankyrin complex due to tight interactions with other proteins in the complex. This question was addressed by examining the location of ankyrin in intact oxygenated and deoxygenated RBCs by immunofluorescence microscopy. As seen in Figure 4 (left-hand panel), although deoxygenation by argon flushing led to displacement of lactate dehydrogenase from the membrane, no translocation of ankyrin to the cytosol was observed in response to the same stimulus. These data suggest that although the ankyrin–band 3 bridge is ruptured by haemoglobin deoxygenation, other interactions tethering ankyrin to the complex (e.g. spectrin, protein 4.2, RhAG [Rh-associated glycoprotein], CD44 [25–28]) prevent it from diffusing away into the cytoplasm. These residual contacts with ankyrin should enable a more facile re-establishment of the ankyrin–band 3 bridge upon RBC reoxygenation.
Figure 4. Increased accessibility of ankyrin following deoxygenation of human erythrocytes.
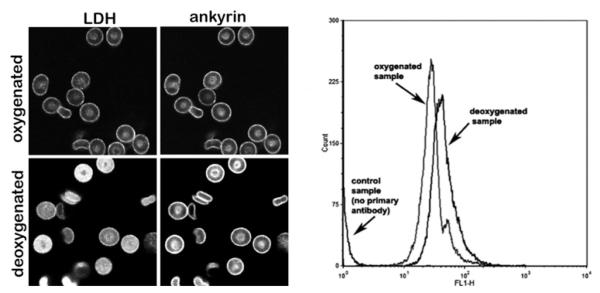
Left-hand panels, immunofluorescence staining of intact erythrocytes with a monoclonal anti-ankyrin (right-hand images) and polyclonal anti-LDH (left-hand images) antibody under oxygenated (top row) and deoxygenated (lower row) conditions. Right-hand panel, the increased accessibility of ankyrin epitopes seen in the fluorescence micrographs of deoxygenated erythrocytes is confirmed by flow cytometry analysis of fixed oxygenated compared with deoxygenated cells. Stained RBCs (10 μl; see the Materials and methods section) were diluted 1:200 in PBS for flow cytometry. Quantification of fluorescence intensity was performed using a FACSCalibur flow cytometer (BD Biosciences) and analysed with CellQuest software (BD Biosciences). A total of 50000 events were analysed.
In the course of the present study, we noted repeatedly that the intensity of ankyrin staining in deoxygenated cells was stronger than its intensity in oxygenated cells. Since the cells were invariably fixed in their oxygenated or deoxygenated state prior to immunofluorescence staining, the hypothesis arose that the enhanced ankyrin staining under deoxygenated conditions could have derived from increased exposure/accessibility of the ankyrin epitopes to the anti-ankyrin antibody. This observation was, in fact, supported by flow cytometry data showing a 40% increase in mean fluorescence intensity of the fixed/stained erythrocytes under deoxygenated conditions (Figure 4, right-hand panel), suggesting that while still tethered to the spectrin/actin cytoskeleton, ankyrin is significantly less occluded in deoxygenated than oxygenated erythrocytes.
Single-particle tracking confirms that band 3 diffuses more freely in intact deoxygenated erythrocytes
To further confirm that deoxygenation of erythrocytes releases band 3 from its attachment to the membrane skeleton, single-particle tracking was used to compare the diffusion of band 3 in membranes of intact, oxygenated and deoxygenated RBCs (Figure 5). Analysis of the trajectories of single band 3 molecules in >300 deoxygenated cells revealed that the distribution of microscopic diffusion coefficients (Dμ, diffusion over short time spans) was characterized by two Gaussian distributions with mean values of 1.0×10⁻¹⁰ cm2/s (65% of the total) and 5.6×10⁻¹² cm2/s (35% of the total). In contrast, band 3 diffusion in oxygenated RBCs was defined by two Gaussian distributions with mean values of 2.2× 10⁻¹⁰ cm2/s (23% of the total) and 1.4×10⁻¹¹ cm2/s (77% of the total). Although both less mobile (Dμ~10−12 cm2/s) and freely diffusing (Dμ~10−10 cm2/s) population of band 3 were observed under deoxygenated and oxygenated conditions, the freely diffusing population (Dμ ~10−10 cm2/s) comprised only ~23% of the band 3 in oxygenated cells, whereas the same population comprised ~65% of the band 3 in deoxygenated cells. These data suggest that less band 3 is cytoskeletally attached in intact deoxygenated than oxygenated cells, consistent with the binding data presented above.
Figure 5. Comparison of the diffusion properties of band 3 in intact oxygenated (Oxy) and deoxygenated (Deoxy) erythrocytes by single-particle tracking.

The microscopic diffusion coefficient (top panels), macroscopic diffusion coefficient (middle panels) and compartment size of band 3 diffusion (bottom panels) all reveal a much more freely diffusing band 3 in deoxygenated erythrocytes.
Analysis of the macroscopic diffusion coefficients of band 3 (DM, diffusion over longer time spans) also revealed a difference in mobility between oxygenated and deoxygenated erythrocytes (Figure 5). Although both data sets could be accurately fit to a single Gaussian distribution, the mean value of DM in deoxygenated cells was twice as fast (3.3×10⁻¹² cm2/s compared with 1.7×10⁻¹² cm2/s) as the mean DM value in oxygenated RBCs. This enhanced long-range mobility in deoxygenated cells was also suggested by a general shift toward larger compartment sizes for band 3 diffusion in the deoxygenated cells. Taken together, all three band 3 diffusion parameters argue that the anion transporter is less constrained in deoxygenated than oxygenated erythrocytes. The most reasonable explanation of this observation is that the band 3-ankyrin bridge to the spectrin/actin cytoskeleton is also regulated by O2.
DISCUSSION
For many years erythrocytes have been depicted as inert ‘bags of haemoglobin’ that cannot respond to their environment other than to passively take up and release gases. As research has progressed, however, evidence has emerged that the red cell does in fact communicate with its environment and even participates in regulation of haemostasis [29], blood pH and redox status [30], immune function [31], vascular tone [32], and blood pressure [33]. Moreover, to facilitate these regulatory tasks, the erythrocyte is equipped with a plethora of signalling enzymes and second messengers that respond to stimuli as rapidly as their counterparts in other cells [34]. Although erythrocyte signalling components have been shown to be activated by such stimuli as insulin [35], prostaglandins [36], epinephrine [37], NO [38], platelet releasates [39], hypertensive agents [40], ADP [41] and H2O2 [42], it is perhaps not surprising that one of the most prominent signalling molecules to modulate red cell biology is O2, the cell’s most important cargo.
In the present paper, we have demonstrated that O2 modulates the primary bridge linking the erythrocyte phospholipid bilayer to its underlying spectrin/actin cytoskeleton. Not only was deoxyHb found to compete with [125I]D3/D4 ankyrin for binding to KI-IOVs, but it was also observed to displace band 3 from detergent-insoluble cytoskeletons derived from whole deoxygenated erythrocytes, increase the diffusion coefficient of 40% of the band 3 by two orders of magnitude and double the compartment size in which the average band 3 diffuses laterally in the membrane. Why a transient rupture of the band 3-ankyrin bridge might benefit the red cell under sustained deoxygenated conditions cannot be established from our data, but it is not inconceivable that an erythrocyte, trapped in a deoxygenated capillary, might squeeze past an obstructing blockade more easily if its membrane is mildly weakened.
The mechanism whereby deoxyHb displaces glycolytic enzymes from the membrane has been shown to involve direct competition between deoxyHb and glycolytic enzymes for the same sequence on band 3 [7], i.e. residues ~1–30 at the polypeptide’s N-terminus [43]. However, this direct competition mechanism cannot account for displacement of ankyrin from band 3, since deletion of residues 1–55 of band 3 has been shown to have no effect on ankyrin affinity [23]. Rather, we propose that the bulky sizes of deoxyHb and ankyrin sterically prevent their simultaneous docking to adjacent, but non-overlapping, sites on band 3. Thus the ankyrin-binding site on band 3 involves at least two protruding loops comprising residues 63–74 and 175–185 on the surface of band 3 [23,44]). Since the distance from these loops to N-terminus of band 3 is only 14 Å (1Å = 0.1 nm), direct steric overlap between deoxyHb (diameter ~56 Å) and ankyrin (diameter ~74 Å) would seem to be almost inevitable.
As noted above, under fully deoxygenated conditions, ~40% of the band 3 in an intact cell diffuses two orders of magnitude faster than it does under oxygenated conditions. In earlier band 3 diffusion studies on ankyrin- and adducin-knockout mice, we observed that ~40% and ~33% of the band 3 in intact cells was immobilized by ankyrin and adducin respectively [45]. Although the 40% of band 3 that diffuses faster in deoxygenated cells could have derived in part from both the ankyrin- and adducin-tethered populations of band 3, the fact that the fraction of band 3 attached to ankyrin matches precisely the fraction of band 3 released from the cytoskeleton upon deoxygenation argues that only the ankyrin–band 3 interaction is subject to O2 regulation.
Finally, whereas the various responses of healthy erythrocytes to O2 regulation can be argued to improve the fitness of the cell, it is also conceivable that the same processes might lead to unwanted side effects when components of the regulatory pathway malfunction. In sickle cell anaemia, a deoxygenation-induced calcium leak is known to activate a KCl efflux channel, leading to cell shrinkage, further HbS (sickle haemoglobin) sickling, vascular occlusion and the consequent painful crises [46]. Release of small membrane vesicles from the sickle cells is also seen during these anoxic vaso-occlusive episodes, suggesting that some type of membrane destabilization may be triggered during prolonged sickle cell deoxygenation. On the basis of the results of the present study, we suggest that one contributing factor to this membrane blebbing might be the rupture of band 3–ankyrin bridges during sustained periods of oxygen deprivation.
ACKNOWLEDGEMENTS
We thank Dr Patrick Hein (Perdue University) for helping in the editing of this manuscript prior to submission.
FUNDING This work was supported by the National Institutes of Health [grant number R01GM24417-33].
Abbreviations used
- deoxyHb
deoxygenated haemoglobin
- DTT
dithiothreitol
- KI-IOV
potassium iodide-stripped inside-out membrane vesicle
- PPP
pentose phosphate pathway
- RBC
red blood cell
Footnotes
AUTHORSHIP CONTRIBUTIONS Marko Stefanovic, Estela Puchulu-Campanella and Gayani Kodippili performed experiments, analysed data and helped write the paper. Philip S. Low helped design the studies, analyse the data and refine the writing of the paper.
REFERENCES
- 1.Cossins AR, Gibson JS. Volume-sensitive transport systems and volume homeostasis in vertebrate red blood cells. J. Exp. Biol. 1997;200:343–352. doi: 10.1242/jeb.200.2.343. [DOI] [PubMed] [Google Scholar]
- 2.Gibson JS, Cossins AR, Ellory JC. Oxygen-sensitive membrane transporters in vertebrate red cells. J. Exp. Biol. 2000;203:1395–1407. doi: 10.1242/jeb.203.9.1395. [DOI] [PubMed] [Google Scholar]
- 3.Jagger JE, Bateman RM, Ellsworth ML, Ellis CG. Role of erythrocyte in regulating local O2 delivery mediated by hemoglobin oxygenation. Am. J. Physiol.: Heart Circ. Physiol. 2001;280:H2833–H2839. doi: 10.1152/ajpheart.2001.280.6.H2833. [DOI] [PubMed] [Google Scholar]
- 4.Messana I, Orlando M, Cassiano L, Pennacchietti L, Zuppi C, Castagnola M, Giardina B. Human erythrocyte metabolism is modulated by the O2-linked transition of hemoglobin. FEBS Lett. 1996;390:25–28. doi: 10.1016/0014-5793(96)00624-2. [DOI] [PubMed] [Google Scholar]
- 5.Lewis IA, Campanella ME, Markley JL, Low PS. Role of band 3 in regulating metabolic flux of red blood cells. Proc. Natl. Acad. Sci. U.S.A. 2009;106:18515–18520. doi: 10.1073/pnas.0905999106. [DOI] [PMC free article] [PubMed] [Google Scholar]
- 6.Campanella ME, Chu HY, Low PS. Assembly and regulation of a glycolytic enzyme complex on the human erythrocyte membrane. Proc. Natl. Acad. Sci. U.S.A. 2005;102:2402–2407. doi: 10.1073/pnas.0409741102. [DOI] [PMC free article] [PubMed] [Google Scholar]
- 7.Campanella ME, Chu HY, Wandersee NJ, Peters LL, Mohandas N, Gilligan DM, Low PS. Characterization of glycolytic enzyme interactions with murine erythrocyte membranes in wild-type and membrane protein knockout mice. Blood. 2008;112:3900–3906. doi: 10.1182/blood-2008-03-146159. [DOI] [PMC free article] [PubMed] [Google Scholar]
- 8.Gibson JS, Speake PF, Ellory JC. Differential oxygen sensitivity of the K+-Cl− cotransporter in normal and sickle human red blood cells. J. Physiol. 1998;511:225–234. doi: 10.1111/j.1469-7793.1998.225bi.x. [DOI] [PMC free article] [PubMed] [Google Scholar]
- 9.Chasis JA, Coulombel L, Conboy J, McGee S, Andrews K, Kan YW, Mohandas N. Differentiation-associated switches in protein 4.1 expression : synthesis of multiple structural isoforms during normal human erythropoiesis. J. Clin. Invest. 1993;91:329–338. doi: 10.1172/JCI116189. [DOI] [PMC free article] [PubMed] [Google Scholar]
- 10.Jacobs MH, Parpart AK. Osmotic properties of the erythrocyte: II. The influence of pH, temperature, and oxygen tension on hemolysis by hypotonic solutions. Biol. Bull. 1931;60:95–119. [Google Scholar]
- 11.Brugnara C, Gee B, Armsby CC, Kurth S, Sakamoto M, Rifai N, Alper SL, Platt OS. Therapy with oral clotrimazole induces inhibition of the Gardos channel and reduction of erythrocyte dehydration in patients with sickle cell disease. J. Clin. Invest. 1996;97:1227–1234. doi: 10.1172/JCI118537. [DOI] [PMC free article] [PubMed] [Google Scholar]
- 12.Joiner CH, Dew A, Ge DL. Deoxygenation-induced cation fluxes in sickle cells: relationship between net potassium efflux and net sodium influx. Blood Cells. 1988;13:339–354. [PubMed] [Google Scholar]
- 13.Sprague RS, Ellsworth ML. Erythrocyte-derived ATP and perfusion distribution: role of intracellular and intercellular communication. Microcirculation. 2012;9:430–439. doi: 10.1111/j.1549-8719.2011.00158.x. [DOI] [PMC free article] [PubMed] [Google Scholar]
- 14.Tejero J, Basu S, Helms C, Hogg N, King SB, Kim-Shapiro DB, Gladwin MT. Low NO concentration-dependence of the reductive nitrosylation reaction of hemoglobin. J. Biol. Chem. 2012;287:18262–18274. doi: 10.1074/jbc.M111.298927. [DOI] [PMC free article] [PubMed] [Google Scholar]
- 15.Singel DJ, Stamler JS. Chemical physiology of blood flow regulation by red blood cells. Ann. Rev. Physiol. 2004;67:99–145. doi: 10.1146/annurev.physiol.67.060603.090918. [DOI] [PubMed] [Google Scholar]
- 16.Weber RE, Voelter W, Fago A, Echner H, Campanella E, Low PS. Modulation of red cell glycolysis: interactions between vertebrate hemoglobins and cytoplasmic domains of band 3 red cell membrane proteins. Am. J. Physiol.: Regul., Integr. Comp. Physiol. 2004;287:R454–R464. doi: 10.1152/ajpregu.00060.2004. [DOI] [PubMed] [Google Scholar]
- 17.Kinoshita A, Tsukada K, Soga T, Hishiki T, Ueno Y, Nakayama Y, Tomita M, Suematsu M. Roles of hemoglobin allostery in hypoxia-induced metabolic alterations in erythrocytes. J. Biol. Chem. 2007;282:10731–10741. doi: 10.1074/jbc.M610717200. [DOI] [PubMed] [Google Scholar]
- 18.Bergfeld GR, Forrester T. Release of ATP from human erythrocytes in response to a brief period of hypoxia and hypercapnia. Cardiovasc. Res. 1992;26:40–47. doi: 10.1093/cvr/26.1.40. [DOI] [PubMed] [Google Scholar]
- 19.Bennett V. Proteins involved in membrane-cytoskeleton association in human-erythrocytes : spectrin, ankyrin, and band-3. Methods Enzymol. 1983;96:313–324. doi: 10.1016/s0076-6879(83)96029-9. [DOI] [PubMed] [Google Scholar]
- 20.Davis LH, Bennett V. Mapping the binding sites of human erythrocyte ankyrin for the anion exchanger and spectrin. J. Biol. Chem. 1990;265:10589–10596. [PubMed] [Google Scholar]
- 21.Willardson BM, Thevenin BJ, Harrison ML, Kuster WM, Benson MD, Low PS. Localization of the ankyrin-binding site on erythrocyte membrane protein, band 3. J. Biol. Chem. 1989;264:15893–15899. [PubMed] [Google Scholar]
- 21b.Laemmli UK. Cleavage of structural proteins during the assembly of the head of bacteriophage T4. 1970;227:680–685. doi: 10.1038/227680a0. [DOI] [PubMed] [Google Scholar]
- 22.Kodippili GC, Spector J, Sullivan C, Kuypers FA, Labotka R, Gallagher PG, Ritchie K, Low PS. Imaging of the diffusion of single band 3 molecules on normal and mutant erythrocytes. Blood. 2009;113:6237–6245. doi: 10.1182/blood-2009-02-205450. [DOI] [PMC free article] [PubMed] [Google Scholar]
- 23.Chang SH, Low PS. Identification of a critical ankyrin-binding loop on the cytoplasmic domain of erythrocyte membrane band 3 by crystal structure analysis and site-directed mutagenesis. J. Biol. Chem. 2003;278:6879–6884. doi: 10.1074/jbc.M211137200. [DOI] [PubMed] [Google Scholar]
- 24.Shaklai N, Sharma VS, Ranney HM. Interaction of sickle cell hemoglobin with erythrocyte membranes. Proc. Natl. Acad. Sci. U.S.A. 1981;78:65–68. doi: 10.1073/pnas.78.1.65. [DOI] [PMC free article] [PubMed] [Google Scholar]
- 25.Kennedy SP, Warren SL, Forget BG, Morrow JS. Ankyrin binds to the 15th repetitive unit of erythroid and nonerythroid beta-spectrin. J. Biol. Chem. 1991;115:267–277. doi: 10.1083/jcb.115.1.267. [DOI] [PMC free article] [PubMed] [Google Scholar]
- 26.Rybicki AC, Heath R, Wolf JL, Lubin B, Schwartz RS. Deficiency of protein 4.2 in erythrocytes from a patient with a Coombs negative hemolytic anemia. Evidence for a role of protein 4.2 in stabilizing ankyrin on the membrane. J. Clin. Invest. 1988;81:893–901. doi: 10.1172/JCI113400. [DOI] [PMC free article] [PubMed] [Google Scholar]
- 27.Nicolas V, Mouro-Chanteloup I, Lopez C, Gane P, Gimm A, Mohandas N, Carton JP, Le Van Kim C, Colin Y. Functional interaction between Rh proteins and the spectrin-based skeleton in erythroid and epithelial cells. Transfus. Clin. Biol. 2006;13:23–28. doi: 10.1016/j.tracli.2006.02.019. [DOI] [PubMed] [Google Scholar]
- 28.van den Akker E, Satchwell TJ, Williamson RC, Toye AM. Band 3 multiprotein complexes in the red cell membrane; of mice and men. Blood Cells, Mol., Dis. 2010;45:1–8. doi: 10.1016/j.bcmd.2010.02.019. [DOI] [PubMed] [Google Scholar]
- 29.Marcus A, Safier L. Thromboregulation: multicellular modulation of platelet reactivity in hemostasis and thrombosis. FASEB J. 1993;7:516–522. doi: 10.1096/fasebj.7.6.8472890. [DOI] [PubMed] [Google Scholar]
- 30.Di Simplicio P, Cacace MG, Lusini L, Giannerini F, Giustarini D, Rossi R. Role of protein SH groups in redox homeostasis: the erythrocyte as a model system. Arch. Biochem. Biophys. 1998;355:145–152. doi: 10.1006/abbi.1998.0694. [DOI] [PubMed] [Google Scholar]
- 31.Pascual M, Schifferli JA. The binding of immune complexes by the erythrocyte complement receptor 1 (CR1) Immunopharmacology. 1992;24:101–106. doi: 10.1016/0162-3109(92)90016-6. [DOI] [PubMed] [Google Scholar]
- 32.Ellsworth ML, Ellis CG, Goldman D, Stephenson AH, Dietrich HH, Sprague RS. Erythrocytes: oxygen sensors and modulators of vascular tone. Physiology. 2009;24:107–116. doi: 10.1152/physiol.00038.2008. [DOI] [PMC free article] [PubMed] [Google Scholar]
- 33.Coca A, Garay R. The erythrocyte as a cellular model for the clinical investigation of essential hypertensive patients. In: Coca A, Garay R, editors. Ionic Transport in Hypertension: New Perspectives. CRC Press; Boca Raton: 1994. pp. 2–23. [Google Scholar]
- 34.Minetti G, Low PS. Erythrocyte signal transduction pathways and their possible functions. Curr. Opin. Hematol. 1997;4:116–121. doi: 10.1097/00062752-199704020-00007. [DOI] [PubMed] [Google Scholar]
- 35.Hanson MS, Ellsworth ML, Achilleus D, Stephenson AH, Bowles EA, Sridharan M, Adderley S, Sprague RS. Insulin inhibits low oxygen-induced ATP release from human erythrocytes: implication for vascular control. Microcirculation. 2009;16:424–433. doi: 10.1080/10739680902855218. [DOI] [PMC free article] [PubMed] [Google Scholar]
- 36.Dutta-Roy A, Kahn N, Sinha A. Interaction of receptors for prostaglandin E1/prostacyclin and insulin in human. 1991;49:1129–1139. doi: 10.1016/0024-3205(91)90560-x. [DOI] [PubMed] [Google Scholar]
- 37.Sundquist J, Blas SD, Hogan JE, Davis FB, Davis PJ. The α1-adrenergic receptor in human erythrocyte membranes mediates interaction in vitro of epinephrine and thyroid hormone at the membrane Ca2+-ATPase. Cell. Signalling. 1992;4:795–799. doi: 10.1016/0898-6568(92)90060-l. [DOI] [PubMed] [Google Scholar]
- 38.Baskurt OK, Ulker P, Meiselman HJ. Nitric oxide, erythrocytes and exercise. Clin. Hemorheol. Microcirc. 2011;49:175–181. doi: 10.3233/CH-2011-1467. [DOI] [PubMed] [Google Scholar]
- 39.Vallés J, Santos MT, Aznar J, Martínez M, Moscardó A, Piñón M, Broekman MJ, Marcus AJ. Platelet-erythrocyte interactions enhance αIIbβ3 integrin receptor activation and P-selectin expression during platelet recruitment: down-regulation by aspirin ex vivo. Blood. 2002;99:3978–3984. doi: 10.1182/blood.v99.11.3978. [DOI] [PubMed] [Google Scholar]
- 40.Hinderling PH. Red blood cells: a neglected compartment in pharmacokinetics and pharmacodynamics. Pharmacol. Rev. 1997;49:279–29541. [PubMed] [Google Scholar]
- 41.Mitsuhiro S, Yoshiyuki Y, Nishida M, Kawada J. ADP modifies the function of the glucose transporter: studies with reconstituted liposomes. Biochem. J. 1993;292:877–881. doi: 10.1042/bj2920877. [DOI] [PMC free article] [PubMed] [Google Scholar]
- 42.Snyder LM, Fortier NL, Trainor J, Jacobs J, Leb L, Lubin B, Chiu D, Shohet S, Mohandas N. Effect of hydrogen peroxide exposure on normal human erythrocyte deformability, morphology, surface characteristics, and spectrin-hemoglobin cross-linking. J. Clin. Invest. 1985;76:1971–1977. doi: 10.1172/JCI112196. [DOI] [PMC free article] [PubMed] [Google Scholar]
- 43.Walder JA, Chatterjee R, Steck TL, Low PS, Musso GF, Kaiser ET, Rogers PH, Arnone A. The interaction of hemoglobin with the cytoplasmic domain of band 3 of the human erythrocyte membrane. J. Biol. Chem. 1984;259:10238–10246. [PubMed] [Google Scholar]
- 44.Ferru E, Giger K, Pantaleo A, Campanella E, Grey J, Ritchie K, Vono R, Turrini F, Low PS. Regulation of membrane-cytoskeletal interactions by tyrosine phosphorylation of erythrocyte band 3. Blood. 2011;117:5998–6006. doi: 10.1182/blood-2010-11-317024. [DOI] [PMC free article] [PubMed] [Google Scholar]
- 45.Kodippili GC, Spector J, Hale J, Giger K, Hughes MR, McNagny KM, Birkenmeier C, Peters L, Ritchie K, Low PS. Analysis of the mobilities of band 3 populations associated with the ankyrin and junctional complexes in intact murine erythrocytes. J. Biol. Chem. 2012;286:4129–4138. doi: 10.1074/jbc.M111.294439. [DOI] [PMC free article] [PubMed] [Google Scholar]
- 46.Lew VL, Bookchin RM. Ion transport pathology in the mechanism of sickle cell dehydration. Physiol. Rev. 2005;85:179–200. doi: 10.1152/physrev.00052.2003. [DOI] [PubMed] [Google Scholar]
- 47.Jennings ML, Passow H. Anion transport across the erythrocyte membrane, in situ proteolysis of band 3 protein, and cross-linking of proteolytic fragments by 4,4′-diisothiocyano dihydrostilbene-2,2′-disulfonate. Biochim Biophys Acta. 1979;554:498–519. doi: 10.1016/0005-2736(79)90387-0. [DOI] [PubMed] [Google Scholar]
- 48.Van Dort HM, Moriyama R, Low PS. Effect of band 3 subunit equilibrium on the kinetics and affinity of ankyrin binding to erythrocyte membrane vesicles. J. Biol. Chem. 1998;273:14819–14826. doi: 10.1074/jbc.273.24.14819. [DOI] [PubMed] [Google Scholar]