Abstract
The ADP-responsive P2Y12 receptor is expressed on both platelets and microglia. Clinical data show that ticagrelor, a direct-acting, reversibly binding P2Y12-receptor antagonist, reduces total cardiovascular events, including stroke. In our present study, we investigated the expression of P2Y12 receptors and the effects of ticagrelor on brain injury in Sprague-Dawley rats subjected to a permanent middle cerebral artery occlusion (MCAo). Rats were treated per os with ticagrelor 3 mg/kg or vehicle at 10 minutes, 22, and 36 hours after MCAo and killed after 48 hours. Immunofluorescence analysis showed an ischemia-related modulation of the P2Y12 receptor, which is constitutively expressed in Iba1+ resting microglia. After MCAo, activated microglia was mainly concentrated around the lesion, with fewer cells present inside the ischemic core. Ticagrelor significantly attenuated the evolution of ischemic damage—evaluated by magnetic resonance imaging (MRI) at 2, 24, and 48 hours after MCAo—, the number of infiltrating cells expressing the microglia/monocyte marker ED-1, the cerebral expression of proinflammatory mediators (interleukin 1 (IL-1), monocyte chemoattractant protein 1 (MCP-1), nitric oxide synthase (iNOS)) and the associated neurologic impairment. In transgenic fluorescent reporter CX3CR1-green fluorescent protein (GFP) mice, 72 hours after MCAo, ticagrelor markedly reduced GFP+ microglia and both early and late infiltrating blood-borne cells. Finally, in primary cultured microglia, ticagrelor fully inhibited ADP-induced chemotaxis (P<0.01). Our results show that ticagrelor is protective against ischemia-induced cerebral injury and this effect is mediated, at least partly, by inhibition of P2Y12-mediated microglia activation and chemotaxis.
Keywords: microglia, middle cerebral artery occlusion, P2Y12 receptor, rat, ticagrelor
Introduction
The P2Y12 receptor represents an established target for antithrombotic therapies.1 P2Y12 is mainly expressed on circulating platelets, where its activation by the nucleotide ADP mediates platelet activation and aggregation. Its molecular characterization2 revealed the target of the thienopyridines (ticlopidine and clopidogrel), and opened a new era in the development of antiplatelet agents acting via blockade of P2Y12. Ticagrelor, a new class of oral, direct-acting, reversibly binding P2Y12 antagonist, was developed to overcome the limitations of current oral antiplatelet therapy.3 Ticagrelor has shown improved clinical outcome compared with clopidogrel.4
In addition to platelets, functional P2Y12 receptors are present on microglial cells,5 the brain's immunocytes that have a crucial role in the remodeling and repair of ischemic lesions after stroke.6, 7 These cells are normally dispersed throughout brain's parenchyma under a ‘resting' highly ramified form. After acute trauma, microglia extend processes toward the sites of tissue damage, where high amounts of nucleotides, including ATP, are released.8 In ramified resting microglia, the P2Y12 receptor is predominantly localized to the ramified processes emanating from cell body. Thus, P2Y12 is poised to enable microglia to detect changes in their local environment and within minutes respond to increased nucleotides release with activation and induced chemotaxis. This initial activation phase is followed by shape changes, with resting microglia turning into round ‘amoeboid' microglia in the subsequent hours.8 Importantly, P2Y12 expression is robust in the resting state, but dramatically reduced after microglial activation: loss of P2Y12 expression accompanies microglial transformation from highly ramified to amoeboid state, to the point that expression is barely observable 24 hours after an acute injury.5 It has been shown that mice lacking P2Y12 receptors had significantly diminished microglial branch extension toward sites of brain damage.5 These data suggest that a fine regulation of P2Y12 receptors activity may exert beneficial effects on microglial chemotaxis and subsequent remodeling of local central nervous system injury.
On this basis, the current study was specifically undertaken to: (1) elucidate the expression changes in the P2Y12 receptor in a well-established rodent model of cerebral focal ischemia induced by permanent middle cerebral artery occlusion (MCAo); (2) assess the neuroprotective actions of ticagrelor after MCAo; (3) and determine whether blockade of P2Y12 receptors on microglia might contribute to the benefit/risk profile of ticagrelor. Finally, since, after MCAo, circulating monocytes/leukocytes infiltrate the brain and, together with microglia, contribute to clearing and remodeling the ischemic core and penumbra area, we also took advantage of CX3CR1-green fluorescent protein (GFP) reporter mice9 to dissect the effect of ticagrelor on both residential and blood-derived immune cells and on their behavior after stroke.
Materials and methods
Animals and Experimental Procedures
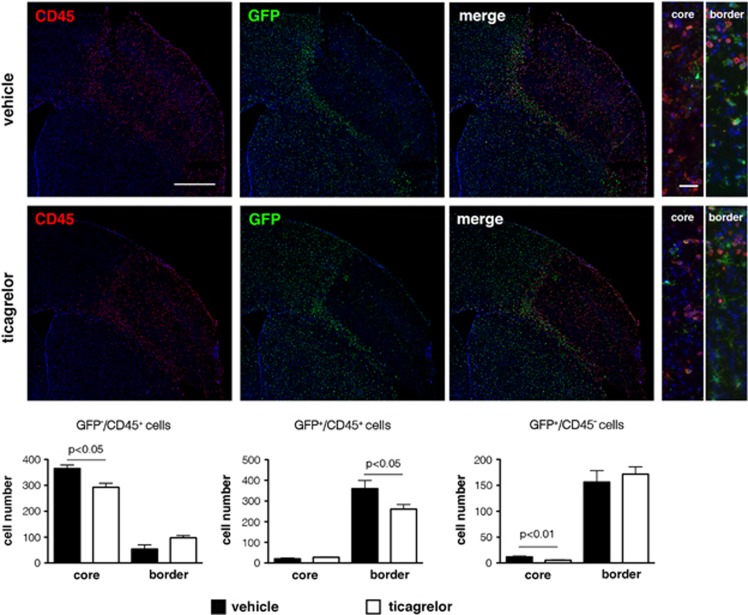
The procedures concerning animal care, surgery, and euthanasia were performed in accordance with national (D.L. n.116, G.U. suppl. 40, 18 February 1992) and International laws and policies (EEC Council Directive 86/609, OJL 358,1; 12 December 1987; NIH Guide for the Care and Use of Laboratory Animals, US National Research Council 1996) and approved and authorized by the National Ministry of Health-University of Milan Committee (Approval number 12/12-30012012). The protocol used and details of this report are also in accordance with ARRIVE guidelines. Male Sprague-Dawley rats (Charles River, Calco, Italy) weighing 200 to 250 g were anesthetized with ketamine (90 mg/kg) and xylazine (10 mg/kg) and underwent permanent MCAo, as previously described.10 Animals were randomly divided into two groups (n=21) and orally treated by gavage with either vehicle (carboxymethylcellulose 1%) or ticagrelor (AstraZeneca R&D Mölndal, Mölndal, Sweden) at a dose of 3 mg/kg. At this dose, no pathologic bleeding was observed during (and post-) surgical procedures. Treatment was administered 10 minutes, and then 22 and 36 hours after MCAo. Animals were anesthetized and killed at 48 hours and brains removed. For rats used for quantitative real-time PCR analysis and neurologic score, see below for detailed treatment protocols. Some MCAo experiments have been also performed in a transgenic mouse line (CX3CR1 mice) where both local microglia and infiltrating cells can be visualized by fluorescence microscopy due to expression of GFP11 under the same treatment protocol (either vehicle or ticagrelor), followed by mice killing at 72 hours. By the use of CD45, a myeloid marker highly expressed in infiltrating cells as compared with microglia (see online Supplementary Material) and due to the appearance, on infiltrating blood-borne cells, of the CX3CR1 receptor at relatively advanced postischemic times (e.g., 72 hours)11 these mice have allowed us to concomitantly monitor the behavior of: (1) local residential GFP-positive microglia; (2) GFP-negative/CD45-positive infiltrating cells (belonging to the classic subset of cells that are more prone to tissutal invasion11), and (3) GFP-positive/CD45-positive blood-borne cells corresponding to the nonclassic patrolling late infiltrating circulating cells.11
Platelet Aggregation
Male Sprague-Dawley rats were administrated orally with ticagrelor with doses of 3 mg/kg or 30 mg/kg. Blood samples for plasma concentration and aggregometry assays were collected at 0.5, 2, and 24 hours after administration of ticagrelor. Blood for plasma exposure was collected from the femoral vein at 0.5 and 2 hours and by heart puncture at 24 hours in Litium Heparin tubes (Microvette 300LH; SARSTEDT, Nümbrecht, Germany). Blood for aggregometry assay was collected into tubes containing H-Phe-Pro-Arg chloromethyl ketone (Calbiochem, Darmstadt, Germany, final concentration 40 μmol/L).
Platelet aggregation in whole blood was measured by impedance aggregometry using a Multiplate device (Dynabyte, München, Germany). ADP to a final concentration of 6.5 μmol/L was added as a platelet activator. The response was measured for 6 minutes and data were expressed as the mean area under the curve of AU (aggregation unit) recorded over time (AU × min) from two separate recordings.
Magnetic Resonance Imaging Analysis
Brain infarct size was visualized by diffusion weight imaging taken 2, 24, and 48 hours after MCAo (Supplementary Methods). Trace of diffusion tensor map computation, Tr(D), ischemic volume determination, and progression of the ischemic damage over time were performed by a blinded investigator, as previously described.9 Brain damage at 7 days was visualized by means of T2-weighted MRI as described in Supplementary Methods. Lesions were identified as areas of high signal intensity.
Neurologic Score
Neurologic deficits were evaluated using the foot-fault, Bederson's, and De Ryck's tests, as previously detailed.12, 13 Tests were repeated 24 and 48 hours and 7 days after MCAo in rats receiving either vehicle (n=6) or the drug (3 mg/kg; n=6) administered 10 minutes after ischemic insult and then every day till killing.
RNA Extraction and Quantitative Real-Time PCR Analysis
In a subset of rats, either vehicle (n=5) or ticagrelor (n=6) was administered 10 minutes and 22 hours after MCAo, and the animals were killed 2 hours later (24 hours after MCAo). A region of brain cortex (∼1 cm containing and around the lesioned area) was then collected from the ipsilateral lesioned side and immediately frozen in dry ice. For each animal, a similar area from the contralateral side was also collected and utilized as a healthy control. Tissues were then homogenized in 1 mL of Trizol (Life Technologies, Grand Island, NY, USA) and RNA was extracted according to the manufacturer's instructions. After treatment with DNase (Promega, Madison, WI, USA), cDNA was synthesized from 1 μg total RNA using the iScript cDNA synthesis Kit (Bio-Rad, Hercules, CA, USA). Quantitative Real Time PCR was performed in CFX Connect Real-Time PCR Detection System (Bio-Rad) with a SYBR-Green based technology, using the following primers: nitric oxide synthase 2 (iNOS2) (Fw: AAACCCCAGGTGCTATTCCC; Rv: GAACATTCTGTGCAGTCCCA), interleukin-1 beta (IL-1β) (Fw: TGGCAACTGTCCCTGAACTC; Rv: GTCGAGATGCTGCTGTGAGA), and monocyte chemoattractant protein 1 (MCP-1) (Fw: ACGCTTCTGGGCCTGTTGTT; Rv: CCTGCTGCTGGTGATTCTCT). GAPDH (Fw: TGTGAACGGATTTGGCCGTA; Rv: ATGAAGGGGTCGTTGATGGC) was used as a housekeeping gene. The analysis was performed with the Bio-Rad CFX Manager 3.0 (Bio-Rad). For the quantification of relative gene expression, CT values of each gene of interest were normalized with the CT of the reference gene (GAPDH), using the ΔΔCT method. Both in control and in treated conditions, expression levels were expressed as a fold increase in ipsilateral compared with the corresponding values of contralateral hemispheres set to 1.
Immunohistochemistry of Brain Tissue
The immunohistochemistry analysis for ED-1 and isolectin-B4 (IB-4) was performed on paraffin-embedded brain sections of six animals per group presenting a comparable ischemic volume, as assessed by magnetic resonance imaging (MRI), at 2 hours after MCAo. ED-1 was used as a marker of phagic microglia/macrophages, whereas IB-4 was used as a marker of total microglia population.
Sections were incubated with mouse anti-ED1 (1:100; Serotec, Oxford, UK) or with peroxidase-labeled IB-4 from Griffonia simplicifolia seeds (1:100; Sigma-Aldrich, Munich, Germany) (Supplementary Methods).
For the colocalization study, animals (rat: n=4 for each group; mice: n=3 for vehicle and n=4 for ticagrelor) were perfused with phosphate-buffered saline and then 4% paraformaldehyde in phosphate-buffered saline. Brains were removed, postfixed overnight in the same solution and cryoprotected in 30% sucrose solution until precipitation at 4°C. Brains were cut at −25°C with a cryostat in 14-μm-thick coronal slices. Rat brain slices were incubated with the following primary antibodies: rabbit anti-P2Y12 receptor polyclonal antiserum (1:1,500; a generous gift by Prof. David Julius, University of California, San Francisco, CA, USA), rabbit anti-Iba1 (1:800; Biocare Medical, Concord, CA, USA), and mouse anti-ED-1 (1:100; Serotec). Mouse brain slices were incubated with the following primary antibodies: rat anti-mouse CD45 antibody (1:800; BD Biosciences Pharmingen, Mississauga, ON, Canada) and chicken anti-GFP antibody (1:700; Aves Labs, Inc., Tigard, OR, USA). For the P2Y12 receptor and CD45, the signal intensity was enhanced using the High Sensitivity Tyramide Signal Amplification kit (Perkin-Elmer, Monza, Italy) and the High Sensitivity Tyramide Signal Amplification Biotin System kit (Perkin-Elmer), respectively, following the manufacturer's instructions. Goat anti-rabbit and goat anti-mouse secondary antibodies conjugated to AlexaFluor555 fluorochrome (1:600; Molecular Probes, Invitrogen, Monza, Italy) were used to detect ED-1- and Iba1-positive cells, and goat anti-chicken secondary antibodies conjugated to AlexaFluor488 fluorochrome (1:1,000; Molecular Probes, Invitrogen) were used to detect GFP.
ED-1+ and IB-4+ Cell Counts
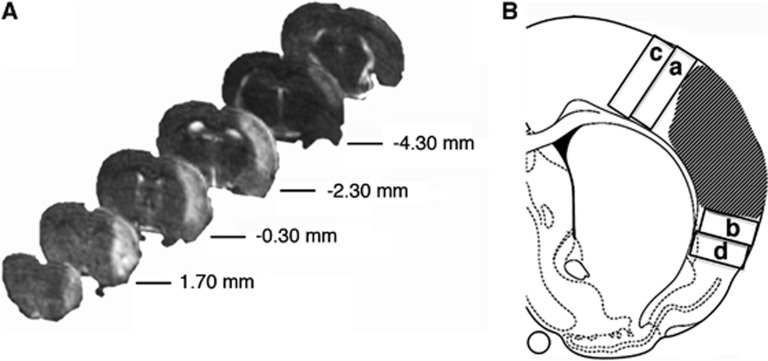
For each rat, the number of ED-1+ and IB-4+ cells was quantified, by a blinded investigator, on three slices taken at level between 1.0 mm and −1.0 mm from the bregma.14 At the border of the ischemic core, ED-1+ and IB-4+ cells were counted in rectangular dorsal (size of 1.5 mm2) and ventral (size of 1.0 mm2) regions (Figure 1). On the basis of their morphology, IB-4+ cells were classified as globose or ramified cells. IB-4+ cells were also counted in dorsal and ventral areas of the same size located 0.7 mm distal from the border of the lesion. Data are expressed as number of positive cells (mean±s.e.m.).
Figure 1.
Rostro-caudal magnetic resonance imaging (MRI) visualization of ischemic rat brain and drawing indicating tissue sampling for macrophages and microglia counts. (A) Representative T2-weighted MRI brain sections obtained 48 hours after middle cerebral artery occlusion (MCAo). The ischemic lesion appears as a hyperintense area. Numbers indicate the distance from bregma. (B) Representative drawing showing the ischemic lesion (dashed area) and the sampled dorsal and ventral fields, adjacent to (a and b) and distal from (c and d) the border of the damage.
For each mouse, the number of CD45+ and GFP+ cells in the ischemic core and border was quantified, by a blinded investigator, on three slices taken at level between 1.3 mm and −0.8 mm from the bregma.15 Similarly to what performed in rats, in mouse slices, at the border of the ischemic core, CD45+ and GFP+ cells were counted in rectangular dorsal (size of 0.9 mm2) and ventral (size of 0.5 mm2) regions.
Chemotaxis Assay
Migration assays were performed as previously described,16, 17, 18 with few modifications, using primary microglial cells isolated from postnatal day 2 Sprague-Dawley rat cortex, in a Boyden Chamber. Briefly, microglial cells were plated in the upper compartment of the transwell (104 cells/well) and serum-starved overnight. On the following day, the bottom compartment was filled with serum-free DMEM alone or in the presence of ADP, with or without cangrelor (1 μmol/L) or ticagrelor (10 μmol/L). After incubating plates for 5 hours at 37 °C, cells migrated to the lower surface of the membrane were stained with Hoechst33258 dye (Life Technologies). Nuclei were counted along the diameter of the filters under a fluorescence microscope (200 M; Zeiss, Italy, × 40 magnification; see Supplementary Methods).
Statistical Analysis
For the MRI study, data on progression of ischemic damage over time were evaluated by analysis of variance for repeated measures. Variations of ischemic volumes over time and between groups were compared. The significance of between-group differences was computed by analysis of variance followed by an appropriate post hoc test. For the chemotaxis assay, the number of migrated cells was standardized with respect to control conditions. Nonparametric Mann–Whitney test was used to discriminate in vitro differences in cell migration, to compare the neurologic score and to analyze the results of quantitative real-time PCR. Data are expressed as mean values±s.e.m.; P<0.05 was considered as statistically significant.
Results
Effect of Ticagrelor on Ischemic Brain Damage
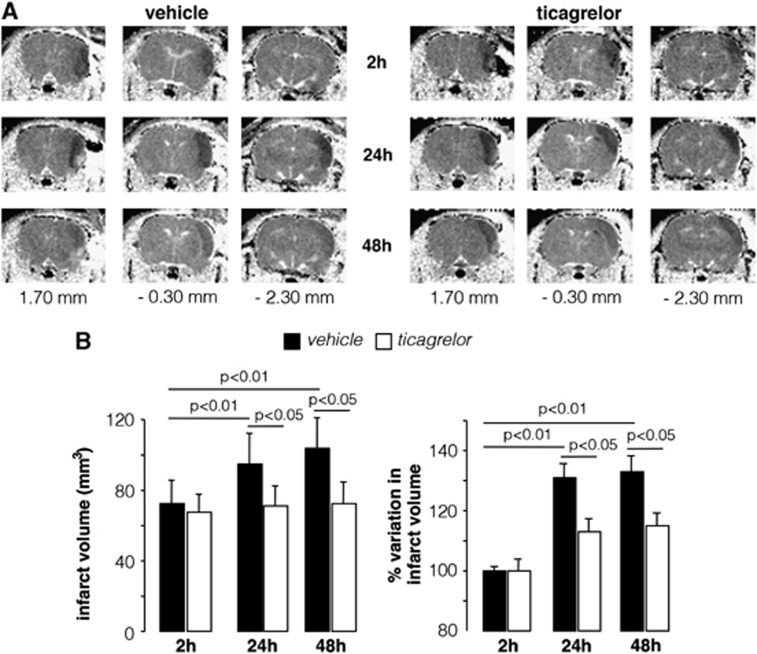
Representative examples of MRI visualizations reporting the longitudinal evolution of brain damage 2, 24, and 48 hours after MCAo, at three comparable rostro-caudal levels, from vehicle- and ticagrelor-treated animals are shown in Figure 2A. Quantitative evaluation of data shows that, 2 hours after MCAo, the Tr(D)-derived average volume of ischemic lesions, detectable as hypointense areas, was 72.0±13 mm3 (n=21) and 68.0±11 mm3 (n=21) in vehicle- and ticagrelor-treated rats, respectively, and was not statistically different. After 24 and 48 hours, the size of the volumes in vehicle-treated rats increased to 98.0±13 mm3 (P<0.05) and to 105.0±13 mm3 (P<0.05) compared with 2 hours. In contrast, ticagrelor-treated rats did not show any significant infarct size evolution at 24 (71.0±13 mm3) and 48 hours (73.0±13 mm3) after MCAo (Figure 2B, left).
Figure 2.
Time-dependent evolution of infarct volume in middle cerebral artery occlusion (MCAo) rats. (A) Diffusion weight imaging (DWI) representative of rats treated with vehicle or ticagrelor taken at three different anatomic levels (1.70, −0.30, and −2.30 mm from bregma) and at 2, 24, and 48 hours after MCAo. The ischemic lesion is detectable as a hypointese area in the right cerebral hemisphere. (B) Histograms showing the quantitative analysis of the brain damage volume determined by DWI measurements and expressed as absolute value and as percent change relative the initial 2 hours value set to 100%. Data are expressed as mean±s.e.m. for vehicle (n=21) and ticagrelor-treated rats (n=21).
The development of injury at 24 and 48 hours was also evaluated as % variation in infarct volume with respect to the initial 2 hours value set to 100% for each individual animal (Figure 2B, right). In vehicle-treated rats, an increase in the volume of brain injury of 32% (P<0.01) and 35% (P<0.01) was observed at 24 and 48 hours, respectively, whereas animals receiving ticagrelor showed a moderate and nonstatistically significant increase in brain damage of only 13% and 15% at the same times of MRI observation. These data suggest that ticagrelor treatment exerts a protective effect on the evolution of ischemic brain damage.
In a small group of rats (n=5/group), we performed a T2-weigthed MRI analysis at a later time point after MCAo (7 days). At this late time point, diffusion weight imaging could not be used to analyze the infarct area since, after such a long time after MCAo, this analysis is no longer able to accurately predict the size of the lesion.19 Conversely, T2W showed a significant correlation for the volumes of damage compared with histology. The T2W-derived injury size was reduced by 20.2% (P=0.06) in the animals treated with ticagrelor compared with vehicle-treated animals (data not shown) although, due to the limited number of animals, this result did not reach statistical significance.
Effect of Ticagrelor on Platelet Aggregation
The plasma concentrations of ticagrelor administered at the dose of 3 mg/kg (n=3) were of 46±12, 57±11, 10± 0 nmol/L after 0.5, 2, and 24 hours after drug administration, respectively. After 0.5 and 2 hours, inhibition of platelet aggregation was barely detectable (6.3±6% and 3.3±3%, respectively), whereas after 24 hours, the percentage of inhibition was negligible (0.2±0.1%).
As a positive control, some rats were treated with the higher dose of 30 mg/kg. In these rats (n=5), drug plasma concentrations, evaluated at 0.5, 2, and 24 hours after drug administration, were of 1.2±0.1, 2.7±0.13, and 0.63±0.05 μM; at the same time points, % inhibition of platelet aggregation was of 81.0±2.3, 95.0±1.0, and 11.0 ±5.0, respectively.
Effect of Ticagrelor on Neurologic Score
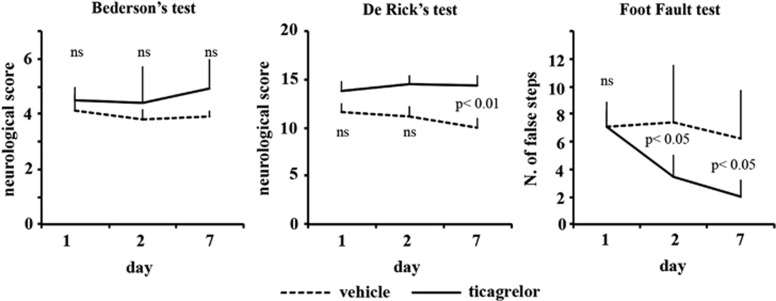
A shown in Figure 3, ticagrelor treatment significantly improved sensorimotor recovery (De Rick's test) and also the ability of the animals to integrate motor response (foot-fault test). A positive amelioration pattern was observed also in the postural reflex test of Bederson, although, for this text, differences between control and treated rats did not reach statistical significance.
Figure 3.
Effect of ticagrelor treatment on neurologic deficits after permanent middle cerebral artery occlusion (MCAo). Neurologic deficits were evaluated by Bederson's (left panel), De Ryck's (middle panel), and foot-fault tests (right panel) starting from 24 hours and repeated 48 hours and 7 days after MCAo.
Expression of P2Y12 Receptors after Stroke
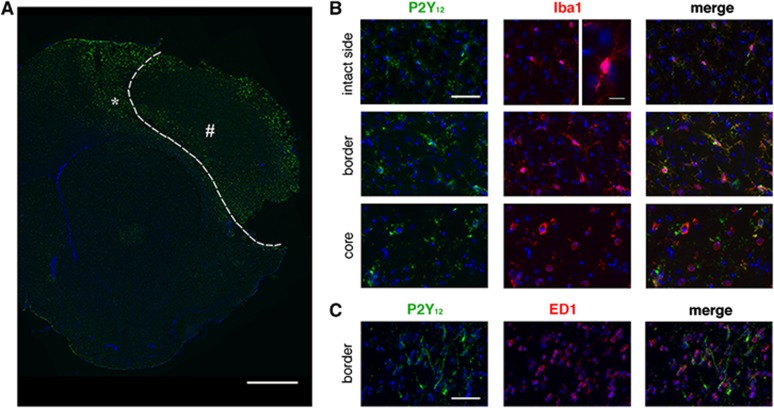
To acquire information on the involvement of microglia and P2Y12 in ischemic injury, we investigated the expression and the degree of cellular colocalization of P2Y12 receptor with the typical microglia marker Iba1. P2Y12 is constitutively expressed in Iba1+ resting microglia in the contralateral hemisphere (Figure 4). Forty-eight hours after MCAo, in the ipsilateral side, we observed a spatial gradient in P2Y12 receptor expression. In particular, at the border of the damaged area, activated microglia were characterized by thick ramifications expressing high levels of P2Y12 all of which colocalized with Iba1 (Figure 4B). However, we observed also few cells expressing Iba1 which were not stained by P2Y12. These cells may represent a transition state from ramified to amoeboid shape since by moving toward the ischemic core, Iba1+ microglia displayed an amoeboid round shape with reduced or absent P2Y12 expression (Figure 4B). At the border of the ischemic lesion, several activated microglia and blood-derived cells expressing the typical phagic marker ED-1+ were present, but few of these cells also expressed P2Y12; in the core, no ED-1+ cells were stained for P2Y12 (Figure 4C).
Figure 4.
Colocalization pattern of P2Y12 (in green) with Iba1 and ED-1 (in red). (A) Upregulation of P2Y12 expression in ipsilateral brain section surrounding the ischemic core (dotted line). Scale bar=1 mm. (B) P2Y12 is constitutively coexpressed on Iba1+ glial cells in intact side (see high magnification for ramified microglia; scale bar=10 μm). P2Y12 expression is increased in the ramified activated microglia at the outer border of the ischemic lesion (asterisk in A). In contrast, P2Y12 is downregulated in amoeboid microglia present in the core of the ischemic lesion (pound sign in A). Scale bar=50 μm. (C) P2Y12 receptor expression was observed only on few ED-1+ cells. Scale bar=50 μm.
Actions of Ticagrelor on Microglia Activation in Middle Cerebral Artery Occlusion Rats
We attempted to identify a putative mechanism of action for the protective effect of ticagrelor in ischemic damage. Due to the cellular localization of P2Y12 and its reported role in microglial activation and migration,5 48 hours after ischemia, we evaluated ticagrelor-induced effects on the number of ED-1 and IB-4-positive cells, that are known to be increased in ischemic brain injury.
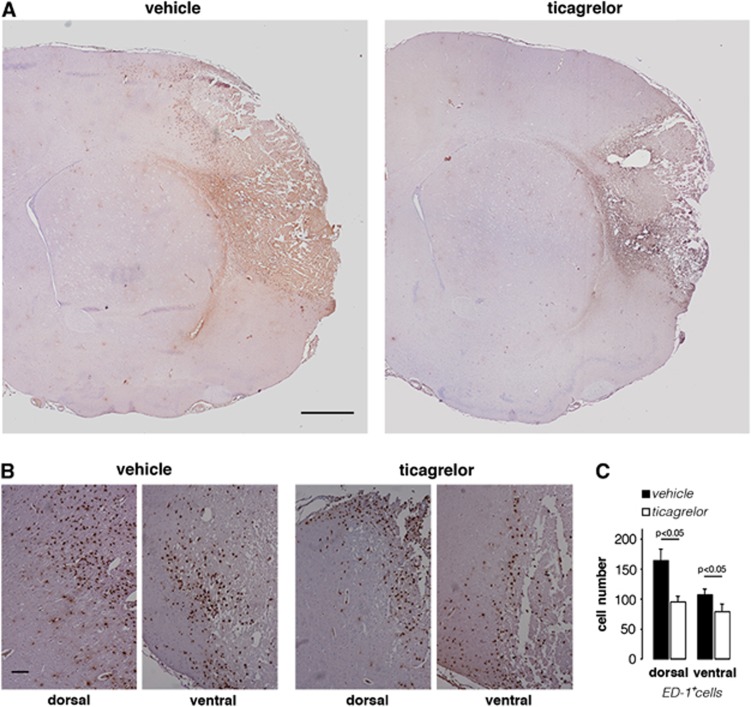
As mentioned above, in ischemic brains, ED-1+ cells were found mainly at the border of the infarcted area. A quantification analysis with ED-1 antibody was performed in two regions (dorsal and ventral) adjacent to the ischemic area, as outlined in the drawing of Figure 1B. Figure 5A shows representative brain sections, ipsilateral to MCAo, of vehicle- and drug-treated animals. Higher magnification images of dorsal and ventral regions in vehicle- and ticagrelor-treated animals (Figure 5B) clearly showed that drug treatment reduces the number of ED-1+ cells. Quantitative analysis showed that, compared with vehicle-treated rats, ticagrelor significantly reduced the number of ED-1+ cells by 42.1±14.0% (P<0.05) and 26.2±10.3% (P<0.05), in the dorsal and ventral regions, respectively (Figure 5C).
Figure 5.
Effect of ticagrelor on ED-1+ cells infiltration in middle cerebral artery occlusion (MCAo) rats. (A) Representative images of ED-1 immunohistochemistry in ischemic brain slices from vehicle- and ticagrelor-treated MCAo rats. Scale bar=1 mm. (B) High magnification of dorsal and ventral fields of vehicle- and drug-treated ischemic animals. Scale bar=300 μm. (C) Histogram shows the quantitative analysis of the number of ED-1+ cells in dorsal and ventral regions of vehicle- (n=6) and ticagrelor- (n=6) treated rats.
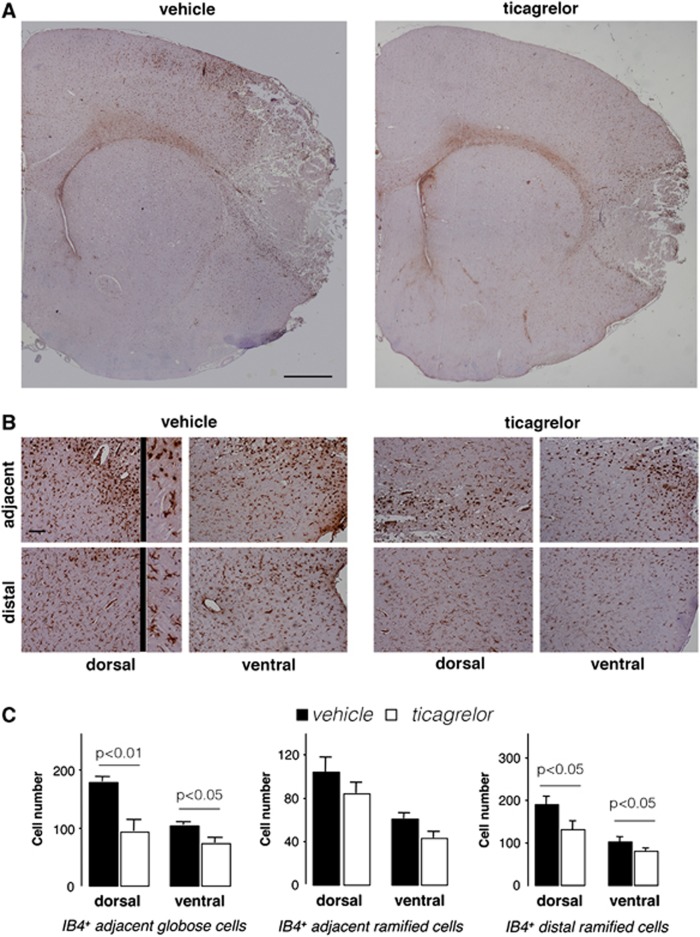
To understand how, after MCAo, ticagrelor affects the behavior of microglia, the expression of IB-4+ cells in ischemic brains was analyzed in more detail (Figure 6). In the ipsilateral hemisphere, the presence of two populations of IB-4+ cells was observed. Cells from the first population were round and amoeboid in shape (globose microglia) and were localized at the border of and inside the ischemic core. The second cell population had a ramified shape, and, compared with globose cells, showed a broader distribution extending from the border of the lesion to the dorsal and ventral cortex distal from the ischemic core. Higher magnification panels show IB-4+ globose and ramified cells in dorsal and ventral adjacent regions and only ramified cells in dorsal and ventral distal regions in vehicle- and ticagrelor-treated animals (Figure 6B). Quantitative evaluation showed that ticagrelor significantly reduced the number of IB-4+ globose cells by 47.8±11.2% (P<0.01) and 29.8±8.7% (P<0.05) in the dorsal and ventral regions, respectively, compared with vehicle-treated animals (Figure 6C). A trend toward a reduction in the number of adjacent ramified IB-4+ cells by 19.2±9.6% and 29.5±9.8% in the dorsal and ventral regions, respectively, was also observed in drug-treated rats, although these differences did not reach statistical significance (Figure 6C).
Figure 6.
Effect of ticagrelor on IB-4+ cells in middle cerebral artery occlusion (MCAo) rats. (A) Representative images of IB-4 immunohistochemistry in ischemic brain slices from vehicle- and ticagrelor-treated MCAo rats. Scale bar=1 mm. (B) High magnification of adjacent and distal fields of vehicle and drug-treated ischemic animals. Adjacent fields display both globose and ramified IB-4+ cells (see inset at × 4 magnification), whereas distal fields display only ramified cells (see inset at × 4 magnification). Scale bar=300 μm. (C) Histograms showing the quantitative analysis of the number of IB-4+ globose and ramified cells in adjacent regions and of the number of IB-4+ ramified cells in distal regions in vehicle- and ticagrelor-treated animals. The data represent the mean±s.e.m. of six different rats/group.
Figure 6C shows that ticagrelor treatment exerts its positive effect also on microglia distal from ischemic injury, since it reduced the number of ramified IB-4+ cells by 33.0±8.8% (P<0.05) and 21.1±6.3% (P<0.05) in dorsal and ventral areas, respectively. These data suggest that the activity of ticagrelor is not limited to cells surrounding the ischemic tissue, but also affects cells migrating toward the brain damage.
Effects of Ticagrelor on Inflammatory Mediators Expression
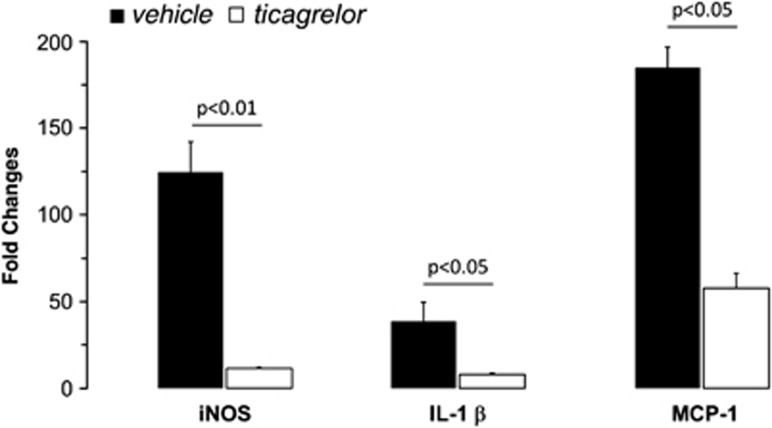
To evaluate the antiinflammatory effect of ticagrelor in ischemic brain, we performed a quantitative analysis of well-known proinflammatory markers, such as iNOS, IL-1β and MCP-1 in rat ischemic cortex removed 24 hours after MCAo. A strong induction of all tested markers was observed in the ipsilateral hemisphere (with fold increases of 124.73±17.53 for iNOS, 38.73±10.73 for IL-1β, and 184.84±11.88 for MCP-1), with respect to the contralateral, healthy brain. As shown in Figure 7, administration of ticagrelor led to a marked and statistically significant reduction in expression of iNOS, IL-1β, and MCP-1 (which was inhibited by 90%, 79%, and 69%, respectively) showing a clear antiinflammatory action of the drug.
Figure 7.
Relative changes (quantitative real-time PCR (qRT-PCR) analysis) of selected proinflammatory markers in the ipsilateral cerebral cortex of vehicle (n=6) or ticagrelor (n=5) middle cerebral artery occlusion (MCAo) rats compared with contralateral healthy cortex. Data are expressed as fold increase±s.e.m. of ipsilateral (ischemic) values compared with the corresponding (healthy) contralateral values set to 1. Nitric oxide synthase (iNOS) expression: 124.73±17.53 (vehicle); 11.33±0.61 (ticagrelor); interleukin 1beta (IL-1β) expression: 38.73±10.73 (vehicle); 7.95±0.87 (ticagrelor); monocyte chemoattractant protein 1 (MCP-1) expression: 184.84±11.88 (vehicle); 57.69±8.6 (ticagrelor).
Ticagrelor Inhibits ADP-Induced Microglial Migration
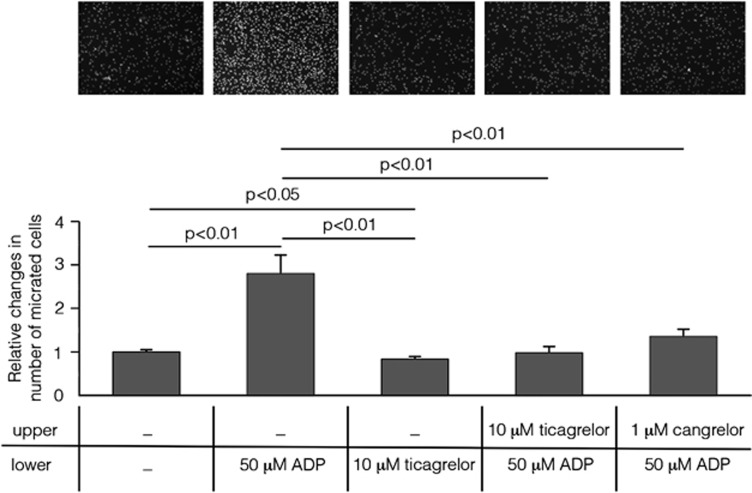
To get insights into the mechanisms responsible for ticagrelor-induced reduction of microglial cells in infarcted areas, and to test whether this effect is due to interference with microglial cells' migration properties, an in vitro chemotaxis assay was performed. Results showed that, in a Boyden chamber, microglial cells migrated toward the lower compartment containing 50 μM ADP (Figure 8). To show that the ADP-induced migration effect was mediated by P2Y12 receptors, cells were incubated with ticagrelor (10 μM) which produced a complete inhibition of ADP-induced chemotaxis (100.00±9.45% P<0.01). The observation that cangrelor (1 μM), another well-known antagonist of this receptor,20 also inhibited the ADP-induced migration of microglial cells (79.52±9.89% P<0.01), confirmed that this effect is P2Y12 mediated. No statistically significant difference between ticagrelor and cangrelor was observed. Of note, incubation of cells with ticagrelor alone slightly but significantly inhibited ‘per se' the ability of cells to migrate, suggesting an autocrine regulation of cell migration by endogenously released ADP.
Figure 8.
Ticagrelor abolishes ADP-induced microglial cells migration. Nuclei of cells migrated to the bottom of a polycarbonate membrane stained with Hoechst (top panel). Absolute cell numbers for the typical experiment shown in the picture are as follows (mean of three counted fields in three different wells): Control, unstimulated cells: 234±1; cells stimulated with 50 μmol/L ADP: 860±151; unstimulated cells treated with 10 μmol/L ticagrelor: 191±14; cells stimulated with 50 μmol/L ADP pretreated with 10 μmol/L ticagrelor: 257±136, and cells stimulated with 50 μmol/L ADP pretreated with 1 μmol/L cangrelor: 382±20. Histograms show the results of the quantitative analysis performed in three independent experiments. Data are expressed as mean±s.e.m. and quantification is shown in the histogram. Changes in number of migrated cells were related to control condition set to 1: 1.00±0.04 in control; 2.77±0.44 in cells stimulated with 50 μmol/L ADP; 0.84±0.05 in cells incubated with 10 μmol/L ticagrelor; 0.99±0.12 in cells pretreated with 10 μmol/L ticagrelor and stimulated with 50 μmol/L ADP (statistically not different from control) and 1.36±0.15 in cells pretreated with 1 μmol/L cangrelor and stimulated with 50 μmol/L ADP (statistically not different from control and from ticagrelor pretreatment).
Actions of Ticagrelor on Microglia and Blood-Borne Infiltrating Cells in Middle Cerebral Artery Occlusion CX3CR1-Green Fluorescent Protein reporter mice
After stroke, infiltrating blood-borne cells also contribute, together with microglia, to the remodeling of the ischemic area. However, these two types of cells cannot be distinguished by ED-1 staining. To determine the effect of ticagrelor on these two distinct cell populations, we took advantage of an in-house available transgenic mouse line where both brain's residential microglia and infiltrating circulating cells can be traced by fluorescence due to expression of GFP.9, 11 Thus, MCAo was induced in three vehicle and four ticagrelor-treated mice and immunofluorescence analysis performed 72 hours later.
The high expression of the myeloid marker CD45 in blood-derived macrophages allowed us to concomitantly monitor the behavior of: (1) local residential GFP+ microglia; (2) GFP−/CD45+ infiltrating cells belonging to the classic subset of cells that are more prone to tissutal invasion, and (3) GFP+/CD45+ blood-borne cells corresponding to the nonclassic late infiltrating circulating cells (more details in Materials and methods and Supplementary Materials). In vehicle-treated mice, inside the ischemic core, the number of classic early infiltrating blood-borne cells greatly exceeded the number of nonclassic late infiltrating cells. Few GFP+ microglia were also found in the ischemic core. Conversely, at this time point after ischemia, consistent with the timing of cell infiltration, both microglia and late infiltrating cells were detected at the ischemic border (Figure 9).
Figure 9.
Effect of ticagrelor on infiltrating residential microglia and blood-derived cells in CX3CR1-GFP reporter mice 72 hours after middle cerebral artery occlusion (MCAo). Scale bar=500 μm. In vehicle-treated mice (upper panels), early infiltrating GFP−/CD45+ cells inside the ischemic core (red fluorescence in the far left panel) greatly exceeded the number of late infiltrating GFP+/CD45+ cells (yellow cells in the merge panel). Conversely, at the ischemic border, the number of GFP+/CD45+ cells was higher compared with GFP−/CD45+ cells (ibidem). Few GFP+/CD45− cells (microglia, upper medium panel) were found inside the ischemic core; in contrast, most of these cells were detected at the ischemic border (ibidem). High magnification images of the merge panels are reported to the right side of the figure and are related to core and border of ischemic area (scale bar=50 μm). Ticagrelor markedly and significantly reduced the number of all these three immune cells populations (lower panels). The quantitative analysis of these data is reported in black (vehicle) and white (ticagrelor) histograms.
Inside the ischemic core, ticagrelor treatment markedly reduced the number of microglia by 55.09+7.65% (P<0.01) and of early infiltrating cells by 19.75+4.19% (P<0.05); also the number of late infiltrating cells at the ischemic border was reduced by 27.64+6.09% (P<0.05) (Figure 9 and thecorresponding histograms).
Discussion
In this study, we show that the oral administration of ticagrelor, a directly acting reversibly binding P2Y12 antagonist, protects animals from the evolution of ischemic lesions and the neurologic impairment consequent to MCAo by modulating microglia activity, infiltration of blood-derived cells and expression of inflammatory mediators. Of note, this is observed at a dose of drug not inducing bleeding during the experimental procedures and giving negligible platelet inhibition in rat whole blood. These data are in line with the previous literature data showing protection against brain ischemia in P2Y12 receptor knockout animals.21
Prompted by ticagrelor-induced beneficial effects on ischemia evolution,22 based on the role of microglia in brain ischemia development7, 21 and on the fact that these cells also express the P2Y12 receptor,5 we analyzed drug-induced changes in microglial activation 48 hours after ischemia induction. Since, besides microglia, infiltrating blood-borne cells also contribute to lesion remodeling after ischemia,8 we extended our analysis to these cells as well, by assessing in parallel staining for IB-4 (a marker of total glial cell population and blood-derived immune cells) and for ED-1 (a marker for all activated phagic cells).
As expected, in control rat brains, microglia were found to be normally dispersed throughout brain's parenchyma under a ‘resting' highly ramified form (Iba1+ cells, see Figure 4). In the ipsilateral cortex of MCAo animals, microglia were initially activated by the insult, as shown by thick ramified IB-4+ cells at the border of the ischemic lesion; these cells also intensively stained for the P2Y12 receptor (regarding P2Y12 upregulation, see also below). Conversely, in line with the previous literature data showing that P2Y12 expression is markedly downregulated as a function of time after the insult,2, 8 when activated ramified microglia turn into round ‘amoeboid' globose cells, such as those found inside the ischemic core or in areas distal from the insult (Figure 4), P2Y12 expression was dramatically reduced according to a strict spatial gradient.
Quantification of IB-4+ and ED-1+ cells in the ipsilateral hemisphere showed that ticagrelor reduced the number of these cells in both the dorsal and ventral regions adjacent to the infarcted area. In the case of activated microglia, both globose amoeboid and ramified cells were reduced.
As suggested by our results with the in vitro migration assay, these effects may be due, at least in part, to the ability of ticagrelor to counteract ADP-induced microglia chemotaxis, a P2Y12-dependent effect. However, since P2Y12 is expressed on resting ramified, but not on activated globose, cells (see above), the in vivo effects induced by ticagrelor in the MCAo model likely reflect an overall reduction in microglia reactivity due to (or leading to) neuroprotection.
Our data reporting upregulated P2Y12 at the border of injury 48 hours after MCAo are only apparently in contrast with the evidence that P2Y12 expression is rapidly downregulated during microglia activation.5 We believe that the ramified cells still expressing high P2Y12 levels at the ischemic border represent migrating microglia that are still attempting to reach the ischemic core, as a result of activation by inflammatory factors that increase both P2Y12 and microglia motility,23, 24 and are released for long times at the site of injury. Conversely, microglial migratory response is reversed when microglia assume a characteristic amoeboid morphology and lose P2Y12,25 as is the case of the P2Y12-negative amoeboid microglia inside the ischemic core (Figure 4), where a shift from migrating to phagic phenotype has already occurred. Thus, the lesion border can be considered as a ‘transition territory' where both ramified P2Y12 highly expressing cells and amoeboid microglia that no longer express P2Y12 are present.
In the case of ED-1-positive cells, the detected effect may also reflect a reduction in the recruitment of immune cells from the blood, as a consequence of reduced ischemic damage. This hypothesis is indeed confirmed by the data obtained on fluorescent reporter CX3CR1-GFP mice. After MCAo, in ticagrelor-treated mice, the number of microglia and of both early and late infiltrating blood-borne cells was found to be significantly reduced inside the ischemic core and at the border of the ischemic lesion. Ticagrelor also markedly abolished the ischemia-associated increase in the cerebral levels of proinflammatory mediators like iNOS, IL-1β, and MCP-1, a major ligand for attracting the early classic pool of blood infiltrating cells.26 This would also explain why, in ticagrelor-treated CX3CR1 mice, the number of early infiltrating cells is markedly reduced inside the ischemic core.
Globally, these data indicate that ticagrelor protects the brain against ischemia-associated immune cell activation in the MCAo rodent model. It is important to note that these data do not rule out the possibility of additional pleiotropic mechanisms (beyond P2Y12 inhibition) contributing to ticagrelor neuroprotective effects. For example, we have shown previously that both cangrelor6 and ticagrelor27 bind GPR17, a P2Y-like receptor that is structurally and phylogenetically related to P2Y12 and shown to be involved in evolution of brain damage.6, 28 Interestingly, and in comparison with P2Y12, GPR17 is normally absent on microglia, but is markedly induced on these cells within 3 to 7 days after MCAo or spinal cord injury,20 suggesting that this receptor may come into play when P2Y12 undergoes downregulation. Protective effects may also be due to ticagrelor-mediated inhibition of adenosine cellular reuptake resulting in neuroprotection via augmentation of endogenous adenosine-mediated vasodilatation and via an antiinflammatory effect.29
In conclusion, our data show a potent protective effect of ticagrelor at both early and late stages of ischemic injury in the rodent MCAo model. These data support the concept that the beneficial effects of ticagrelor go beyond inhibition of platelet aggregation. Our data also suggest that the block of P2Y12-mediated microglial behavior after stroke results in protective effects.
Acknowledgments
Authors are grateful to Astra Zeneca, Sweden, for kindly providing ticagrelor. Rabbit anti-P2Y12 receptor polyclonal antiserum was a generous gift by Prof. David Julius, University of California San Francisco, CA, USA.
Malin Enerbäck and Elham Nikookhesal are employees of AstraZeneca. MPA has been recipient of a research grant from Astra Zeneca.
Footnotes
Supplementary Information accompanies the paper on the Journal of Cerebral Blood Flow & Metabolism website (http://www.nature.com/jcbfm)
This study was partially funded by the Italian Ministry of Health, Bando Cellule Staminali 2009 “Implementing brain repair in stroke via the exploitment of adult neurogenesis and gliogenesis: focus on the cross-talk between microglial and endogenous neural precursor cells” to MPA and ET, and by Astra Zeneca, Sweden. DW is supported by a post doc fellowship "Mobility Plus" from the Polish Ministry of Science and Higher Education. DL was supported by a post doc fellowship by NEPENTE, Regione Lombardia, Italy—NEtwork lombardo di eccellenza PEr lo sviluppo di farmaci di origine Naturale diretti alla modulazione del microambiente tissutale per la prevenzione e TErapia dei tumori e delle malattie neurodegenerative.
Supplementary Material
References
- Abbracchio MP, Burnstock G, Boeynaems JM, Barnard EA, Boyer JL, Kennedy C, et al. International union of pharmacology LVIII: update on the P2Y G protein-coupled nucleotide receptors: from molecular mechanisms and pathophysiology to therapy. Pharmacol Rev. 2006;58:281–341. doi: 10.1124/pr.58.3.3. [DOI] [PMC free article] [PubMed] [Google Scholar]
- Hollopeter G, Jantzen HM, Vincent D, Li G, England L, Ramakrishnan V, et al. Identification of the platelet ADP receptor targeted by antithrombotic drugs. Nature. 2001;409:202–207. doi: 10.1038/35051599. [DOI] [PubMed] [Google Scholar]
- Nawarskas JJ, Clark SM. Ticagrelor: A novel reversible oral antiplatelet agent. Cardiol Rev. 2011;19:95–100. doi: 10.1097/CRD.0b013e3182099d86. [DOI] [PubMed] [Google Scholar]
- Wallentin L, Becker RC, Budaj A, Cannon CP, Emanuelsson H, Held C, et al. Ticagrelor versus clopidogrel in patients with acute coronary syndromes. N Engl J Med. 2009;361:1045–1057. doi: 10.1056/NEJMoa0904327. [DOI] [PubMed] [Google Scholar]
- Haynes SE, Hollopeter G, Yang G, Kurpius D, Dailey ME, Gan WB, et al. The p2y12 receptor regulates microglial activation by extracellular nucleotides. Nat Neurosci. 2006;9:1512–1519. doi: 10.1038/nn1805. [DOI] [PubMed] [Google Scholar]
- Ciana P, Fumagalli M, Trincavelli ML, Verderio C, Rosa P, Lecca D, et al. The orphan receptor GPR17 identified as a new dual uracil nucleotides/cysteinyl-leukotrienes receptor. EMBO J. 2006;25:4615–4627. doi: 10.1038/sj.emboj.7601341. [DOI] [PMC free article] [PubMed] [Google Scholar]
- Zhao B, Zhao CZ, Zhang XY, Huang XQ, Shi WZ, Fang SH, et al. The new P2Y-like receptor g protein-coupled receptor 17 mediates acute neuronal injury and late microgliosis after focal cerebral ischemia in rats. Neuroscience. 2012;202:42–57. doi: 10.1016/j.neuroscience.2011.11.066. [DOI] [PubMed] [Google Scholar]
- Fumagalli M, Lecca D, Abbracchio MP. Role of purinergic signalling in neuro-immune cells and adult neural progenitors. Front Biosci. 2011;16:2326–2341. doi: 10.2741/3856. [DOI] [PubMed] [Google Scholar]
- Jung S, Aliberti J, Graemmel P, Sunshine MJ, Kreutzberg GW, Sher A, et al. Analysis of fractalkine receptor CX(3)CR1 function by targeted deletion and green fluorescent protein reporter gene insertion. Mol Cell Biol. 2000;20:4106–4114. doi: 10.1128/mcb.20.11.4106-4114.2000. [DOI] [PMC free article] [PubMed] [Google Scholar]
- Sironi L, Cimino M, Guerrini U, Calvio AM, Lodetti B, Asdente M, et al. Treatment with statins after induction of focal ischemia in rats reduces the extent of brain damage. Arterioscler Thromb Vasc Biol. 2003;23:322–327. doi: 10.1161/01.atv.0000044458.23905.3b. [DOI] [PubMed] [Google Scholar]
- Fumagalli S, Perego C, Ortolano F, De Simoni MG. CX3CR1 deficiency induces an early protective inflammatory environment in ischemic mice. Glia. 2013;61:827–842. doi: 10.1002/glia.22474. [DOI] [PubMed] [Google Scholar]
- Villa P, Triulzi S, Cavalieri B, Di Bitondo R, Bertini R, Barbera S, et al. The interleukin-8 (IL-8/CXCL8) receptor inhibitor reparixin improves neurological deficits and reduces long-term inflammation in permanent and transient cerebral ischemia in rats. Mol Med. 2007;13:125–133. doi: 10.2119/2007-00008.Villa. [DOI] [PMC free article] [PubMed] [Google Scholar]
- Sironi L, Mitro N, Cimino M, Gelosa P, Guerrini U, Tremoli E, et al. Treatment with LXR agonists after focal cerebral ischemia prevents brain damage. FEBS Lett. 2000;582:3396–3400. doi: 10.1016/j.febslet.2008.08.035. [DOI] [PMC free article] [PubMed] [Google Scholar]
- Paxinos G, Watson C. The rat brain in stereotaxic coordinates. Academic Press: San Diego, CA; 2007. [Google Scholar]
- Paxinos G, Franklin KBJ. Mouse brain in stereotaxic coordinates. Academic Press: San Diego, CA; 2001. [Google Scholar]
- Honda S, Sasaki Y, Ohsawa K, Imai Y, Nakamura Y, Inoue K, et al. Extracellular ATP or ADP induce chemotaxis of cultured microglia through Gi/o-coupled P2Y receptors. J Neurosci. 2001;21:1975–1982. doi: 10.1523/JNEUROSCI.21-06-01975.2001. [DOI] [PMC free article] [PubMed] [Google Scholar]
- Lee S, Chung CY. Role of VASP phosphorylation for the regulation of microglia chemotaxis via the regulation of focal adhesion formation/maturation. Mol Cell Neurosci. 2009;42:382–390. doi: 10.1016/j.mcn.2009.08.010. [DOI] [PMC free article] [PubMed] [Google Scholar]
- Lee SH, Hollingsworth R, Kwon HY, Lee N, Chung CY. β-Arrestin 2-dependent activation of ERK1/2 is required for ADP-induced paxillin phosphorylation at Ser(83) and microglia chemotaxis. Glia. 2012;60:1366–1377. doi: 10.1002/glia.22355. [DOI] [PMC free article] [PubMed] [Google Scholar]
- Gill R, Sibson NR, Hatfield RH, Burdett NG, Carpenter TA, Hall LD, et al. A comparison of the early development of ischaemic damage following permanent middle cerebral artery occlusion in rats as assessed using magnetic resonance imaging and histology. J Cereb Blood Flow Metab. 1995;15:1–11. doi: 10.1038/jcbfm.1995.1. [DOI] [PubMed] [Google Scholar]
- Ceruti S, Villa G, Genovese T, Mazzon E, Longhi R, Rosa P, et al. The P2Y-like receptor GPR17 as a sensor of damage and a new potential target in spinal cord injury. Brain. 2009;132:2206–2218. doi: 10.1093/brain/awp147. [DOI] [PubMed] [Google Scholar]
- Webster CM, Hokari M, McManus A, Tang XN, Ma H, Kacimi R, et al. Microglial P2Y12 deficiency/inhibition protects against brain ischemia. PLoS ONE. 2013;8:e70927. doi: 10.1371/journal.pone.0070927. [DOI] [PMC free article] [PubMed] [Google Scholar]
- Wang K, Zhou X, Huang Y, Khalil M, Wiktor D, van Giezen JJ, et al. Adjunctive treatment with ticagrelor, but not clopidogrel, added to tPA enables sustained coronary artery recanalisation with recovery of myocardium perfusion in a canine coronary thrombosis model. Thromb Haemost. 2010;104:609–617. doi: 10.1160/TH09-12-0823. [DOI] [PubMed] [Google Scholar]
- Pál G, Vincze C, Renner É, Wappler EA, Nagy Z, Lovas G, et al. Time course, distribution and cell types of induction of transforming growth factor betas following middle cerebral artery occlusion in the rat brain. PLoS ONE. 2012;7:e46731. doi: 10.1371/journal.pone.0046731. [DOI] [PMC free article] [PubMed] [Google Scholar]
- De Simone R, Niturad CE, De Nuccio C, Ajmone-Cat MA, Visentin S, Minghetti L. TGF-β and LPS modulate ADP-induced migration of microglial cells through P2Y1 and P2Y12 receptor expression. J Neurochem. 2010;115:450–459. doi: 10.1111/j.1471-4159.2010.06937.x. [DOI] [PubMed] [Google Scholar]
- Orr AG, Orr AL, Li XJ, Gross RE, Traynelis SF. Adenosine A(2A) receptor mediates microglial process retraction. Nat Neurosci. 2009;12:872–878. doi: 10.1038/nn.2341. [DOI] [PMC free article] [PubMed] [Google Scholar]
- Prinz M, Priller J. Tickets to the brain: role of CCR2 and CX3CR1 in myeloid cell entry in the CNS. J Neuroimmunol. 2010;224:80–84. doi: 10.1016/j.jneuroim.2010.05.015. [DOI] [PubMed] [Google Scholar]
- Martini C, Daniele S, Trincavelli ML, Lecca D, Panighini A, Abbracchio MP. The oral reversibly-binding antiplatelet agent, Ticagrelor, acts as an antagonist at the P2Y-like receptor GPR17. Purinerg Signal. 2010;6:162–162. [Google Scholar]
- Lecca D, Trincavelli ML, Gelosa P, Sironi L, Ciana P, Fumagalli M, et al. The recently identified P2Y-like receptor GPR17 is a sensor of brain damage and a new target for brain repair. PLoS ONE. 2008;3:e3579. doi: 10.1371/journal.pone.0003579. [DOI] [PMC free article] [PubMed] [Google Scholar]
- Wittfeldt A, Emanuelsson H, Brandrup-Wognsen G, van Giezen JJ, Jonasson J, Nylander S, et al. Ticagrelor enhances adenosine-induced coronary vasodilatory responses in humans. J Am Coll Cardiol. 2013;61:723–727. doi: 10.1016/j.jacc.2012.11.032. [DOI] [PubMed] [Google Scholar]
Associated Data
This section collects any data citations, data availability statements, or supplementary materials included in this article.


