

Abstract
The positron emission tomography radioligand [11C]PBR28 targets translocator protein (18 kDa) (TSPO) and is a potential marker of neuroinflammation. [11C]PBR28 binding is commonly quantified using a two-tissue compartment model and an arterial input function. Previous studies with [11C]-(R)-PK11195 demonstrated a slow irreversible binding component to the TSPO proteins localized in the endothelium of brain vessels, such as venous sinuses and arteries. However, the impact of this component on the quantification of [11C]PBR28 data has never been investigated. In this work we propose a novel kinetic model for [11C]PBR28. This model hypothesizes the existence of an additional irreversible component from the blood to the endothelium. The model was tested on a data set of 19 healthy subjects. A simulation was also performed to quantify the error generated by the standard two-tissue compartmental model when the presence of the irreversible component is not taken into account. Our results show that when the vascular component is included in the model the estimates that include the vascular component (2TCM-1K) are more than three-fold smaller, have a higher time stability and are better correlated to brain mRNA TSPO expression than those that do not include the model (2TCM).
Keywords: [11C]PBR28, kinetic modeling, microglia, neuroinflammation, PK11195, TSPO
Introduction
The 18 kDa translocator protein (TSPO)—formerly known as the peripheral benzodiazepine receptor or PBR—is a protein located on the outer mitochondrial membrane and is part of the mitochondrial permeability transition pore. It is involved in a number of mitochondrial functions, including steroidogenesis, Ca2+ signaling, generation of reactive oxidative species and apoptosis.1 TSPO is highly expressed in macrophages, activated microglia and reactive astrocytes and is therefore a putative biomarker of inflammation.2 TSPO binds cholesterol with great affinity but also synthetic ligands such as the isoquinoline carboxamide PK11195. PK11195 labelled with [11C] has been extensively used with positron emission tomography (PET) to assay TSPO concentration in vivo in a variety of diseases.3, 4, 5 [11C]-(R)-PK11195 has, however, some unfavorable characteristics for PET imaging, principally a high non-specific binding. This has stimulated the research of new radioligands with increased bio-availability, lower non-specific binding and higher affinity for the target.6 Examples include ligands such as phenoxyphenil acetamid derivatives (PBR06, DAA106) or bicyclic linker derivatives (PBR111, DPA713).
Although these new tracers generally displayed very favorable characteristics in animal models, human studies have been plagued by a high intersubject variability in binding affinity.7 Genetic differences may partly explain this variability. In fact, a polymorphism of the TSPO protein, due to an Ala–Thr amino-acid substitution in the peptidic chain,8 identifies three different classes of binding affinity: high-affinity binders (HAB), mixed-affinity binders (MAB) and low-affinity binders (LAB). Genotype analysis allows the stratification of subjects into more homogeneous human cohorts, thus increasing statistical power.9
However, genetic differences do not seem to account entirely for the substantial variability found in humans with these new inflammation ligands. A recent study failed to demonstrate increased neuroinflammation with aging10 despite the fact that microglial activation is an aging hallmark.11 Another study demonstrated lack of microglial activity in patients with mild depression.12 Although this particular depression phenotype might not have a neuroinflammatory component, TSPO binding was unexpectedly reduced in the depressed cohorts.13
The only positive study that has included genotyping in the design is the one by Kreisl et al,14 who showed TSPO upregulation in a relatively large Alzheimer cohort (n=19), particularly in the temporal cortex. Yet, even with correction for genotype, age and education, regional variability in their cohorts exceeded 30%.
In the present study, we sought to investigate the reasons for the high binding variability of novel TSPO PET ligands. In particular, we focused on the quantitative approach used for these tracers. Kinetic modeling of TSPO binding is generally performed with a two-tissue compartmental model (2TCM). This model includes a tissue compartment representing the free tracer in tissue and the ligand unspecifically bound and a compartment for the ligand specifically bound to the target.15 One of the basic assumptions of compartmental models is that the ligand concentration in each compartment, in either bound or free form, is homogeneous. However, immunohistochemical studies show a heterogeneous TSPO distribution at the microscopic level in the healthy brain.16 A much higher microglia density is found on the vessel walls (i.e. the endothelium and smooth wall muscles) than in the brain parenchyma. Also, a concentration gradient is likely to occur through the brain parenchyma, where the ligand binds non-specifically to lipids on its way to the binding sites. This phenomenon should be more important for tracers with high lipophilicity, such as second-generation TSPO ligands.17
As elegantly demonstrated by Delforge et al,18 receptor distribution may impact the quantification with kinetic modeling. Because of such gradients, the concentration of the free tracer at the binding site may be lower than its average tissue concentration. The measured in vivo affinity may therefore be lower than the affinity in vitro. This in vivo–in vitro difference was defined by Delforge et al as the reaction volume.18 TSPO binding sites are present on the endothelial layer of blood vessels, and in the mitochondria of the activated microglia. Lower TSPO concentrations are found in astrocytes but not in neurons19 (Figure 1). Because of this uneven distribution, the vessels and the microglia will likely have different reaction volumes and thus different apparent affinities for TSPO ligands. This might translate into different PET kinetics.
Figure 1.

Interaction of TSPO ligand with brain parenchyma. The TSPO has a heterogeneous distribution in the normal brain parenchyma. The endothelium expresses high concentrations of TSPO, which has implications for PET kinetics. The free [11C]PBR28 concentration in tissue is not expected to be generally uniform but distributed along a gradient from the capillary space to the microglia, passing through the endothelium into the extracellular space. In the brain parenchyma the ligand exchanges with lipids (molecular bilayer) and possibly other proteins. It then enters the microglial inner cellular space to reach the mitochondria. All these interactions lower the concentration of the [11C]PBR28 amenable to bind the TSPO. This creates a change in the apparent affinity of the tracer of the target. Thus, the apparent affinity would be higher closer to the vascular space, with resulting slower kinetics for the bound fraction (e.g. irreversible trapping).
In a previous work with [11C]-(R)-PK11195, we have demonstrated a consistent slow TSPO binding component clearly localized in the brain main vasculature, venous sinuses and arteries, associated with a faster equilibrating component that we attributed to microglia.20 We then incorporated this vascular TSPO component into the model and demonstrated that, when vascular sclerosis causes a substantial reduction of vascular TSPO concentration, the neuroinflammatory component of the tracer shows a downward bias.21
In this work, we observed that the most commonly used model to describe [11C]PBR28 kinetics does not adequately fit the initial part of the brain time–activity curves. Considering the findings that showed the presence of TSPO receptors in the brain vasculature, we therefore hypothesized the existence of a tissue binding component together with a greater slow binding component of vascular origin.
In this study we used clinical [11C]PBR28 data from healthy volunteers and computer simulations to (1) propose a new kinetic model for [11C]PBR28 that would take into account the slow uptake of the radioligand into the vessels, which we considered as irreversible for modeling purposes, (2) quantify the bias and variability of a model that does not include such irreversible component.
Materials and methods
Compartmental Models
The two-tissue compartmental model
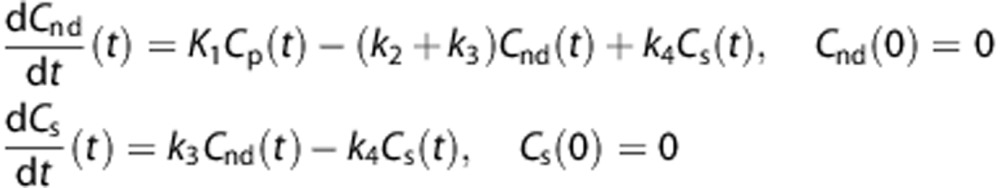
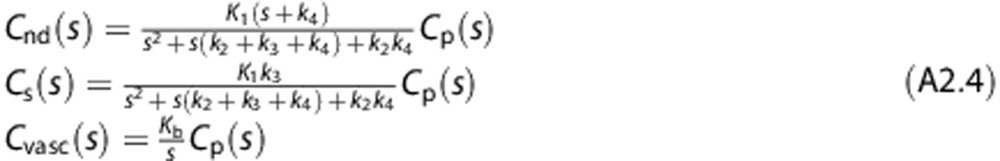
The standard approach proposed in the literature to describe [11C]PBR28 kinetics in brain tissue is a 2TCM.22, 23 The model includes an arterial plasma input function (Cp) and two tissue compartments, one describing the non-displaceable component (Cnd) and one describing the specific binding (Cs) (Figure 2A). The model is described by the following first-order differential equations:
Figure 2.

2TCM and 2TCM-1K model structure. (A) The 2-tissue compartmental model (2TCM) model is composed of two exchangeable tissue compartments, one for the non-displaceable component (Cnd) and one for the specific binding (Cs). K1 and k2 are the rate constants for transport from plasma to tissue and back, respectively. k3 and k4 are the rate constants from the non-displaceable compartment to the specific one and back, respectively. (B) 2TCM-1K includes also a vascular component (Cvasc), with Kb as the rate constant from plasma to the vascular compartment.
 |
where the microparameters K1 (mL/cm3 per minute), k2 (1/minute),k3 (1/minute), and k4 (1/minute) are the rate constants for tracer transport from plasma to tissue and back, and from the non-displaceable to the specific compartment and back, respectively. The principal macroparameter of interest is the total volume of distribution VT (mL/cm3), which is calculated as:
 |
The total amount of radioactivity measured by PET, Cmeasured(t), does not distinguish between the tissue and the blood activity. Therefore the measurement equation in a given volume is
 |
where Cb, expressed in kBq/mL, represents the total radioactivity concentration in the whole blood, including radiometabolites, and Vb is the fraction of blood volume, which is unitless.
The 2TCM with irreversible vascular trapping (2TCM-1K)
The classical 2TCM does not include any trapping component of the tracer, neither in the tissue nor in the blood. Thus, if irreversible tracer retention occurs biologically, it is considered to be negligible in the general picture of the system dynamics.
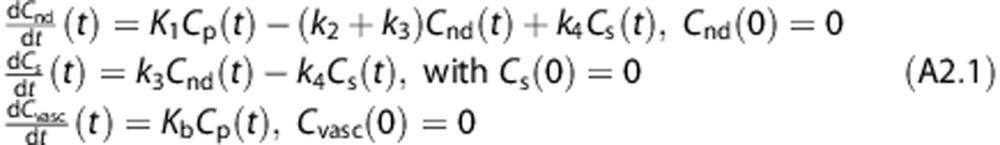
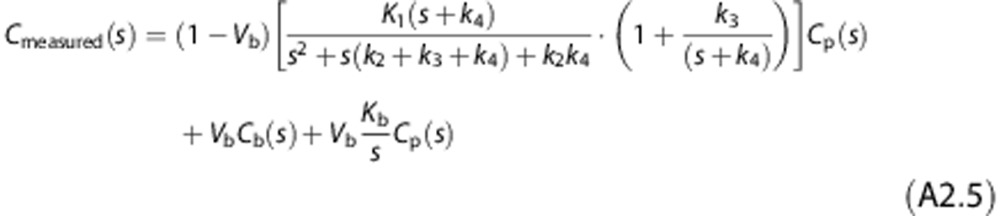
We propose a new model, 2TCM-1K, in which an irreversible compartment to account for the binding of the tracer to the TSPO in the blood vessels (Cvasc) is present within the framework of the classical 2TCM (Figure 2B). The model is described by the following first-order differential equations:
 |
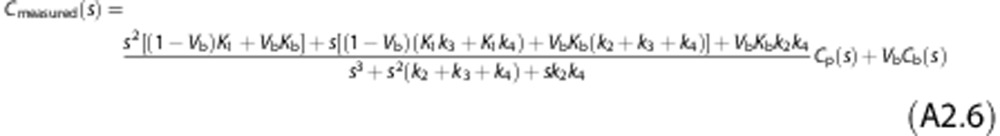
According to this model, the measurement equation becomes:
 |
where the microparameter Kb (1/minute) is the rate constant for tracer binding to the vascular receptor sites (for the complete definition of the model equation refer to Appendix 1). All six model parameters, K1, k2, k3, k4, Kb, Vb, are a priori uniquely identifiable (Appendix 2).
The total volume of distribution VT (mL/cm3) for 2TCM-1K is still calculated according to Equation 2.
Application to Measured PET Data
Radioligand preparation
[11C]PBR28 was synthesized as previously described24 and according to the Investigational New Drug Application #76,441 (http://pdsp.med.unc.edu/snidd/). The radioligand was obtained in high radiochemical purity (>97%).
Image acquisition
Data were obtained from the database of healthy subjects of the Molecular Imaging Branch at the National Institute of Mental Health. In particular two different data sets of healthy subjects (some of them were also included in previous studies24, 25) have been provided: one data set of 11 young healthy subjects (6 men and 5 women; age, 33±9 years); another data set of 8 elderly healthy subjects was used (6 men and 2 women; age, 65±4 years). The protocol was approved by the Ethics Committee of the National Institutes of Health (NIH); all subjects gave written informed consent. The studies were conducted according to the Declaration of Helsinki.
Among the 19 subjects, 10 were heterozygous for the Ala147Thr polymorphism of TSPO, conferring MAB; 8 were homozygous HAB, and for 1 subject no information was available.
All PET images were acquired on an Advance Nxi tomograph (GE Medical Systems, Waukesha, WI, USA), after a bolus injection of 690±13 MBq of [11C]PBR28. An 8-minute 68Ge transmission scan of the brain was acquired for subsequent attenuation correction. Two different experimental protocols were employed. For the first data set dynamic scans comprised 33 frames (6 frames of 30 seconds each, then 3 × 60 seconds, 2 × 120 seconds, and 22 × 300 seconds) for a 120-minute experiment duration, while for the second data set dynamic scans lasted 90 minutes (27 frames: 6 frames of 30 seconds each, then 3 × 60 seconds, 2 × 120 seconds, and 16 × 300 seconds). PET data were reconstructed on a 128 × 128 matrix with a pixel size of 2.0 × 2.0 × 4.25 mm. Details regarding image reconstruction and correction are reported in Hines et al24 and Kreisl et al.26 For consistency, all the subjects were analyzed at 90 minutes, i.e. we removed the last 30 minutes of scan in the first data set.
During the acquisition, blood samples (1.0 mL each) were drawn from the radial artery at 15-second intervals until 150 seconds, followed by 3 to 4.5-mL samples at 3, 4, 6, 8, 10, 15, 20, 30, 40, 50, 60, 75, 90, and 120 minutes. The plasma time–activity curve was corrected with the fraction of unchanged radioligand, as previously described.27
Each subject underwent 1.5- or 3-T clinical brain T1-weighted magnetic resonance imaging (MRI). MRI images were used to derive the anatomical information necessary to define the ROIs.
The Anatomic Automatic Labeling template was coregistered on each subject's MRI scan and PET image using Statistical Parametric Mapping 8 (Wellcome Department of Cognitive Neurology). Whole-brain and 10 brain regions were selected: frontal cortex, parietal cortex, occipital cortex, striatum, thalamus, cingulum, hippocampus–amygdala, insula, thalamus, and cerebellum. Data from bilateral regions were the mean of both the left and the right regions.
Model Identification
Both 2TCM and 2TCM-1K model parameters have been identified at the region of interest (ROI) level using the weighted nonlinear least square estimator (WNLLS), as implemented in Matlab (The Mathworks Inc., Natick, MA, USA). Initial microparameter values for 2TCM and 2TCM-1K were set based on the literature.23 The initial value of Kb for 2TCM-1K was set similarly to the vascular component trapping measured in the [11C]SCH442416 brain PET study, because adenosine A2A receptors have similar endothelial and tissular distribution.28
The relative weights for the individual data points were defined as the inverse of the variance of the PET measurement error. This was assumed to be additive, uncorrelated, having a Gaussian distribution with zero mean and variance equal to the decay-corrected activity divided by the length of the relative scan interval, multiplied for a scale factor γ. The proportionality constant γ was estimated a posteriori as described by Bertoldo et al.29
Statistical Analysis
Model comparison
The goodness of fit has been evaluated by analyzing (1) the weighted residuals and (2) the precision of the estimated parameters, expressed as coefficient of variation (CV). The two models were compared in terms of parsimony criterion by using the Akaike Information Criterion (AIC). The choice of the best model was made on the basis of parameter precision, weighted residuals inspection and parsimony criteria. The percentage of model failures was also considered for the assessment of the model performance. The results are reported separately for HAB and MAB subjects, in order to take into account the effect of TSPO polymorphism on binding affinity.
Regions with VT estimates higher than 10 mL/cm3 (for HABs and MABs) were excluded as non-physiological. The threshold corresponds to the average value plus three times the standard deviation reported in the literature for [11C]PBR28 data.22 In addition, we discarded VT values with a CV higher than 50% in order to eliminate unreliable estimates. The statistical difference of the estimated VT values obtained with 2CTM and 2TCM-1K was assessed by using a one-sample t-test (P<0.05).
Impact of experimental protocol on VTestimates
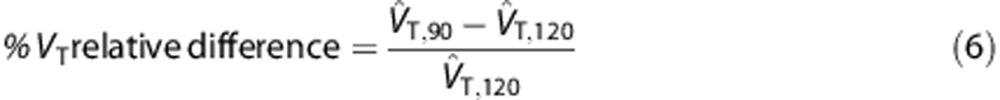
We assessed VT time stability by analyzing the PET data from each young healthy subject (of the first data set) first in their full length (i.e. 0–120 minutes) and then after removing the last 30 minutes (i.e. 0–90 minutes). The stability of VT estimated with both 2TCM and 2TCM-1K was assessed by comparing the values obtained for a 120-minute scan with those obtained with a 90-minute scan, as follows:
 |
The comparison was carried out separately for HAB and MAB subjects.
Comparison of [ 11 C]PBR28 PET binding with brain mRNA TSPO expression
Following the approach presented in Rizzo et al,30 we derived the TSPO mRNA mappings from the Allen Human Brain Atlas, made of six healthy human brains,31 finely sampled with three different probes, and we compared them with the VT estimated with 2TCM and 2TCM-1K. Under the assumption that mRNA expression is predictive of the in vivo protein density of unrelated normal subjects, we evaluated whether the [11C]PBR28 binding description obtained with the two models in competition were consistent with TSPO brain gene profiles. The comparison was performed by correlation analysis at the region level within the same ROIs considered for the PET quantification. To match the datasets for age, PET subjects older than 60 years were excluded from the analysis. In total we analyzed 4 HAB and 7 MAB subjects.
Simulation Studies
Simulation studies were performed to:
assess whether the error of applying 2TCM when the system presents a vascular slow component can be considered negligible and to evaluate how the 2TCM reflects the simulated binding variation;
assess whether the use of 2TCM-1K in a system without vascular trapping leads to erroneous results, in particular whether the model identifies an inexistent irreversible compartment.
Simulation study 1: the impact of using 2TCM in the presence of vascular trapping
The simulation included the following steps:
The parameter estimates obtained with 2TCM-1K on the whole-brain 120-minute time–activity curves (TAC) of one HAB and one MAB subject became the baseline values. The baseline VT values were increased by 10%, 20%, 30%, 40% and 50%, by increasing k3. The other microparameters (K1, k2, k4, Kb and Vb) were left unchanged.
For each VT value we created 50 TACs, which were consistent with those measured in the whole-brain region of the clinical scans. The TACs were generated by convolving the measured arterial input function of the subject with a model impulsive response function defined by the parameters determined in Step 1. Noise-free simulated TACs were generated according to Equation (5).
Noisy TAC data were then obtained by summing noise-free data and simulated white noise (zero-mean and Gaussian distribution). The simulated noise variance was defined as for the measured data, i.e. frame length over tissue activity, with the proportionality constant γ estimated from the real data.
In summary, 300 HAB and 300 MAB kinetics TACs (50 curves × 6 VT cases) were generated. Simulated data were quantified with 2TCM as done for real data (see the previous section). The ability of 2TCM to detect the simulated VT variations was assessed by comparing the 2TCM estimates obtained for each jth increase level (10%, 20%, 30%, 40%, 50%) versus the 2TCM VT value at baseline, as:
 |
where  represents the estimated value obtained with 2TCM in the jth case and
  is the estimated value obtained with 2TCM at baseline.
Simulation study 2: reliability of 2TCM-1K in the absence of trapping
This simulation was performed in the same way as the simulation study 1. However, data were generated on the basis of 2TCM results and modeled with a 2TCM-1K. K1, k2, k3 and k4 values were derived from a 2TCM applied to the reversible tracer [11C](R)-rolipram.32, 33 This has been done in order to avoid using data from a ligand (i.e. [11C]PBR28) that may include a trapping component.
Results
Model Comparison on Clinical Data at 90 minutes
Both 2TCM and 2TCM-1K models described well the descending part of the tissue curves, but 2TCM poorly fitted the initial part of the TAC (Figure 3). In particular, the first 5 minutes of the TAC were constantly underestimated. For this reason, the 2TCM weighted residuals were not randomly distributed, but demonstrated a polarized behavior especially during the first minutes.
Figure 3.

Model fit comparisons. Example of model fits to the parietal (A) and occipital cortex (B) for a representative MAB subject. Black circles represent the measured time–activity curves, while dotted and solid gray lines represent the model description provided by 2TCM and 2TCM-1K, respectively. The zoom of the initial phase of the curve (in the interval 0–20 minutes) is reported in the center of each panel. On the right side are the weighted residuals of 2TCM and 2TCM-1K (dotted and solid gray lines, respectively).
Nevertheless, 2TCM-1K improved the curves fit to the tissue data points in all the regions and increased the randomness of the weighted residuals (Figure 3). To quantify this improvement, we calculated with both models the mean relative difference of the weighted residual sum of squares (WRSS) and the mean relative difference of the residual sum of squares (RSS). 2TCM-1K gave lower values (i.e. a better fit) than 2TCM using both criteria (−64%±15% and −74%±13%, expressed as mean±s.d., respectively). Supplementary Figures 1 and 2 report the single-compartments time courses for both 2TCM and 2TCM-1K for the same regions of Figure 3. Supplementary Figures 3 and 4 report the 2TCM and 2TCM-1K fit comparison in other regions of interest for a representative HAB subject (thalamus and insula).
In terms of outliers the two models performed similarly: considering all the subjects and all the brain regions, 2TCM-1K properly identified all the TACs, while 2TCM showed a poor fit in only one brain region of one subject (frontal cortex of a HAB subject). The outlier region was excluded from further statistical analyses, which were performed on the intersection of the regions where both models returned physiological and precise estimates.
The precision of the remaining individual VT estimates was consistent between both models (on average CV VT=5%±7% for 2TCM-1K and 3%±1% for 2TCM). Also, the microparameters were precisely estimated with both models: for Vb, K1 and k2 the precision was lesser than 14%±7% and for k3 and k4 lesser than 20%±9%. The precision of Kb with the 2TCM-1K model was 11%±8%.
In terms of parsimony criteria, 2TCM-1K outperformed 2TCM (AIC for 2TCM-1K was smaller in 94% of the regions), thus confirming the identification of 2TCM-1K as the optimal model among the tested ones to describe [11C]PBR28 brain data. Notably, the remaining 6% of the regions in which the 2TCM model had a smaller AIC were concentrated in the striatum, the hippocampus/amygdala, insula and the thalamus.
The regional mean VT estimates across the subjects, computed with 2TCM and 2TCM-1K, respectively, were statistically different (P<0.05) (Table 1). The VT values obtained with 2TCM-1K were more than three-fold smaller. Considering the TSPO genotype, HABs had on average 57% greater [11C]PBR28 binding than MABs with 2TCM-1K, but this difference was of only 39% with the classic 2TCM estimates.
Table 1. Between-subject mean and variability of V T estimates obtained with 2TCM and 2TCM-1K.
| VT (mL/cm3) |
HAB |
MAB |
||||||
|---|---|---|---|---|---|---|---|---|
|
2TCM |
2TCM-1K |
2TCM |
2TCM-1K |
|||||
| Mean | s.d. | Mean | s.d. | Mean | s.d. | Mean | s.d. | |
| WHOLE | 4.49 | 1.02 | 1.56 | 0.31 | 3.47 | 0.82 | 0.98 | 0.18 |
| Frontala | 4.43 | 1.04 | 1.59 | 0.36 | 3.58 | 0.92 | 0.98 | 0.21 |
| Parietal | 4.44 | 0.95 | 1.58 | 0.32 | 3.50 | 0.80 | 0.96 | 0.19 |
| Occipital | 4.62 | 0.92 | 1.77 | 0.28 | 3.69 | 1.07 | 1.05 | 0.20 |
| Striatum | 4.73 | 1.03 | 1.45 | 0.25 | 3.09 | 0.82 | 0.99 | 0.24 |
| Temporal | 4.68 | 1.21 | 1.59 | 0.30 | 3.45 | 0.79 | 1.04 | 0.24 |
| Cingulum | 4.34 | 0.83 | 1.62 | 0.32 | 3.36 | 0.91 | 0.95 | 0.18 |
| HipAmy | 4.88 | 1.42 | 1.53 | 0.26 | 3.01 | 0.74 | 1.16 | 0.36 |
| Insula | 4.74 | 1.06 | 1.79 | 0.51 | 3.37 | 0.78 | 1.14 | 0.26 |
| Thalamus | 5.25 | 1.20 | 1.85 | 0.48 | 3.22 | 0.86 | 1.30 | 0.19 |
| Cerebellum | 4.35 | 0.75 | 1.72 | 0.20 | 3.16 | 0.72 | 1.02 | 0.17 |
Abbreviations: HAB, high-affinity binder; MAB, mixed-affinity binder; 2TCM, two-tissue compartmental model.
The values are reported as mean (s.d.) for all the subjects, except where indicated, in all the regions where both models returned physiological and reliable estimates. The values are reported separately for homozygous high-affinity binders (HAB, 8 subjects) and heterozygous mixed-affinity binders (MAB, 10 subjects).
Values are mean±s.d. for 7 subjects.
The regional variability of VT (s.d. of regional values across subjects) was smaller in absolute value with 2TCM-1K than with 2TCM (0.33 and 1.04 mL/cm3 for HABs; 0.22 and 0.84 mL/cm3 for MABs, respectively) (Table 1). These results were confirmed also when comparing the individual regional VT estimates (i.e. 208 values), estimated with both models, in terms of mean (±s.d.) and median (±median absolute deviation, MAD) (Table 2). The magnitude of individual HAB VT estimates was still higher than MAB VT (Figure 4A) with both models, but was clearly in a different range: the mean relative VT difference between 2TCM and 2TCM-1K was −64%±7% (range: −87% to −49%) for HABs and −67%±10% (range: −85% to −44%) for MABs. Importantly, the VT values obtained with 2TCM and 2TCM-1K were not only significantly different, but also poorly correlated, with an R2=0.18 for HAB and R2<0.001 for MAB subjects (Figure 4B).
Table 2. Statistical description of the distribution of V T and K b estimates (across all regions and subjects).
| VT (mL/cm3) |
HAB |
MAB |
Kb (1/min) |
HAB |
MAB |
||
|---|---|---|---|---|---|---|---|
| 2TCM | 2TCM-1K | 2TCM | 2TCM-1K | 2TCM-1K | |||
| Mean | 4.63 | 1.64 | 3.35 | 1.05 | Mean | 0.29 | 0.21 |
| s.d. | 1.02 | 0.34 | 0.83 | 0.24 | s.d. | 0.12 | 0.10 |
| CV (%) | 22 | 21 | 25 | 23 | CV (%) | 42 | 46 |
| Min | 2.59 | 0.85 | 1.93 | 0.63 | Min | 0.14 | 0.10 |
| Max | 7.77 | 2.60 | 5.75 | 1.75 | Max | 0.79 | 0.76 |
| Median | 4.61 | 1.64 | 3.20 | 0.99 | Median | 0.26 | 0.20 |
| MAD | 0.81 | 0.26 | 0.65 | 0.19 | MAD | 0.09 | 0.06 |
| CV (%) | 18 | 16 | 20 | 20 | CV (%) | 32 | 32 |
Abbreviations: CV, coefficient of variation; HAB, high-affinity binder; MAB, mixed-affinity binder; 2TCM, two-tissue compartmental model.
VT values have been obtained with 2TCM and 2TCM-1K. Kb Values have been obtained with 2TCM-1K. The values are reported separately for homozygous high-affinity binders (HAB, 8 subjects) and heterozygous mixed-affinity binders (MAB, 10 subjects). s.d. and MAD refer to standard deviation and median absolute deviation respectively.
Figure 4.

Distributions and correlation of regional VT and Kb estimates. Results are reported for 2TCM (VT, panel A) and 2TCM-1K (VT and Kb, panels A and B, respectively). Homozygous high-affinity binders (HAB, 8 subjects) and heterozygous mixed-affinity binders (MAB, 10 subjects) are shown separately. (C) Correlation analysis of 2TCM versus 2TCM VT estimates of HAB subjects (black diamonds) and MAB subjects (gray squares). The equations of the regression lines and the Pearson's correlation coefficients (R2) are reported in the same chart.
The between-subject variability of VT values across brain regions was smaller in absolute value for 2TCM-1K compared with 2TCM (0.34 and 1.02 mL/cm3 for HABs; 0.24 and 0.83 mL/cm3 for MABs, respectively; Table 2). A smaller variability with 2TCM-1K was also found in terms of median±MAD (Table 2).
The vascular component estimated with 2TCM-1K was consistent across the brain and precisely estimated (average precision between regions: 11%±8%). The between-subject mean value of Kb in the whole brain was 0.263±0.134 per minute. Considering the individual Kb estimates of all the regions (i.e. 208 values), the mean value was 0.29 per minute (s.d. Kb=0.12; median Kb=0.26) and 0.21 per minute (s.d. Kb=0.10; median Kb=0.20) for HAB and MAB subjects, respectively (Figure 4C and Table 2).
We also considered separately the model performance in the two different data sets (i.e. young versus elderly subjects). Two main findings resulted from the comparison: (1) 2TCM-1K better described brain [11C]PBR28 data compared with 2TCM in elderly subjects (smaller AIC in 100% of ROIs; higher mean relative difference of WRSS and RSS, equal to −67%±17% and −79%±1%, respectively); (2) it was not possible to determine a unique trend of VT changes with age in HAB and MAB subjects with either models. Interestingly, only Kb showed an increasing trend for higher age. However, the limited number of subjects per category (young: 3 HABs and 7 MABs; elderly: 5 HABs and 3 MABs) prevented a more robust statistical comparison. An example of 2TCM and 2TCM-1K model fitting is reported in Supplementary Figures 5 and 6 for one MAB and one HAB subject.
The remaining subject of the data set (not tested for genetic polymorphism) showed very high values of VT (2.50±0.24 mL/cm3) with 2TCM-1K, higher than those obtained in both HAB and MAB subjects. Also the vascular estimate of this subject (Kb=0.55±0.13 per minute) was much higher than that measured in both HAB and MAB subjects.
Finally, Vb estimation is also affected by taking the vascular irreversible component into account in the kinetic model. With the classic 2TCM Vb values were 0.064±0.013, and with 2TCM-1K Vb values were 0.055±0.014, which is closer to the standard 5% value commonly used as brain blood fraction.
Impact of Experimental Protocol
Reducing the experimental scanning time caused an important reduction in VT values for 2TCM in both HABs and MABs (−23%±10% and −31%±12%, respectively). However, 2TCM-1K VT remained constant also at 90 minutes, with a relative difference of 0%±18% and 1%±17% for HABs and MABs, respectively (Supplementary Figure 7). Similarly, Kb was also insensitive to scan duration (relative difference 4%±22% and 2%±13% for HABs and MABs, respectively).
Genomic versus PET Analysis
When we considered the comparison mRNA-PET binding for all the subjects (HABs and MABs), 2TCM-1K VT showed a higher correlation with gene expression than 2TCM VT (depending on the probe: from R2=0.31 to R2=0.49 for 2TCM-1K versus R2<0.01 for 2TCM). For both models the estimates were directly proportional to mRNA values (Supplementary Figure 8).
We also assessed separately HABs and MABs, even though no genotype effect was expected in the mRNA profiles. Nevertheless, we found that the VT estimated by 2TCM in MABs was not only less correlated (R2<0.1 versus R2=0.45 for 2TCM-1K), but also inversely proportional, highlighting a spatial expression pattern inconsistent with the genomic distribution.
In general, the mRNA-PET cross-correlation values for 2TCM-1K were comparable with the mRNA auto-correlation of TSPO gene expression: from R2=0.37 to R2=0.45.
Notably, Kb was always well correlated with TSPO mRNA expression (R2=0.30±0.28).
Simulation Studies
Simulation study 1
Figure 5 reports the results of the use of 2TCM in tissues with vascular trapping, for different levels of VT, for both HAB and MAB scenarios.
Figure 5.

Application of 2TCM in simulated tissues with vascular trapping. We simulated different scenarios of VT with the 2TCM-1K model (baseline and from 10% to 50% VT increases) for both HAB and MAB cases (dark and light gray bars, respectively). The figure reports the VT variation (mean±s.d.) estimated by the 2TCM model when applied to these data.
2TCM converged in all MAB curves, yielding reliable and precise but not accurate estimates. In HAB curves there were however varying percentages of outliers. In particular, when considering a 30% increase of VT compared to the baseline, 9% of estimates had to be eliminated. The percentage of outliers followed the increase of VT (up to 34% of outliers for a 50% VT increase).
Importantly, 2TCM greatly underestimated the increase of simulated VT values. For example, when MAB VT values were increased by 20%, the VT estimated with 2TCM was increased by only 5%±5%. With 50% VT increase, the variation of the estimated VT was only +15%±6%. This bias was even greater in HAB curves, where the estimated variation on VT was even smaller and the variability higher (e.g. 7%±11% variation for a 50% increase).
Simulation study 2
When 2TCM-1K was applied to tissues devoid of any irreversible component, the estimator converged to unreliable Kb estimates for both HAB and MAB tissues. In fact, in 98% of curves CV Kb was higher than 50%, and it was higher than 100% in 84% of curves. Moreover, despite a good fit of the data, the irreversible compartment fraction was negligible with regard to the other identified components (Supplementary Figure 9 of Supplementary Material).
Discussion
In this work we proposed a new modeling approach for [11C]PBR28 brain PET studies, 2TCM-1K, by adding an irreversible compartment to the standard 2TCM. In particular, we demonstrated that the inclusion of the vascular binding component in the kinetic modeling of this tracer always provided a more parsimonious description of the data. Compared with 2TCM, 2TCM-1K was always selected as the optimal model to describe the data, according to all the indexes evaluated (residuals, parsimony criteria, estimates' values and precisions).
In addition, the new model showed to be insensitive to reduce scan duration (from 120 to 90 minutes), with an average relative difference smaller than 2%. On the contrary, 2TCM applied to 90-minute tissue curves showed a reduction in VT of up to 30%.
The VT values estimated by the new model were consistent with the known TSPO brain distribution in humans: the highest binding was observed in the thalamus, as previously reported also with [11C]-(R)-PK11195.20 Notably, this pattern of homogeneous cerebral VT in the control subjects was in agreement with the pattern of TSPO gene expression. On the contrary, 2TCM VT showed to be more heterogeneous across brain regions and less correlated with genomic information.
Among the anatomical regions considered, none could be used as the reference region, as specific binding was found all over the brain.
Importantly, microglial VT values estimated by 2TCM-1K were low, which is very much in line with the very low activated microglial density in healthy individuals.34
Using the novel model, the known relationship between VT and binding affinity (owing to the Ala147Thr polymorphism of TSPO) was maintained: HAB subjects had ∼60% greater [11C]PBR28 binding than MAB subjects in all regions measured (compared to the ∼40% reported by Kreisl et al25).
Notably, the VT values of the subject whose genotype was unknown was twofold the average value of HAB subjects. This is not related to an age effect as the [11C]PBR28 binding is significantly higher than the one observed in elderly subjects.
In this work, the plasma free fraction of the radioligand (fp) was not used to correct VT, because of the high variability of the measurements (fp was 4.0±1.2, coefficient of variance 29%). As reported in Hines et al,24 the source of this variability could have resulted from technical differences in blood processing, such as time between obtaining and processing the sample and operator variability. Therefore, only VT (as defined in Equation (2)) was presented.
The use of the new kinetic model consistently reduced the variability of the tissular VT, indicating that most of the intersubject variance previously reported in human cohorts may be associated with a variable binding of the tracer to the vascular TSPO component. This finding is of biological interest and will be subject to further investigations.
The novel 2TCM-1K includes a vascular irreversible component, which is associated to the parent plasma Cp. We assessed whether this component, instead of being due to endothelial TSPO, might have been caused by the trapping of radioactive metabolites, but the use of the metabolites' input function did not support this. The use of the tracer concentration of metabolites or of the total concentration in plasma as input for the irreversible component did not allow recovering the initial part of the tissue curve. Therefore these new models were never deemed to have the optimal structure to describe the data (data not shown). In addition, as described by Turkheimer et al,20 we also considered the possibility of a slowly reversible (rather than irreversible) vascular component. However, this alternative model could not identify the kinetic parameters. This does not mean however that the biological interaction of the tracer with the vasculature is truly irreversible, but just that there is not enough information in the data to properly identify a possible vascular washout.
Further evidence of the need to model the tracer binding to the vasculature was obtained by applying the 2TCM-1K to a gray matter region and to a vascular tissue curve. While in the gray matter the 2TCM-1K was reliably identified, in the vascular tissue the model collapsed to a single-tissue compartment and the vascular trapping remained unaltered (Supplementary Figure 10.
The brain vascular trapping Kb was estimated accurately and it was homogeneous across the brain regions, as expected from a data set of healthy subjects. Also, this parameter correlated well with the TSPO polymorphism, with higher Kb values for HABs, and with TSPO mRNA expression.
Given that the standard model to quantify [11C]PBR28 binding is a 2TCM, including when different populations of subjects (healthy versus pathological) are compared, we investigated the impact of not including the endothelial component in the quantification and the correlation between the estimates of the two competing models. The analysis of the clinical data demonstrated that 2TCM and 2TCM-1K VT estimates are significantly different and, more importantly, poorly correlated (R2<0.25). The simulation analysis not only confirmed these findings, but also showed that 2TCM is not very sensitive to variations in tissular VT, as only differences greater than 20% could be properly identified for simulated MAB curves. This effect was even more critical when considering HAB where even a 50% increase of VT translated into a 7% variation in the estimated value. This finding might substantially change the results of previously published clinical studies.
Further investigations of the 2TCM-1K performance in clinical models with neuroinflammation are required. Notably, for the validation of this new model in pathological conditions, correlation with biological evidence (such as immunohistochemical staining) becomes even more essential than in the healthy-subject conditions.
Conclusion
The use of a model that explicitly accounts for the endothelial TSPO binding is fundamental for a precise and accurate quantification of [11C]PBR28 brain PET data.
When this component is neglected, the receptor binding in tissue is severely underestimated and binding changes due to neuroinflammation may be lost.
Acknowledgments
We thank Dr Robert Innis and Dr Masahiro Fujita at the Molecular Imaging Branch of the National Institute of Mental Health for providing the [11C]PBR28 images and for the interesting scientific discussions regarding the results.
Appendix 1
Derivation of the measurement equation of 2TCM-1K model
To derive the measurement equation for 2TCM-1K in terms of concentrations, we start by formulating it in terms of mass.35 The total amount measured by PET, qmeasured(t), is the summation of all tracer amounts present in the volume of observation. The measurement mass equation is:
where qnd(t) and qs(t) represent the amount of the tracer in the nondisplaceable and specific space (tissue compartments) and qvasc(t) and qb(t) are the amounts of tracer in the vascular space and whole blood, respectively (blood pool).
Denoting with Vtissue, Vblood, and Vtotal the tissue and the blood volume, and the total volume (given by Vtotal=Vtissue+Vblood), respectively, one can express Equation (A1.1) in terms of concentration, i.e. qmeasured(t)=VtotalCmeasured(t):
 |
Expressing Vtissue=Vtotal−Vblood and dividing by the total volume, one has:
 |
From A1.3 it is easy to derive the blood volume fraction as Vb=Vblood/Vtotal, i.e. the fraction of total volume occupied by the blood pool, thus obtaining Equation (5).
Appendix 2
Demonstration of a priori identifiability of 2TCM-1K model
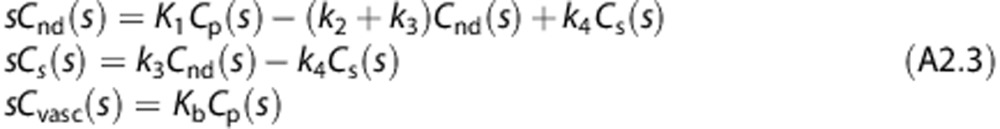
The proposed 2TCM-1K model, as defined in Figure 2B, can be represented by the following system of first-order differential equations:
 |
The total amount of radioactivity measured by PET, Cmeasured(t), is given by
 |
where Cnd(t)+Cs(t) represents the activity of the tracer in the target tissues, Cb the activity in the whole blood, Cvasc the tracer trapped in the blood vessel endothelium, and Vb the fraction of volume occupied by blood over the tissue within the considered field of view. To demonstrate that the proposed model 2TCM-1K is uniquely identifiable a priori we used a transfer function approach.35 Rearranging the Laplace transforms of Equation (A1) gives
 |
Solving for Cnd, Cs and Cvasc,
 |
Thus, the Laplace transform of Cmeasured(t) can be written as
 |
which leads to
 |
The exhaustive summary of the model is given by
 |
where φ1, …, φ6 are the known observational parameters. It is easy to show that all the six parameters K1, k2, k3, k4, Kb and Vb are now identifiable a priori. In fact the solution of the system of Equation (A7) gives
 |
The authors declare no conflict of interest.
Footnotes
Supplementary Information accompanies the paper on the Journal of Cerebral Blood Flow & Metabolism website (http://www.nature.com/jcbfm)
This work was supported in part by the Intramural Research Program, National Institute of Mental Health, National Institutes of Health (IRP-NIMH-NIH) and by Programme Grant ‘Quantitative methodologies for Positron Emission Tomography', UK Medical Research Council (MRC) No. G1100809/1.
Supplementary Material
References
- Gatliff J, Campanella M. The 18 kDa translocator protein (TSPO): a new perspective in mitochondrial biology. Curr Mol Med. 2012;12:356–368. doi: 10.2174/1566524011207040356. [DOI] [PubMed] [Google Scholar]
- Jacobs AH, Tavitian B. INMiND consortium. Noninvasive molecular imaging of neuroinflammation. J Cereb Blood Flow Metab. 2012;32:1393–1415. doi: 10.1038/jcbfm.2012.53. [DOI] [PMC free article] [PubMed] [Google Scholar]
- Debruyne JC, Versijpt J, Van Laere KJ, De Vos F, Keppens J, Strijckmans K, et al. PET visualization of microglia in multiple sclerosis patients using [11C]PK11195. Eur J Neurol. 2003;10:257–264. doi: 10.1046/j.1468-1331.2003.00571.x. [DOI] [PubMed] [Google Scholar]
- Gerhard A, Banati RB, Goerres GB, Cagnin A, Myers R, Gunn RN, et al. [11C](R)-PK11195 PET imaging of microglial activation in multiple system atrophy. Neurology. 2003;61:686–689. doi: 10.1212/01.wnl.0000078192.95645.e6. [DOI] [PubMed] [Google Scholar]
- Cagnin A, Gerhard A, Banati RB. In vivo imaging of neuroinflammation. Eur Neuropsychopharmacol. 2002;12:581–586. doi: 10.1016/s0924-977x(02)00107-4. [DOI] [PubMed] [Google Scholar]
- Chauveau F, Boutin H, Van Camp N, Dollé F, Tavitian B. Nuclear imaging of neuroinflammation: a comprehensive review of [11C]PK11195 challengers. Eur J Nucl Med Mol Imaging. 2008;35:2304–2319. doi: 10.1007/s00259-008-0908-9. [DOI] [PubMed] [Google Scholar]
- Kreisl WC, Lyoo CH, McGwier M, Snow J, Jenko KJ, Kimura N, et al. In vivo radioligand binding to translocator protein correlates with severity of Alzheimer's disease. Brain. 2013;136 (Pt 7:2228–2238. doi: 10.1093/brain/awt145. [DOI] [PMC free article] [PubMed] [Google Scholar]
- Owen DR, Gunn RN, Rabiner EA, Bennacef I, Fujita M, Kreisl WC, et al. Mixed-affinity binding in humans with 18-kDa translocator protein ligands. J Nucl Med. 2011;52:24–32. doi: 10.2967/jnumed.110.079459. [DOI] [PMC free article] [PubMed] [Google Scholar]
- Kreisl WC, Jenko KJ, Hines CS, Lyoo CH, Corona W, Morse CL, et al. A genetic polymorphism for translocator protein 18 kDa affects both in vitro and in vivo radioligand binding in human brain to this putative biomarker of neuroinflammation. J Cereb Blood Flow Metab. 2013;33:53–58. doi: 10.1038/jcbfm.2012.131. [DOI] [PMC free article] [PubMed] [Google Scholar]
- Suridjan I, Rusjan PM, Voineskos AN, Selvanathan T, Setiawan E, Strafella AP, et al. Neuroinflammation in healthy aging: a PET study using a novel Translocator Protein 18kDa (TSPO) radioligand, [(18)F]-FEPPA. Neuroimage. 2014;84:868–875. doi: 10.1016/j.neuroimage.2013.09.021. [DOI] [PMC free article] [PubMed] [Google Scholar]
- Norden DM, Godbout JP. Review: microglia of the aged brain: primed to be activated and resistant to regulation. Neuropathol Appl Neurobiol. 2013;39:19–34. doi: 10.1111/j.1365-2990.2012.01306.x. [DOI] [PMC free article] [PubMed] [Google Scholar]
- Hannestad J, DellaGioia N, Gallezot JD, Lim K, Nabulsi N, Esterlis I, et al. The neuroinflammation marker translocator protein is not elevated in individuals with mild-to-moderate depression: a [11C]PBR28 PET study. Brain Behav Immun. 2013;33:131–138. doi: 10.1016/j.bbi.2013.06.010. [DOI] [PMC free article] [PubMed] [Google Scholar]
- Steiner J, Bielau H, Brisch R, Danos P, Ullrich O, Mawrin C, et al. Immunological aspects in the neurobiology of suicide: elevated microglial density in schizophrenia and depression is associated with suicide. J Psychiatr Res. 2008;42:151–157. doi: 10.1016/j.jpsychires.2006.10.013. [DOI] [PubMed] [Google Scholar]
- Kreisl WC, Lyoo CH, McGwier M, Snow J, Jenko KJ, Kimura N, et al. In vivo radioligand binding to translocator protein correlates with severity of Alzheimer's disease. Brain. 2013;136:2228–2238. doi: 10.1093/brain/awt145. [DOI] [PMC free article] [PubMed] [Google Scholar]
- Mintun MA, Raichle ME, Kilbourn MR, Wooten GF, Welch MJ. A quantitative model for the in vivo assessment of drug binding sites with positron emission tomography. Ann Neurol. 1984;15:217–227. doi: 10.1002/ana.410150302. [DOI] [PubMed] [Google Scholar]
- Turkheimer FE, Edison P, Pavese N, Roncaroli F, Anderson AN, Hammers A, et al. Reference and target region modeling of [11C]-(R)-PK11195 brain studies. J Nucl Med. 2007;48:158–167. [PubMed] [Google Scholar]
- Guo Q, Owen DR, Rabiner EA, Turkheimer FE, Gunn RN. Identifying improved TSPO PET imaging probes through biomathematics: the impact of multiple TSPO binding sites in vivo. Neuroimage. 2012;60:902–910. doi: 10.1016/j.neuroimage.2011.12.078. [DOI] [PMC free article] [PubMed] [Google Scholar]
- Delforge J, Syrota A, Bendriem B. Concept of reaction volume in the in vivo ligand-receptor model. J Nucl Med. 1996;37:118–125. [PubMed] [Google Scholar]
- Cosenza-Nashat M, Zhao ML, Suh HS, Morgan J, Natividad R, Morgello S, et al. Expression of the translocator protein of 18 kDa by microglia, macrophages and astrocytes based on immunohistochemical localization in abnormal human brain. Neuropathol Appl Neurobiol. 2009;35:306–328. doi: 10.1111/j.1365-2990.2008.01006.x. [DOI] [PMC free article] [PubMed] [Google Scholar]
- Turkheimer FE, Edison P, Pavese N, Roncaroli F, Anderson AN, Hammers A, et al. Reference and target region modeling of [11C]-(R)-PK11195 brain studies. J Nucl Med. 2007;48:158–167. [PubMed] [Google Scholar]
- Tomasi G, Edison P, Bertoldo A, Roncaroli F, Singh P, Gerhard A, et al. Novel reference region model reveals increased microglial and reduced vascular binding of 11C-(R)-PK11195 in patients with Alzheimer's disease. J Nucl Med. 2008;49:1249–1256. doi: 10.2967/jnumed.108.050583. [DOI] [PubMed] [Google Scholar]
- Fujita M, Imaizumi M, Zoghbi SS, Fujimura Y, Farris AG, Suhara T, et al. Kinetic analysis in healthy humans of a novel positron emission tomography radioligand to image the peripheral benzodiazepine receptor, a potential biomarker for inflammation. Neuroimage. 2008;40:43–52. doi: 10.1016/j.neuroimage.2007.11.011. [DOI] [PMC free article] [PubMed] [Google Scholar]
- Zanotti-Fregonara P, Liow J-S, Fujita M, Dusch E, Zoghbi SS, Luong E, et al. Image-derived input function for human brain using high resolution PET imaging with [11C](R)-rolipram and [11C] PBR28. PloS One. 2011;6:e17056. doi: 10.1371/journal.pone.0017056. [DOI] [PMC free article] [PubMed] [Google Scholar]
- Hines CS, Fujita M, Zoghbi SS, Kim JS, Quezado Z, Herscovitch P, et al. Propofol decreases in vivo binding of 11C-PBR28 to translocator protein (18 kDa) in the human brain. J Nucl Med. 2013;54:64–69. doi: 10.2967/jnumed.112.106872. [DOI] [PMC free article] [PubMed] [Google Scholar]
- Kreisl WC, Jenko KJ, Hines CS, Lyoo CH, Corona W, Morse CL, et al. A genetic polymorphism for translocator protein 18 kDa affects both in vitro and in vivo radioligand binding in human brain to this putative biomarker of neuroinflammation. J Cerebr Blood Flow Metab. 2012;33:53–58. doi: 10.1038/jcbfm.2012.131. [DOI] [PMC free article] [PubMed] [Google Scholar]
- Kreisl WC, Lyoo CH, McGwier M, Snow J, Jenko KJ, Kimura N, et al. In vivo radioligand binding to translocator protein correlates with severity of Alzheimer's disease. Brain. 2013;136 (Pt 7:2228–2238. doi: 10.1093/brain/awt145. [DOI] [PMC free article] [PubMed] [Google Scholar]
- Zoghbi SS, Shetty HU, Ichise M, Fujita M, Imaizumi M, Liow J-S, et al. PET imaging of the dopamine transporter with 18F-FECNT: a polar radiometabolite confounds brain radioligand measurements. J Nucl Med. 2006;47:520–527. [PubMed] [Google Scholar]
- Veronese M, Schmidt K, Smith C, Rizzo G, Turkheimer F, Bertoldo A. Spectral analysis iterative filter for voxel-wise quantification of PET tracers with irreversible uptake. J Cerebr Blood Flow Metab. 2012;32:S147. [Google Scholar]
- Bertoldo A, Vicini P, Sambuceti G, Lammertsma AA, Parodi O, Cobelli C. Evaluation of compartmental and spectral analysis models of [/sup 18/F] FDG kinetics for heart and brain studies with PET. IEEE Trans Biomed Eng. 1998;45:1429–1448. doi: 10.1109/10.730437. [DOI] [PubMed] [Google Scholar]
- Rizzo G, Veronese M, Heckemann RA, Selvaraj S, Howes OD, Hammers A, et al. The predictive power of brain mRNA mappings for in vivo protein density: a positron emission tomography correlation study J Cerebral Blood Flow Metabadvance online publication, 5 February 2014;doi: 10.1038/jcbfm.2014.21(e-pub ahead of print). [DOI] [PMC free article] [PubMed]
- Hawrylycz MJ, Lein S, Guillozet-Bongaarts AL, Shen EH, Ng L, Miller JA, et al. An anatomically comprehensive atlas of the adult human brain transcriptome. Nature. 2012;489:391–399. doi: 10.1038/nature11405. [DOI] [PMC free article] [PubMed] [Google Scholar]
- Rizzo G, Veronese M, Zanotti-Fregonara P, Bertoldo A. Voxelwise quantification of [(11)C](R)-rolipram PET data: a comparison between model-based and data-driven methods. J Cereb Blood Flow Metab. 2013;33:1032–1040. doi: 10.1038/jcbfm.2013.43. [DOI] [PMC free article] [PubMed] [Google Scholar]
- Zanotti-Fregonara P, Zoghbi SS, Liow J-S, Luong E, Boellaard R, Gladding RL, et al. Kinetic analysis in human brain of [< sup> 11</sup> C](< i> R</i>)-rolipram, a positron emission tomographic radioligand to image phosphodiesterase 4: a retest study and use of an image-derived input function. Neuroimage. 2011;54:1903–1909. doi: 10.1016/j.neuroimage.2010.10.064. [DOI] [PMC free article] [PubMed] [Google Scholar]
- Wong WT. Microglial aging in the healthy CNS: phenotypes, drivers, and rejuvenation. Front Cell Neurosci. 2013;7:22. doi: 10.3389/fncel.2013.00022. [DOI] [PMC free article] [PubMed] [Google Scholar]
- Bertoldo A, Peltoniemi P, Oikonen V, Knuuti J, Nuutila P, Cobelli C. Kinetic modeling of [18F] FDG in skeletal muscle by PET: a four-compartment five-rate-constant model. Am J Physiol Endocrinol Metab. 2001;281:E524–E536. doi: 10.1152/ajpendo.2001.281.3.E524. [DOI] [PubMed] [Google Scholar]
Associated Data
This section collects any data citations, data availability statements, or supplementary materials included in this article.