

Summary
Pluripotent stem cells display significant heterogeneity in gene expression, but whether this diversity is an inherent feature of the pluripotent state remains unknown. Single-cell gene expression analysis in cell subsets defined by surface antigen expression revealed that human embryonic stem cell cultures exist as a continuum of cell states, even under defined conditions that drive self-renewal. The majority of the population expressed canonical pluripotency transcription factors and could differentiate into derivatives of all three germ layers. A minority subpopulation of cells displayed high self-renewal capacity, consistently high transcripts for all pluripotency-related genes studied, and no lineage priming. This subpopulation was characterized by its expression of a particular set of intercellular signaling molecules whose genes shared common regulatory features. Our data support a model of an inherently metastable self-renewing population that gives rise to a continuum of intermediate pluripotent states, which ultimately become primed for lineage specification.
Highlights
-
•
Single-cell transcript profiles characteristic of distinct substates of pluripotency
-
•
Prospective isolation of substate with high self-renewal, no lineage priming
-
•
Self-renewing subpopulation marked by expression of specific ligands and receptors
Pera and colleagues used cell surface antigen expression and single-cell gene expression profiles to define cell substates of human pluripotent stem cells. Most cells expressed canonical pluripotency transcription factors and could differentiate into derivatives of all three germ layers. A minority subpopulation of cells displayed high self-renewal capacity, consistently high levels of transcripts for all pluripotency-related genes studied, and no lineage priming.
Introduction
The defining features of pluripotent stem cells (PSCs), whether they originate from germ cell tumors, from the embryo, or through cellular reprogramming, are their abilities to undergo self-renewal and to give rise to all of the tissues of the body. However, this straightforward operational definition of pluripotency has been complicated in recent years by the revelation that there are a number of distinct cellular states that display these features. In the mouse, the species in which our understanding of PSCs is most advanced (Nichols and Smith, 2012; Tesar et al., 2007), there are two widely recognized states of pluripotency, referred to as naive and primed states, corresponding to distinct stages of peri-implantation embryonic development. Strong pharmacological suppression of the primary signaling pathways that drive differentiation enables the maintenance of mouse embryonic stem cells (ESCs) from the preimplantation epiblast in a naive state of pluripotency, defined as a fully unrestricted state that possesses the flexibility to give rise to all embryonic lineages and to form germline chimeras (Ying et al., 2008). PSCs isolated from a later stage of development, the postimplantation epiblast, are known as epiblast stem cells (Brons et al., 2007; Tesar et al., 2007). These cells lack the ability to form chimeras when introduced into preimplantation embryos but will give rise to teratomas when injected into host animals and can colonize all tissues including the germline when assayed in postimplantation embryo cultures in vitro (Huang et al., 2012). Besides the disparity in developmental potential in vivo, there are other significant differences between these two types of PSCs, both in terms of gene expression and their requirements for stem cell maintenance. Importantly, epiblast stem cells display more marked expression of genes associated with early germ layer formation (Tesar et al., 2007).
The question of what development state primate ESCs equate to has never been clearly resolved. Early work on cell lines from human germ cell tumors, confirmed by studies on monkey and human ESCs, showed clearly that primate PSCs differ in phenotype from mouse teratocarcinoma or mouse ESCs (Pera et al., 2000). By contrast, mouse epiblast stem cells resemble human ESCs in many respects. However, there are also some significant differences between these two cell types. Gafni et al. (2013) recently reported cell-culture conditions that support maintenance of human PSCs in a naive-like state, with high levels of pluripotency-associated gene expression, minimal expression of lineage-specific genes, and a high capacity for self-renewal. Chan et al. (2013) also described conditions that support maintenance of naive human PSCs, which showed strong coexpression of GATA6 and NANOG, similar to epiblast cells. The cell types described by these two groups were similar to mouse naive PSCs but were different in some aspects, in particular, in their requirement for nodal/activin and FGF signaling for stem cell maintenance.
Efforts to understand the states of pluripotency in different species are complicated by heterogeneity in ESC and epiblast stem cell lines, and by the existence of subpopulations of cells in both mouse and human ESC cultures that display lineage priming, or the coexpression of pluripotency and lineage-specific genes (Enver et al., 2009; Martinez Arias and Brickman, 2011; Nichols and Smith, 2009). Though the occurrence of heterogeneity in ESC populations in vitro and in the embryo in vivo is now widely accepted, recent results on mouse ESCs challenge the notion that it is an inherent feature of the pluripotent state (Marks et al., 2012). Marks et al. (2012) have shown that compared to cells maintained in serum-supplemented medium, in mouse ESC cultures strictly maintained in a naive state of pluripotency, heterogeneity in expression of key pluripotency genes was vastly reduced, coexpression of pluripotency and lineage-specific genes was strongly suppressed, and the bivalent chromatin marks seen in cells grown under conventional conditions, thought to reflect a type of molecular priming for differentiation, are reduced. Thus, recent debate has focused on whether heterogeneity is inherent to PSCs, or whether it is simply a function of the microenvironment of the stem cell under particular conditions of growth in vitro (MacArthur and Lemischka, 2013; Smith, 2013).
We have previously shown that human ESC cultures maintained in serum-supplemented medium on feeder cell layer support consist of a hierarchy of cells defined by a continuum of levels of expression of stem cell surface antigens and pluripotency-specific genes (Laslett et al., 2007). Heterogeneity and lineage priming are most meaningfully evaluated at the single-cell level. Examination of the expression of a small panel of pluripotency and lineage-specific genes at the single-cell level provided evidence for heterogeneity in pluripotency gene expression, and for lineage priming in the stem cell population (Hough et al., 2009). Here, we extend this quantitative analysis of gene expression at the single-cell level to a much larger panel of genes, using more sensitive assays, and relate it to key biological features of ESCs. We further compare heterogeneity of human ESC cultures under different growth conditions. The results show that the capacity for self-renewal lies in a restricted subset of cells marked by expression of a key set of genes associated with cell-cell interactions. Using a selective combination of cell surface markers, we describe the prospective isolation of a minority cell population with high levels of self-renewal, high and uniform levels of expression of pluripotency-associated genes, and no lineage priming, features of the naive state.
Results
Heterogeneity in Single-Cell Gene Expression in Human ESC Cultures Defines Cellular Subpopulations
Colonies of human ESCs grown on a mouse embryo fibroblast feeder cell layer in the presence of fetal-calf-serum-supplemented medium (FCS condition) show a gradient of stem cell surface antigen expression (Laslett et al., 2007), with the highest antigen expression found in cells on the outer perimeter. This gradient of stem cell surface antigen expression allows fractionation of the population by flow cytometry into subsets of cells using the monoclonal antibodies GCTM-2 (which recognizes a large pericellular matrix proteoglycan that bears the TRA-1-60 antigen) and TG30 (anti-CD9). The subset of cells expressing the highest levels of GCTM-2 and CD9 could be further fractionated with antibodies to EPCAM (Figure 1A). To characterize these cell subpopulations at the single-cell level, the flow-sorted cells were subjected to single-cell gene expression analysis by quantitative RT-PCR (qRT-PCR) using the Fluidigm microfluidics system, which enables parallel medium throughput analysis in nanoliter volume wells. The panel of genes that we studied encodes growth factors, receptors, and transcription factors involved in the maintenance of pluripotency, as well as transcription factors that mediate early specification into somatic and extraembryonic lineages (Table S1 available online). Some genes were included in the panel on the basis of our prior work that indicated they were strongly expressed in the high population.
Figure 1.
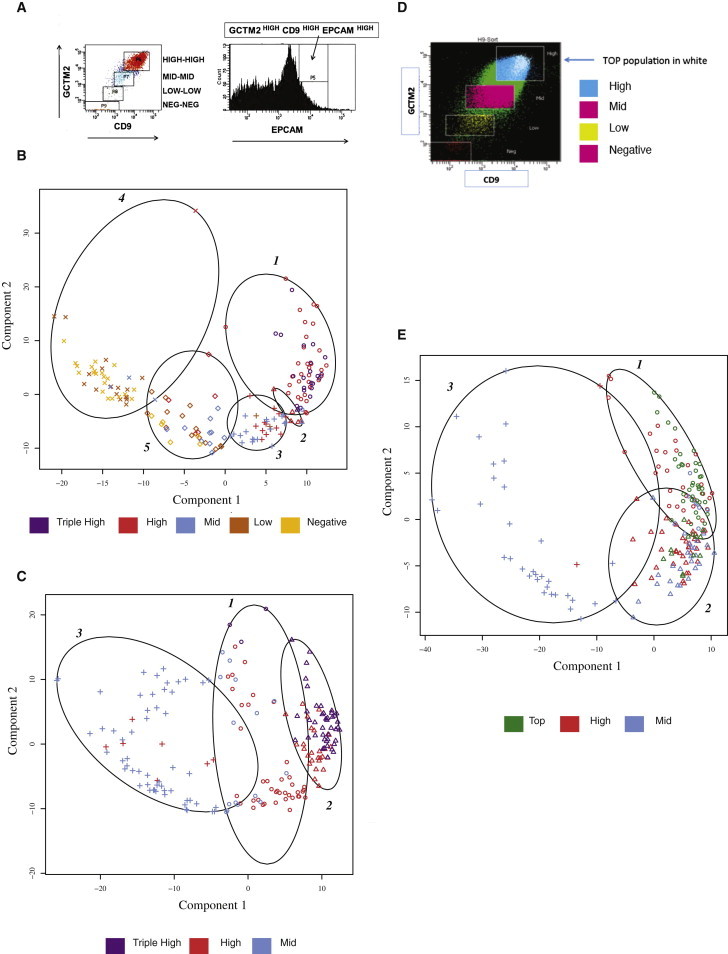
Cluster Analysis of Single-Cell Gene Expression Analysis of Subpopulations of Human ESCs Grown in Three Cell-Culture Conditions and Isolated by Fluorescence-Activated Cell Sorting
ESCs maintained under conditions that support self-renewal were harvested and fractionated into the indicated cell subpopulations by flow cytometry. Single-cell gene expression analysis was carried out using qRT-PCR.
(A) Subpopulations of human ESCs fractionated by fluorescence-activated cell sorting (FACS) according to an expression gradient of GCTM2 and CD9 (double stain) or GCTM2, CD9, and EPCAM (triple stain). For the double stain, cells were gated into four fractions (GCTM2/CD9 high, mid, low, and negative), and, for the triple stain, gates were set to isolate the GCTM2/CD9/EPCAM triple-high population.
(B, C, and E) Fuzzy cluster analysis of single-cell gene expression of human ESC subpopulations.
(B) Fuzzy cluster analysis of cells grown in FCS condition and separated according to cell surface marker expression as in (A).
(C) Fuzzy cluster analysis of single-cell gene expression of human ESC populations grown in KSR/FGF2 condition. Flow cytometry was carried out as indicated in (A) and (B) but only triple-high, high, and mid subpopulations were analyzed.
(D) Isolation of the top subpopulation of cells grown in mTeSR condition. Cells were sorted as shown in Figure 1A to obtain high and mid populations, and then cells in the highest first percentile for GCTM-2, CD9, and EPCAM staining were isolated.
(E) Fuzzy cluster analysis of single-cell gene expression of human ESC populations grown in mTeSR condition. Flow cytometry was carried out as indicated in (A) and (D) but only top, high, and mid subpopulations were analyzed.
In (B), (C), and (E), each symbol is a single cell with flow cytometry subpopulations indicated by color and cluster membership by symbol shape. See also Figure S1 and Tables S1 and S3.
As we have previously shown, a continuous hierarchy of cell surface marker expression across the population was paralleled by a continuum of gene expression. Nevertheless, fuzzy clustering showed that expression levels of this panel of genes could indeed distinguish the cell populations identified by flow cytometry, with the GCTM-2HIGHCD9HIGHEPCAMHIGH (triple high) and GCTM-2HIGHCD9HIGH (high) populations clustering out from the GCTM-2MIDCD9MID (mid), GCTM-2LOWCD9LOW (low), and GCTM-2NEGATIVECD9NEGATIVE (negative) populations. Figure 1B displays this analysis for cells grown in FCS conditions. The majority of the triple-high and high populations fell into clusters 1 and 2, most of the mid population fell into clusters 3 and 5, and the low and negative cells were found mainly in cluster 4.
Previously, we showed that human ESCs grown in media supplemented with FGF-2 and/or activin showed a much higher proportion of cells in the high compartment defined by flow cytometry than cultures grown in serum (Hough et al., 2009). Therefore, we assessed patterns of gene expression at the single-cell level in cultures grown in serum replacement and FGF2 with feeder cell support (KSR/FGF condition). Because these culture conditions result in a shift of the population into triple-high, high, and mid sectors, compared to cells grown in serum, we analyzed only these subgroups at the single-cell level (Figure 1C), though the methodology for cell sorting was identical. Cells in the triple-high and high fractions segregated predominantly into clusters 1 and 2, whereas most cells in the mid population lay in cluster 3.
Poorly defined factors, elaborated by feeder cells or contained in FBS or KSR, can contribute to extracellular signaling and can drive lineage specification in addition to promoting self-renewal. To assess whether stem cell heterogeneity persists under defined conditions of cell culture, we examined cells grown in mTeSR, a defined media supplemented with fibroblast growth factor (FGF)-2 and transforming growth factor (TGF)B1 (mTeSR condition). Although this medium is particularly effective in supporting self-renewal and suppressing differentiation, a considerable degree of heterogeneity was still present in the mTeSR cultures. Thus, flow cytometry analysis, carried out as described for the high and mid populations grown in FCS and KSR/FGF, revealed a spread in cell surface antigen expression in ESCs in mTeSR (Figure 1D).
To refine further our definition of cells at the top of the hierarchy grown in mTeSR conditions, we separated another cell population, those cells in the top 1% of GCTM-2, CD9, and EPCAM surface fluorescence (top population, Figure 1D). Cluster analysis of gene expression for cells grown in mTeSR conditions is shown in Figure 1E. Cell clusters 1 in this analysis contained most of the top and high population, whereas cluster 3 contained the majority of the mid population.
Expression of Intercellular Signaling Molecules Identifies a Subpopulation with Consistently High Expression of Pluripotency-Associated Genes and No Lineage Priming
Hierarchical cluster analysis also defined subsets of stem cells on the basis of gene expression and identified different gene expression patterns across the subpopulations. Data for cells grown in the mTeSR conditions are shown in Figure 2. Cell cluster C contained most of the top fraction, whereas cell clusters A and B contained most cells in the mid fraction. Genes in cluster 1, which includes the canonical pluripotency-associated genes POU5F1, SOX2, and NANOG, were expressed across the subpopulations. Genes in cluster 3 distinguished the top and high populations from the mid cells, and genes in cluster 2 distinguished the top population from the others. Similar analysis of cells grown in FCS and KSR/FGF2 conditions showed that a common set of genes distinguished top, triple-high, and high cells from mid cells in all growth conditions. These genes encoded a specific set of proteins involved in intercellular signaling (ACVR1B, GDF3, NODAL, LEFTY, CER1, TDGF1, ERBB3, EPHA1, CDH3, HAS3, CD9, EPCAM, LCK). Some cells grown in mTeSR also expressed lineage-specific genes, such as GATA4, DKK1, and MIXL1.
Figure 2.
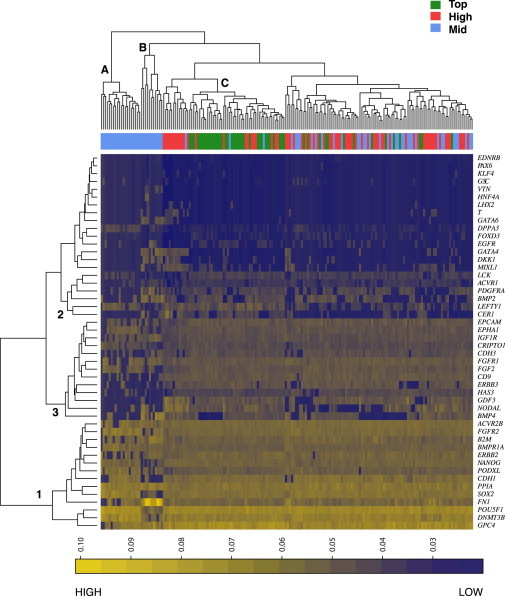
Hierarchical Cluster Analysis of Single-Cell Gene Expression Analysis of Human ESC Subpopulations Grown in mTeSR and Isolated by FACS
Cells grown in mTeSR condition were separated and analyzed as in 1 but analyzed by hierarchical clustering. Color scale bar depicts 1/CT values as in Figure 1. Cell clusters referred to in text are identified by letters, and gene clusters are identified by numbers. See also Table S1.
In a previous study (Mar et al., 2011), we identified variance in gene expression between groups as a significant parameter of the dynamics of cellular phenotype. Interestingly, genes with high variance between groups (disease versus control in our previous work) most often tended to encode proteins involved in intercellular signaling.
To assess variance in the expression of genes across our subpopulations, we depicted single-cell gene expression data in the form of violin plots, which display the proportion of cells expressing specific levels of genes in a subpopulation. We separated out three sets of genes (based on the cluster analysis above), which proved particularly informative in our comparison of the cellular subpopulations: a set of genes that includes canonical pluripotency factors and established stem cell surface markers, a set of genes that are predominantly involved in intercellular signaling and were differentially expressed across subsets of cells, and a set of genes associated with early lineage specification.
The results are displayed in Figure 3. Transcripts for canonical pluripotency genes OCT4, SOX2, and NANOG, along with some well-established cell surface markers used to identify human PSCs were found in the majority of cells, though levels declined in the low and negative subpopulations grown in FCS. The top, triple-high, or high populations, maintained in FBS, KSR/FGF, or mTeSR, expressed higher and more consistent levels of the genes in the signaling category than mid, low, or negative populations. Lineage-specific genes were expressed at significant levels in several populations, including triple-high cells maintained in KSR/FGF, double-high and mid populations in KSR/FGF or mTeSR, or low and negative populations maintained in FCS.
Figure 3.
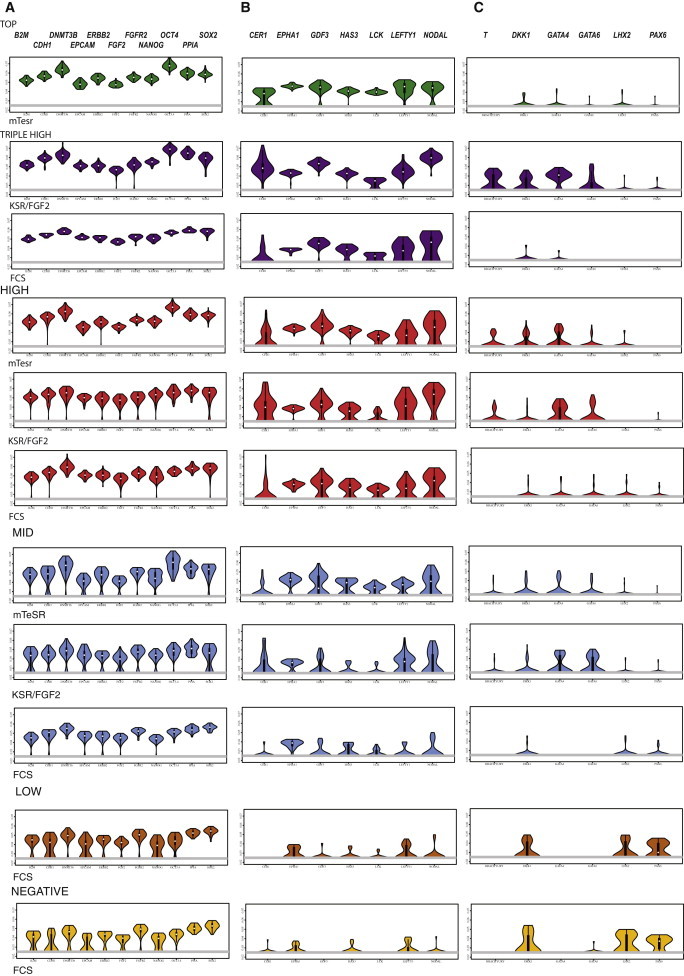
Violin Plots Showing Frequency of Cells Expressing Specific Levels of Three Classes of Gene from the Single-Cell Analyses Depicted in Figures 1 and 2
Column A, canonical pluripotency-associated genes and stem cell markers; column B, intercellular signaling molecules expressed primarily in top, triple-high, and high subpopulations; column C, lineage-specific genes. Plots for top, triple-high, high, mid, low, and negative subpopulations are shown from top to bottom, and growth conditions are indicated underneath each set of plots. Values on the y axis of each individual plot are 1/CT.; the width of each symbol indicates the frequency of cells at a given level of expression. See also Table S1.
The top population, isolated from cultures grown in mTeSR, showed the most homogeneous pattern of gene expression, with uniformly high levels of canonical pluripotency and signaling factors and little or no expression of lineage-specific factors. Thus, the variance of gene expression and lineage priming in this population was minimal compared to the other cell types. Triple-high cells isolated from cultures grown in FCS or KSR/FGF also showed limited variance in expression of canonical pluripotency genes; however, this fraction grown in KSR/FGF showed significant expression of lineage-specific genes, and triple-high cells grown in FCS showed variable expression of the signaling related genes.
Heterogeneity in Expression of Signaling Molecules at the Protein Level and Their Regulation
We evaluated the expression of some of the signaling proteins specific to the top, triple-high, and high populations using immunofluorescence staining on colonies in situ. Figure S1 illustrates immunostaining (Table S2) and quantitative image analysis for a number of antigens discussed above for cultures grown in FCS. Similar patterns are seen for cells grown in KSR/FGF and mTeSR though the gradations are less pronounced. The GCTM-2 antigens, EPCAM and POU5F1, were expressed in a graded fashion throughout the colony with highest levels at the edge. By contrast, GDF3, the downstream nodal/activin effector phospho-SMAD2/3, BMP mediators phospho-SMAD1/5/8, CDH3, and BMP2/4, were detected mainly at the rim of the colony.
The signaling molecules that marked the top, triple-high, and high subsets are involved in diverse pathways. Many are constituents of the TGF beta superfamily of ligands and receptors (NODAL, ACVR1B, GDF3, LEFTY1, and CER1, TDGF1). LCK is known predominantly for its role in T cell receptor signaling (Alarcón and van Santen, 2010). HAS3 encodes an enzyme responsible for the biosynthesis of hyaluronic acid, an extracellular matrix component of the embryonic environment suggested to enhance human ESC maintenance (Choudhary et al., 2007). CDH3, CD9, and EPCAM are cell substrate or cell adhesion molecules. ERBB3 is a component of NRG1 signaling, which has been previously implicated in stem cell maintenance (Wang et al., 2007).
To assess what might account for downregulation of these genes in cells that still express canonical pluripotency factors, we performed in silico analysis of transcription factor binding sites in their putative regulatory regions (Table 1). Many of the genes contained binding sites for NANOG and its associated cohesin complex protein RAD21 (Gao et al., 2013). A few genes also contained binding sites for POU5F1. In addition to these pluripotency-associated genes and some general transcription factors, we also found binding sites for TCF12, BCL11A, and USF1 in a number of the genes. TCF12 binds SMAD2/3 targets in a NODAL-dependent fashion in human ESCs (Yoon et al., 2011). The roles of BCL11A or USF1 in stem cell maintenance are unknown.
Table 1.
Chromatin Immunoprecipitation Sequencing Data Showing Transcription Factor Binding Sites in Regulatory Regions of Intercellular Signaling Genes Selectively Expressed in Top, Triple-High, or High Cell Subpopulations, Based on ENCODE Peak Calls in H1 ESC ±10 kb of UCSC Transcript Models Using hg19 Assembly
| NANOG | RAD21 | POU5F1 | BCL11A | TCF12 | USF1 | |
|---|---|---|---|---|---|---|
| NODAL | +a | +a | +a | − | +,a,b +a | − |
| CER | +a,b | − | − | +a,b | +a,b | − |
| GDF3c | +a | +,a +a | +a,b | +a,b | − | − |
| ACVRIB | +a,b | +a | − | − | − | − |
| LEFTY1d | +,a,b +a | +a | +,a +a | +a,b | +a,b | +a,b |
| TDGF1e | +,a,b +a,b | − | − | − | +,a,b +a,b | − |
| CD9 | +a,b | +a,b | +a,b | − | +a,b | +a |
| ERBB3 | − | +,a,b +a | − | − | +a,b | +a,b |
| EPCAM | +a,b | − | − | − | +,a,b +a,b | − |
| EPHA1 | − | +,a,b +a,b | − | − | − | − |
| HAS3 | +,a,b +a,b | +,a,b +a,b | − | − | − | +,a,b +a,b |
| CDH3 | − | +a | − | − | − | +a,b |
| LCK | +a,b | +a,b | − | − | +a,b | − |
Multiple entries indicate more than one binding site in the regulatory region.
DNAase-hypersensitive site.
H3K27Ac.
NANOG site in distal regulatory region (Levasseur et al., 2008).
Approximately −20 kb relative to start of transcription.
TDGF1 is included because of its role as a coreceptor for GDF3 and NODAL.
Self-Renewal Capacity Is Highest in Cells at the Top of the Hierarchy
We sought to relate single-cell gene expression patterns in these cellular subsets to their biological features. The interpretation of biological assays with hESC sorted in the flow cytometer has been complicated by the very low levels of survival observed following dissociation and sorting. However, the combined use of mTeSR with fibroblast feeder layer support allowed levels of colony efficiency 10- to 20-fold higher than those in our previous studies, even after flow cytometry. The results of colony forming studies on cells grown in mTeSR are shown in Figure 4A. The top population showed the highest level of self-renewal in this assay (around 5%), with high cells somewhat lower, and the mid population 5-fold less. Thus, the capacity of cells for self-renewal declines markedly as cells move out of the compartments at the top of the hierarchy, even under optimal culture conditions for self-renewal.
Figure 4.
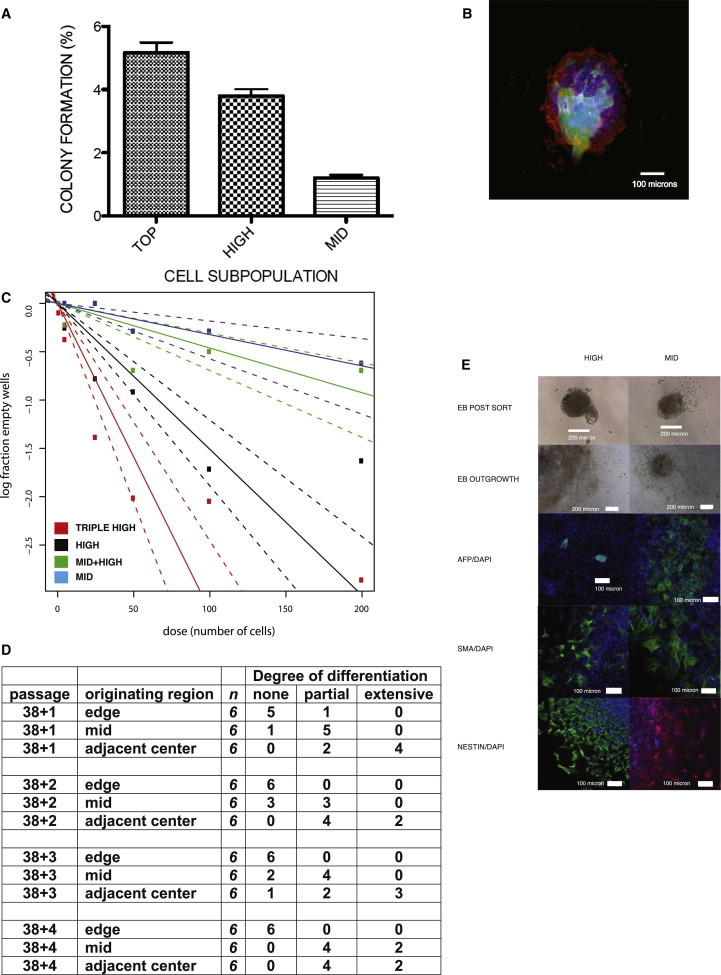
Self-Renewal and Differentiation Capacity of Subpopulations of ESCs
(A) Colony forming ability of top, high, and mid subpopulations of ESCs grown in mTeSR. Cell subpopulations were isolated as shown in Figure 3A and then plated onto a feeder cell layer of mouse embryo fibroblasts. Colonies of greater than 32 cells were counted 10–14 days later. Differences between three biological replicates of top and high, and top and high or mid, are statistically significant (two paired sample t test p < 0.01; bars show SEM)
(B and C) Reaggregation assay for colony forming ability of subpopulations of ESCs grown in KRS/FGF. (B) shows a representative colony formed from a mixture of 1,000 HES3 wild-type high and five Envy-GFP high cells 5 days following reaggregation and replating. Red, stem cell marker GCTM-2, green, GFP; blue, DAPI nuclear stain. (C) shows limiting dilution analysis of colony forming ability of subpopulations of ESCs. y axis, log10 of the percentage of wells without a GFP-positive colony; x axis, number of GFP cells inoculated. Red, triple-high population; black, high; blue, mid; green, combination of limiting dilution of ENVY-labeled mid cells with wild-type cells. Reaggregates were generated using a constant number of HES3 cells combined with decreasing numbers of input ENVY cells. Values are mean ± SE.
(D) Alternative assay for self-renewal based on localization of high, mid, and low subpopulations to edge, middle, and center of ESC colonies grown in FCS conditions. Small clusters of cells from the edge, middle, or adjacent center regions of human ESC colonies were serially passaged, and the degree of differentiation was assessed.
(E) Pluripotency is not limited to self-renewing compartment of human ESC cultures. FACS-isolated high and mid cells grown in FCS were similarly able to form embryoid bodies following reaggregation and to generate outgrowths that stained positive for the primary germ layer markers endoderm (AFP), mesoderm (α SMA), and ectoderm (nestin). Ten to 12 embryoid bodies from each subpopulation were stained with similar results.
We took two approaches to assess self-renewal of the subpopulations under conditions that do not adversely affect survival. First, we designed an assay for self-renewal that reconstitutes cell-cell interactions and enables levels of survival 50-fold higher than conventional colony assays. We based this assay on reaggregation protocols originally designed to promote single-cell survival in embryoid bodies (Ng et al., 2005). In these experiments, we analyzed cultures grown in KSR/FGF. We carried out limiting dilution analysis, combining 1,000 wild-type cells from either the high or mid fractions with limiting numbers of GFP-labeled ENVY (Costa et al., 2005) cells from triple-high, high, or mid populations. Following flow cytometry, the unlabeled and labeled cells were reaggregated for 24 hr and replated onto a fibroblast feeder cell layer, and colonies were stained for DAPI and the stem cell marker GCTM-2 (Figure 4B). Reaggregation resulted in levels of survival far higher than in single-cell plating experiments for cells grown in KSR/FGF (∼5% without cell sorting compared to 0.1%–0.5% for single-cell plating (Chan et al., 2008; Hasegawa et al., 2006; Hough et al., 2009; Kolle et al., 2009; Rampalli and Bhatia, 2012).
The results of the reaggregation/limiting dilution analysis on subpopulations reflected those of the single-cell cloning experiments described above, carried out in mTeSR medium (Figure 4C). Cells in the triple-high or high fractions had much higher levels of self-renewal that those in the mid population. Following reaggregation with wild-type double-high cells, the colony forming efficiency of the triple-high population (about 3%) approached that seen in mTeSR, whereas that of the mid population was only about 0.3%–0.5%.
Cocultivation of mid population GFP cells in limiting dilution with wild-type high cells resulted in a higher colony forming efficiency than that seen when the GFP-labeled mid cells were combined with unlabeled mid cells, suggesting that cell-cell interactions support self-renewal.
In a second series of studies, we took an alternate approach of dissecting small clusters of ∼100 cells from discrete regions of ESC colonies (edge, middle, and center), corresponding to areas with high, mid, and low to negative surface staining for stem cell antigens, replating these clusters onto fibroblast feeder cell layers, and subjecting the resulting colonies to serial cultivation over the course of four passages. In contrast to results with single-cell assays, clusters of cells from all colony regions were able to reinitiate colonies in the first passage. However, as predicted by the flow cytometry/reaggregation assay, only cell clusters from the edge of the colony were able to continuously generate new stem cell colonies robustly. Cell clusters from the center or middle underwent extensive differentiation (Figures 4D and S2).
Pluripotency Is a Property of a Larger Subset of Cells
We next asked which cells in the population displayed pluripotency. Following flow cytometry, cells in the high and mid populations were reaggregated and placed into an embryoid body outgrowth assay. Two weeks later, the outgrowths were fixed and examined by immunofluorescence. Cells from either the high or mid fraction formed embryoid bodies containing representatives of all three germ layers with equal efficiency (Figure 4E). These results indicate that pluripotency, as defined by embryoid body formation, persists in the mid population, although its potential for self-renewal is much less than that of the triple-high and high populations. These results were reinforced by quantitative gene expression studies (Figure 5D, below).
Figure 5.
Lineage Primed Subpopulations of Human ESCs
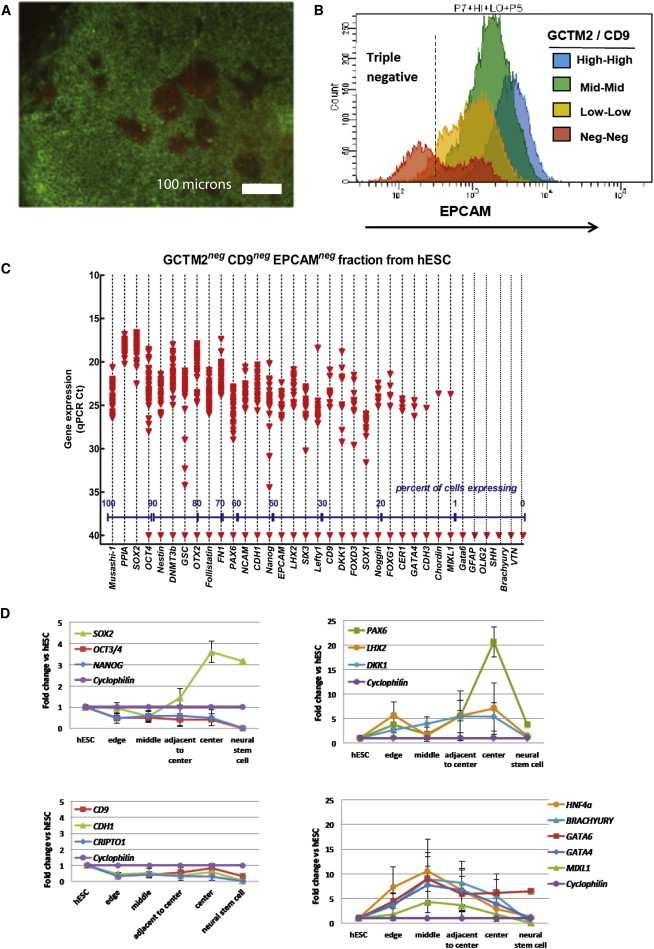
Cells grown in serum and undergoing priming for neural specification were isolated on the basis of immunostaining (A–C) or position in the colony, and their gene expression was analyzed by single-cell qRT-PCR or in embryoid body differentiation assays (D).
(A and B) Expression of EPCAM and PAX6 proteins. (A) Immunocytochemical localization of EPCAM (green) and PAX6 (red) in HES3 colonies cultured in FBS. Clusters of PAX6-positive EPCAM-negative cells are localized near the center region of the colony. (B) Distribution of EPCAM staining in HES3 cells across each of four GCTM2/CD9 populations as determined by FACS. The triple-negative cells (GCTM2, CD9, EPCAM negative) were collected for analysis of gene expression by single-cell qPCR.
(C) Density dot plot of single-cell gene expression from the triple-negative population of hESC isolated by FACS. Expression values are given as qPCR cycle threshold (Ct), with 15 being high expression and a cutoff of 28 Ct assigned as the lowest level of reliably detectable expression (red dashed line). Ct values of 40 indicate no amplification detected within 40 qPCR cycles. Each data point represents a single-gene/cell qPCR. The percentages of single cells expressing a given gene within each population (based on a cutoff of 28 Ct) are provided along the x axis.
(D) Gene expression in aggregate suspension cultures of small ESCs clumps from the edge, middle, adjacent to center, and center regions of colonies grown in FCS. y axis shows the fold change relative to undifferentiated ESCs; values for neural stem cells are shown for comparison. Aggregates from edge or middle region show multilineage capacity whereas cells from adjacent center or center show high levels of PAX6 and LHX2 transcripts. Values are mean ± SE of three biological replicates.
See also Figures S2–S5 and Tables S2 and S3.
Lineage Primed Subpopulations
The data from cluster analyses suggested the existence of significant subpopulations of lineage-primed progenitors, specifically cells coexpressing either neural or extraembryonic endoderm lineage genes along with pluripotency genes. For example, a subset of high and mid cells grown in mTeSR expressed GATA4, GATA6, HNF4A, BMP2, and MIXL1 (Figure 3).
Immunostaining revealed the presence of cell populations that were negative for the cell surface marker EPCAM, but positive for the early neural determinant PAX6, toward the central zone of colonies maintained in FCS (Figure 5A). By sorting cells that were low or triple negative for GCTM-2, CD9, and EpCAM, we were able to enrich this cell population and examine its gene expression at the single-cell level (Figures 5B and 5C). In these experiments, we used a different panel of markers that included some pluripotency-associated markers along with a number of genes characteristic of early neural lineages (Table S3). These cells uniformly coexpressed pluripotency-associated genes including SOX2, POU5F1, and DNMT3B along with neural genes OTX2, PAX6, NESTIN MUSHASHI, and NCAM. Few if any cells expressed genes characteristic of the mesodermal or endodermal lineages. This population expressed inhibitors of the BMP and Wnt pathways, including DKK1, NOGGIN, and FSTN. Because it proved particularly difficult to recover these cells in a viable state after flow cytometry, to investigate their differentiation potential, we isolated small clusters of cells from the edge, middle, adjacent center, and center of ESC colonies and then transferred them to neural progenitor medium. The cells from the center region formed neurospheres containing progenitor cells that were capable of differentiation into neurons (Figure S3). Gene expression studies of cells isolated from discrete colony regions and transferred to suspension culture confirmed that cells from the center of the colony were biased toward neural differentiation, whereas cells from the edge or middle of the colony expressed mesodermal or endodermal markers (Figure 5D).
In cultures maintained in KSR/FGF, stem cell colonies were often surrounded by flattened epithelial cells that could be readily isolated under phase contrast microscopy. Immunofluorescence microscopy using markers of extraembryonic endoderm and pluripotency show that some of these markers are coexpressed at the protein level (Figure S4). When these cells were manually isolated and assayed for single-cell gene expression, they showed coexpression of canonical stem cell markers with markers of the endoderm lineage, including GATA4, GATA6, HNF4A, BMP2, BMP4, and MIXL1 (Figure S5). Notably, these cells also strongly expressed CER, LEFTY1, and NODAL, along with FN1.
Discussion
Many recent studies have documented heterogeneity of gene expression and lineage priming within PSC populations. One interpretation of these findings is that heterogeneity is an inherent feature of the pluripotent state. This is a feasible hypothesis, because pluripotent cells exist only within a transient time window of mammalian embryonic development, during which they are poised to undergo specification first toward extraembryonic, then embryonic cell lineages. Mammalian development is plastic and highly regulative, and pathways that affect ESC specification in vitro can regulate the size of the pluripotent cell population in vivo (Morris et al., 2012), suggesting that the pluripotent population in vivo can readily undergo state transitions. However, for a restricted point in development in vivo, or under specific conditions in vitro, pluripotent cells with prototypic patterns of gene expression may exist locked into a pure state. Single-cell analysis revealed that individual epiblast cells of the 64 cell stage mouse embryo expressed predominantly pluripotency genes only, in contrast to cells at the 16 and 32 cell stages, which coexpressed pluripotency genes along with genes of the extraembryonic lineages (Guo et al., 2010). Recent evidence suggests that mouse ESCs maintained under conditions that maximize self-renewal are far more homogenous in gene expression and epigenetic status than cells maintained under conditions that are permissive for spontaneous differentiation (Marks et al., 2012).
Our data on hESCs indeed confirm that heterogeneity is certainly a function of stem cell microenvironment. Cells maintained in FCS show heterogeneity in expression of pluripotency genes and exist in a continuum between a primordial self-renewing cell population and cells that are primed toward neural differentiation. By contrast, the majority of the cells maintained in KSR/FGF and feeder layers are in the high and mid cell compartments, as are those grown in MTeSR. Nonetheless, a significant subset of cells grown in these conditions showed priming toward the endodermal lineage. That the cells expressing HNF4a, GATA6, and GATA4 most likely represent precursors of extraembryonic endoderm rather than definitive endoderm is suggested by their coexpression of LEFTY1, MIXL1, and CER1 along with pluripotency genes including CD9 (Cheng et al., 2012; Perea-Gomez et al., 2002). It is clear from our work and from many other published studies that human ESCs can undergo differentiation into cells resembling primitive endoderm (Darr and Benvenisty, 2009; Feng et al., 2012; Hyslop et al., 2005; Pera et al., 2004; Séguin et al., 2008; Sumi et al., 2007; Takayama et al., 2011). Recent studies have identified cells of the primitive endoderm lineage in the human conceptus (O’Leary et al., 2012; Yan et al., 2013). O’Leary et al. (2012) showed that the expression of GATA-4 and GATA-6 in the inner cell mass and epiblast followed the temporal patterns seen during mouse hypoblast development. Yan et al. (2013) performed RNA sequencing (RNA-seq) on single cells from late human blastocysts and classified cells as epiblast, primitive endoderm, and trophectoderm. This study showed considerable overlap in gene expression between epiblast and primitive endoderm but not trophoblast. In line with our results, GATA-4, GATA-6, HNF4A, NODAL, LEFTY, GDF3, and TDGF1 were all expressed in epiblast and primitive endoderm, which also expressed KRT8 at high levels. These findings strongly suggest that the lineage priming we have observed is a feature of normal human development and are in line conceptually with the results of Canham et al. (2010), who identified two subpopulations of mouse ESCs, one predisposed to extraembryonic differentiation, the other to somatic fates.
Our studies show that only a subpopulation of hESCs at the top of the hierarchy possesses an extensive capacity for self-renewal. Polanco et al. recently showed that cells in this compartment could reestablish the continuum of cell states seen in unfractionated cultures (Polanco et al., 2013). Using a combination of three cell surface markers, we isolated a minority hESC population with a high capacity for self-renewal, uniformly high expression of pluripotency-associated gene transcripts, and no expression of lineage-specific genes. These are features of what has been termed naive pluripotency. The widely accepted concept that human ESCs grown under conventional culture systems exist in a primed state is based on studies of the properties of a heterogeneous population. Our studies reveal the existence within that population of a subset of cells with at least some properties of naive pluripotency. The relationship of the cells we isolated to those recently described by Gafni et al. (2013) or Chan et al. (2013) remains to be determined.
A much broader proportion of cells in the hierarchy retain pluripotency. These findings suggest that self-renewal and pluripotency may be independently regulated. Previously, Stewart et al. (2006) showed that SSEA-3-positive cells in hESC cultures showed a higher cloning efficiency than SSEA-3-negative cells, though both populations could form teratomas. In both mouse and human, examination of stem cell lines derived from germ cell tumors shows that the capacity for self-renewal and the expression of a pluripotent phenotype at the molecular level can be clearly dissociated from biological pluripotency. Nullipotent stem cell lines, incapable of differentiation and locked into continuous self-renewal, resemble pluripotent stem cell lines in other aspects of their phenotype.
The self-renewing compartment that we have defined may be inherently unstable. Cells in this compartment are distinguished from the rest by their expression of a particular subset of genes encoding intercellular signaling molecules that includes ligands and receptors of the TGF-beta signaling pathway. These data suggest, as indicated by earlier studies (Peerani et al., 2007), that the decision to self-renew may be governed to a significant degree by the interplay of NODAL and BMP signaling. In human ESCs, SMAD2/3 signaling lies upstream of the pluripotency network and regulates NANOG (Vallier et al., 2009; Xu et al., 2008). It is of interest that many genes we identified as specific to the top, triple-high, or high populations contain NANOG binding sites. Singh et al. (2012) have shown that activation of PI3 kinase is critical to suppression of somatic cell differentiation that can be induced by activin, Erk, and Wnt signals. Under our conditions of serum-free culture, FGF-2 along with insulin could function to suppress somatic differentiation, whereas Nodal/activin and ERBB2/ERBB3 signaling might be essential to retain cells in the self-renewing compartment. It is significant that cells in the top compartment express not only high levels of factors that drive self-renewal but also factors that antagonize it, including BMP2, BMP4, and LEFTY1. Many of these genes also contain NANOG binding sites in their regulatory regions, and, because NANOG is also downstream of SMAD2/3 signaling (Xu et al., 2008), reciprocal NANOG regulation of the TGFB family members could constitute a feedback loop that could be destabilized rapidly if ligands became limiting. The presence of binding sites for TCF12, a SMAD2/3/4 cofactor whose target binding is also NODAL dependent, in several of these genes further suggests an unstable feedback regulatory mechanism for self-renewal.
Our results indicate that heterogeneity may be inherent to a pluripotent cell that is poised to undergo specification into extraembryonic or somatic lineages. Even if self-renewal is driven strongly, and differentiation suppressed, by epigenetic or genetic factors, PSCs may only be able to exit the pluripotent compartment through a continuum of intermediate states, in which lineage priming is a prominent feature, rather than undertaking a quantum transition to a new cell state. Our results also indicate that it may be difficult to define naive or primed states of pluripotency on the basis of population data alone.
Experimental Procedures
Experimental procedures for culture and differentiation of human embryonic stem cells and neural progenitor cells, induction of pluripotency, indirect immunofluorescence microscopy, flow cytometry, and gene expression, image analysis, and statistical analysis followed minor modifications to established protocols and are described in the Supplemental Experimental Procedures.
Reaggregation Limiting Dilution Assays
For reaggregation assays, HES3 and ENVY cells in KSR/FGF culture were treated with blebbistatin, dissociated, and stained with GCTM2 and TG30, followed by secondary labeling with Alexa Fluor 647 goat anti-mouse immunoglobulin (Ig) M (A21238) and goat anti-mouse IgG2a-PE (P21139, Life Technologies), respectively. Mouse feeder cells were gated out using anti-mouse Thy1.2 PE-Cy7 (25-0902 eBioscience). HES3 and ENVY cells were sorted into four populations based on the level of GCTM2 and TG30 staining (negative, low, mid, high) as described in the Supplemental Experimental Procedures. Gated populations were sorted directly into low-binding PCR tubes (Axygen 321-02-501) containing 125 μl KSR culture media with blebbistatin (10 μM) and FGF-2 (10 ng/ml). To generate a limiting dilution series, a constant number of HES3 cells from the GCTM2 TG30 high or mid population was combined in each tube with decreasing numbers of ENVY input cells also from the high or mid populations. All four combinations were tested (HES3 high: ENVY high, HES3 high: ENVY mid, HES3 mid: ENVY high, HES3 mid: ENVY mid, as well as ENVY triple-high HES3 high). Following sorting, PCR tubes containing cells were centrifuged at 190 × g for 3 min to induce aggregation. Small holes were punched in the tops of the PCR tubes using an 18 gauge needle to allow for gas exchange, and the tubes were returned to a humidified 5% CO2, 37°C incubator for 24 hr. Individual reaggregates were then transferred from each PCR tube using a wide bore pipette tip and placed into single wells of a 24-well plate containing irradiated mouse embryo fibroblasts (density of 15,000 cells/cm2) in KSR/FGF. After 48 hr, the medium was changed daily for 3 days.
Resulting colonies were washed with PBS and fixed with 2% paraformaldehyde for 30 min at room temperature prior to staining with GCTM2 for 1 hr at room temperature. Cells were washed with PBS and secondary antibody (Alexa Fluor 594 goat anti-mouse IgM, 1:1000, Life Technologies 21044) was applied for 1 hr at room temp. Cells were washed with PBS and nuclei counterstained with Hoechst 33342 prior to imaging.
In Silico Transcription Factor Binding Analysis
Transcription factor binding was assessed for individual genes using the ENCODE chromatin immunoprecipitation sequencing peak calls in H1 ESC ±10 kb of UCSC transcript models, using hg19 assembly. A peak was considered to be evidence of transcription factor binding when coincident and overlapping with two additional ENCODE chromatin marks, DNase hypersensitivity, and H3K27Ac.
Acknowledgments
Work in the M.P. lab was supported by the California Institute of Regenerative Medicine (Basic Biology Grant RB1-01372 and New Cell Lines Grant RL1-00667-1), the Human Science Frontiers Program (RGP0001/2012), and the Australian Research Council (Special Research Initiative in Stem Cell Sciences). We thank the USC Stem Cell and Flow Cytometry Core Facilities at the Eli and Edythe Broad Center for Regenerative Medicine and Stem Cell Research, the Flow Cytometry Core of the Melbourne Brain Centre and the Genomics Core Facility at the USC Norris Comprehensive Cancer Center for provision of technical services and support.
Footnotes
This is an open access article under the CC BY-NC-ND license (http://creativecommons.org/licenses/by-nc-nd/3.0/).
Supplemental Information
References
- Alarcón B., van Santen H.M. Two receptors, two kinases, and T cell lineage determination. Sci. Signal. 2010;3:pe11. doi: 10.1126/scisignal.3114pe11. [DOI] [PubMed] [Google Scholar]
- Brons I.G., Smithers L.E., Trotter M.W., Rugg-Gunn P., Sun B., Chuva de Sousa Lopes S.M., Howlett S.K., Clarkson A., Ahrlund-Richter L., Pedersen R.A., Vallier L. Derivation of pluripotent epiblast stem cells from mammalian embryos. Nature. 2007;448:191–195. doi: 10.1038/nature05950. [DOI] [PubMed] [Google Scholar]
- Canham M.A., Sharov A.A., Ko M.S., Brickman J.M. Functional heterogeneity of embryonic stem cells revealed through translational amplification of an early endodermal transcript. PLoS Biol. 2010;8:e1000379. doi: 10.1371/journal.pbio.1000379. [DOI] [PMC free article] [PubMed] [Google Scholar]
- Chan E.M., Yates F., Boyer L.F., Schlaeger T.M., Daley G.Q. Enhanced plating efficiency of trypsin-adapted human embryonic stem cells is reversible and independent of trisomy 12/17. Cloning Stem Cells. 2008;10:107–118. doi: 10.1089/clo.2007.0064. [DOI] [PubMed] [Google Scholar]
- Chan Y.S., Göke J., Ng J.H., Lu X., Gonzales K.A., Tan C.P., Tng W.Q., Hong Z.Z., Lim Y.S., Ng H.H. Induction of a human pluripotent state with distinct regulatory circuitry that resembles preimplantation epiblast. Cell Stem Cell. 2013;13:663–675. doi: 10.1016/j.stem.2013.11.015. [DOI] [PubMed] [Google Scholar]
- Cheng X., Ying L., Lu L., Galvão A.M., Mills J.A., Lin H.C., Kotton D.N., Shen S.S., Nostro M.C., Choi J.K. Self-renewing endodermal progenitor lines generated from human pluripotent stem cells. Cell Stem Cell. 2012;10:371–384. doi: 10.1016/j.stem.2012.02.024. [DOI] [PMC free article] [PubMed] [Google Scholar]
- Choudhary M., Zhang X., Stojkovic P., Hyslop L., Anyfantis G., Herbert M., Murdoch A.P., Stojkovic M., Lako M. Putative role of hyaluronan and its related genes, HAS2 and RHAMM, in human early preimplantation embryogenesis and embryonic stem cell characterization. Stem Cells. 2007;25:3045–3057. doi: 10.1634/stemcells.2007-0296. [DOI] [PubMed] [Google Scholar]
- Costa M., Dottori M., Ng E., Hawes S.M., Sourris K., Jamshidi P., Pera M.F., Elefanty A.G., Stanley E.G. The hESC line Envy expresses high levels of GFP in all differentiated progeny. Nat. Methods. 2005;2:259–260. doi: 10.1038/nmeth748. [DOI] [PubMed] [Google Scholar]
- Darr H., Benvenisty N. Genetic analysis of the role of the reprogramming gene LIN-28 in human embryonic stem cells. Stem Cells. 2009;27:352–362. doi: 10.1634/stemcells.2008-0720. [DOI] [PubMed] [Google Scholar]
- Enver T., Pera M., Peterson C., Andrews P.W. Stem cell states, fates, and the rules of attraction. Cell Stem Cell. 2009;4:387–397. doi: 10.1016/j.stem.2009.04.011. [DOI] [PubMed] [Google Scholar]
- Feng X., Zhang J., Smuga-Otto K., Tian S., Yu J., Stewart R., Thomson J.A. Protein kinase C mediated extraembryonic endoderm differentiation of human embryonic stem cells. Stem Cells. 2012;30:461–470. doi: 10.1002/stem.1018. [DOI] [PMC free article] [PubMed] [Google Scholar]
- Gafni O., Weinberger L., Mansour A.A., Manor Y.S., Chomsky E., Ben-Yosef D., Kalma Y., Viukov S., Maza I., Zviran A. Derivation of novel human ground state naive pluripotent stem cells. Nature. 2013;504:282–286. doi: 10.1038/nature12745. [DOI] [PubMed] [Google Scholar]
- Gao F., Wei Z., An W., Wang K., Lu W. The interactomes of POU5F1 and SOX2 enhancers in human embryonic stem cells. Sci. Rep. 2013;3:1588. doi: 10.1038/srep01588. [DOI] [PMC free article] [PubMed] [Google Scholar]
- Guo G., Huss M., Tong G.Q., Wang C., Li Sun L., Clarke N.D., Robson P. Resolution of cell fate decisions revealed by single-cell gene expression analysis from zygote to blastocyst. Dev. Cell. 2010;18:675–685. doi: 10.1016/j.devcel.2010.02.012. [DOI] [PubMed] [Google Scholar]
- Hasegawa K., Fujioka T., Nakamura Y., Nakatsuji N., Suemori H. A method for the selection of human embryonic stem cell sublines with high replating efficiency after single-cell dissociation. Stem Cells. 2006;24:2649–2660. doi: 10.1634/stemcells.2005-0657. [DOI] [PubMed] [Google Scholar]
- Hough S.R., Laslett A.L., Grimmond S.B., Kolle G., Pera M.F. A continuum of cell states spans pluripotency and lineage commitment in human embryonic stem cells. PLoS ONE. 2009;4:e7708. doi: 10.1371/journal.pone.0007708. [DOI] [PMC free article] [PubMed] [Google Scholar]
- Huang Y., Osorno R., Tsakiridis A., Wilson V. In vivo differentiation potential of epiblast stem cells revealed by chimeric embryo formation. Cell Rep. 2012;2:1571–1578. doi: 10.1016/j.celrep.2012.10.022. [DOI] [PubMed] [Google Scholar]
- Hyslop L., Stojkovic M., Armstrong L., Walter T., Stojkovic P., Przyborski S., Herbert M., Murdoch A., Strachan T., Lako M. Downregulation of NANOG induces differentiation of human embryonic stem cells to extraembryonic lineages. Stem Cells. 2005;23:1035–1043. doi: 10.1634/stemcells.2005-0080. [DOI] [PubMed] [Google Scholar]
- Kolle G., Ho M., Zhou Q., Chy H.S., Krishnan K., Cloonan N., Bertoncello I., Laslett A.L., Grimmond S.M. Identification of human embryonic stem cell surface markers by combined membrane-polysome translation state array analysis and immunotranscriptional profiling. Stem Cells. 2009;27:2446–2456. doi: 10.1002/stem.182. [DOI] [PubMed] [Google Scholar]
- Laslett A.L., Grimmond S., Gardiner B., Stamp L., Lin A., Hawes S.M., Wormald S., Nikolic-Paterson D., Haylock D., Pera M.F. Transcriptional analysis of early lineage commitment in human embryonic stem cells. BMC Dev. Biol. 2007;7:12. doi: 10.1186/1471-213X-7-12. [DOI] [PMC free article] [PubMed] [Google Scholar]
- Levasseur D.N., Wang J., Dorschner M.O., Stamatoyannopoulos J.A., Orkin S.H. Oct4 dependence of chromatin structure within the extended Nanog locus in ES cells. Genes Dev. 2008;22:575–580. doi: 10.1101/gad.1606308. [DOI] [PMC free article] [PubMed] [Google Scholar]
- MacArthur B.D., Lemischka I.R. Statistical mechanics of pluripotency. Cell. 2013;154:484–489. doi: 10.1016/j.cell.2013.07.024. [DOI] [PubMed] [Google Scholar]
- Mar J.C., Matigian N.A., Mackay-Sim A., Mellick G.D., Sue C.M., Silburn P.A., McGrath J.J., Quackenbush J., Wells C.A. Variance of gene expression identifies altered network constraints in neurological disease. PLoS Genet. 2011;7:e1002207. doi: 10.1371/journal.pgen.1002207. [DOI] [PMC free article] [PubMed] [Google Scholar]
- Marks H., Kalkan T., Menafra R., Denissov S., Jones K., Hofemeister H., Nichols J., Kranz A., Stewart A.F., Smith A., Stunnenberg H.G. The transcriptional and epigenomic foundations of ground state pluripotency. Cell. 2012;149:590–604. doi: 10.1016/j.cell.2012.03.026. [DOI] [PMC free article] [PubMed] [Google Scholar]
- Martinez Arias A., Brickman J.M. Gene expression heterogeneities in embryonic stem cell populations: origin and function. Curr. Opin. Cell Biol. 2011;23:650–656. doi: 10.1016/j.ceb.2011.09.007. [DOI] [PubMed] [Google Scholar]
- Morris S.A., Guo Y., Zernicka-Goetz M. Developmental plasticity is bound by pluripotency and the Fgf and Wnt signaling pathways. Cell Rep. 2012;2:756–765. doi: 10.1016/j.celrep.2012.08.029. [DOI] [PMC free article] [PubMed] [Google Scholar]
- Ng E.S., Davis R.P., Azzola L., Stanley E.G., Elefanty A.G. Forced aggregation of defined numbers of human embryonic stem cells into embryoid bodies fosters robust, reproducible hematopoietic differentiation. Blood. 2005;106:1601–1603. doi: 10.1182/blood-2005-03-0987. [DOI] [PubMed] [Google Scholar]
- Nichols J., Smith A. Naive and primed pluripotent states. Cell Stem Cell. 2009;4:487–492. doi: 10.1016/j.stem.2009.05.015. [DOI] [PubMed] [Google Scholar]
- Nichols J., Smith A. Pluripotency in the embryo and in culture. Cold Spring Harb. Perspect. Biol. 2012;4:a008128. doi: 10.1101/cshperspect.a008128. [DOI] [PMC free article] [PubMed] [Google Scholar]
- O’Leary T., Heindryckx B., Lierman S., van Bruggen D., Goeman J.J., Vandewoestyne M., Deforce D., de Sousa Lopes S.M., De Sutter P. Tracking the progression of the human inner cell mass during embryonic stem cell derivation. Nat. Biotechnol. 2012;30:278–282. doi: 10.1038/nbt.2135. [DOI] [PubMed] [Google Scholar]
- Peerani R., Rao B.M., Bauwens C., Yin T., Wood G.A., Nagy A., Kumacheva E., Zandstra P.W. Niche-mediated control of human embryonic stem cell self-renewal and differentiation. EMBO J. 2007;26:4744–4755. doi: 10.1038/sj.emboj.7601896. [DOI] [PMC free article] [PubMed] [Google Scholar]
- Pera M.F., Reubinoff B., Trounson A. Human embryonic stem cells. J. Cell Sci. 2000;113:5–10. doi: 10.1242/jcs.113.1.5. [DOI] [PubMed] [Google Scholar]
- Pera M.F., Andrade J., Houssami S., Reubinoff B., Trounson A., Stanley E.G., Ward-van Oostwaard D., Mummery C. Regulation of human embryonic stem cell differentiation by BMP-2 and its antagonist noggin. J. Cell Sci. 2004;117:1269–1280. doi: 10.1242/jcs.00970. [DOI] [PubMed] [Google Scholar]
- Perea-Gomez A., Vella F.D., Shawlot W., Oulad-Abdelghani M., Chazaud C., Meno C., Pfister V., Chen L., Robertson E., Hamada H. Nodal antagonists in the anterior visceral endoderm prevent the formation of multiple primitive streaks. Dev. Cell. 2002;3:745–756. doi: 10.1016/s1534-5807(02)00321-0. [DOI] [PubMed] [Google Scholar]
- Polanco J.C., Ho M.S., Wang B., Zhou Q., Wolvetang E., Mason E., Wells C.A., Kolle G., Grimmond S.M., Bertoncello I. Identification of unsafe human induced pluripotent stem cell lines using a robust surrogate assay for pluripotency. Stem Cells. 2013;31:1498–1510. doi: 10.1002/stem.1425. [DOI] [PubMed] [Google Scholar]
- Rampalli S., Bhatia M. Human pluripotency: a difficult state to make smart choices. Cell Cycle. 2012;11:2411–2412. doi: 10.4161/cc.20801. [DOI] [PMC free article] [PubMed] [Google Scholar]
- Séguin C.A., Draper J.S., Nagy A., Rossant J. Establishment of endoderm progenitors by SOX transcription factor expression in human embryonic stem cells. Cell Stem Cell. 2008;3:182–195. doi: 10.1016/j.stem.2008.06.018. [DOI] [PubMed] [Google Scholar]
- Singh A.M., Reynolds D., Cliff T., Ohtsuka S., Mattheyses A.L., Sun Y., Menendez L., Kulik M., Dalton S. Signaling network crosstalk in human pluripotent cells: a Smad2/3-regulated switch that controls the balance between self-renewal and differentiation. Cell Stem Cell. 2012;10:312–326. doi: 10.1016/j.stem.2012.01.014. [DOI] [PMC free article] [PubMed] [Google Scholar]
- Smith A. Nanog heterogeneity: tilting at windmills? Cell Stem Cell. 2013;13:6–7. doi: 10.1016/j.stem.2013.06.016. [DOI] [PMC free article] [PubMed] [Google Scholar]
- Stewart M.H., Bossé M., Chadwick K., Menendez P., Bendall S.C., Bhatia M. Clonal isolation of hESCs reveals heterogeneity within the pluripotent stem cell compartment. Nat. Methods. 2006;3:807–815. doi: 10.1038/nmeth939. [DOI] [PubMed] [Google Scholar]
- Sumi T., Tsuneyoshi N., Nakatsuji N., Suemori H. Apoptosis and differentiation of human embryonic stem cells induced by sustained activation of c-Myc. Oncogene. 2007;26:5564–5576. doi: 10.1038/sj.onc.1210353. [DOI] [PubMed] [Google Scholar]
- Takayama K., Inamura M., Kawabata K., Tashiro K., Katayama K., Sakurai F., Hayakawa T., Furue M.K., Mizuguchi H. Efficient and directive generation of two distinct endoderm lineages from human ESCs and iPSCs by differentiation stage-specific SOX17 transduction. PLoS ONE. 2011;6:e21780. doi: 10.1371/journal.pone.0021780. [DOI] [PMC free article] [PubMed] [Google Scholar]
- Tesar P.J., Chenoweth J.G., Brook F.A., Davies T.J., Evans E.P., Mack D.L., Gardner R.L., McKay R.D. New cell lines from mouse epiblast share defining features with human embryonic stem cells. Nature. 2007;448:196–199. doi: 10.1038/nature05972. [DOI] [PubMed] [Google Scholar]
- Vallier L., Mendjan S., Brown S., Chng Z., Teo A., Smithers L.E., Trotter M.W., Cho C.H., Martinez A., Rugg-Gunn P. Activin/Nodal signalling maintains pluripotency by controlling Nanog expression. Development. 2009;136:1339–1349. doi: 10.1242/dev.033951. [DOI] [PMC free article] [PubMed] [Google Scholar]
- Wang L., Schulz T.C., Sherrer E.S., Dauphin D.S., Shin S., Nelson A.M., Ware C.B., Zhan M., Song C.Z., Chen X. Self-renewal of human embryonic stem cells requires insulin-like growth factor-1 receptor and ERBB2 receptor signaling. Blood. 2007;110:4111–4119. doi: 10.1182/blood-2007-03-082586. [DOI] [PMC free article] [PubMed] [Google Scholar]
- Xu R.H., Sampsell-Barron T.L., Gu F., Root S., Peck R.M., Pan G., Yu J., Antosiewicz-Bourget J., Tian S., Stewart R., Thomson J.A. NANOG is a direct target of TGFbeta/activin-mediated SMAD signaling in human ESCs. Cell Stem Cell. 2008;3:196–206. doi: 10.1016/j.stem.2008.07.001. [DOI] [PMC free article] [PubMed] [Google Scholar]
- Yan L., Yang M., Guo H., Yang L., Wu J., Li R., Liu P., Lian Y., Zheng X., Yan J. Single-cell RNA-Seq profiling of human preimplantation embryos and embryonic stem cells. Nat. Struct. Mol. Biol. 2013;20:1131–1139. doi: 10.1038/nsmb.2660. [DOI] [PubMed] [Google Scholar]
- Ying Q.L., Wray J., Nichols J., Batlle-Morera L., Doble B., Woodgett J., Cohen P., Smith A. The ground state of embryonic stem cell self-renewal. Nature. 2008;453:519–523. doi: 10.1038/nature06968. [DOI] [PMC free article] [PubMed] [Google Scholar]
- Yoon S.-J., Wills A.E., Chuong E., Gupta R., Baker J.C. HEB and E2A function as SMAD/FOXH1 cofactors. Genes Dev. 2011;25:1654–1661. doi: 10.1101/gad.16800511. [DOI] [PMC free article] [PubMed] [Google Scholar]
Associated Data
This section collects any data citations, data availability statements, or supplementary materials included in this article.