

Summary
Perturbations in stem cell activity and differentiation can lead to developmental defects and cancer. We use an approach involving a quantitative model of cell-state transitions in vitro to gain insights into how SLUG/SNAI2, a key developmental transcription factor, modulates mammary epithelial stem cell activity and differentiation in vivo. In the absence of SLUG, stem cells fail to transition into basal progenitor cells, while existing basal progenitor cells undergo luminal differentiation; together, these changes result in abnormal mammary architecture and defects in tissue function. Furthermore, we show that in the absence of SLUG, mammary stem cell activity necessary for tissue regeneration and cancer initiation is lost. Mechanistically, SLUG regulates differentiation and cellular plasticity by recruiting the chromatin modifier lysine-specific demethylase 1 (LSD1) to promoters of lineage-specific genes to repress transcription. Together, these results demonstrate that SLUG plays a dual role in repressing luminal epithelial differentiation while unlocking stem cell transitions necessary for tumorigenesis.
Highlights
-
•
SLUG promotes stem cell-state transitions necessary for tumorigenesis
-
•
Loss of SLUG in mice leads to luminal differentiation of basal/myoepithelial cells
-
•
In vitro quantitative modeling can accurately predict epithelial plasticity in vivo
-
•
A SLUG/LSD1 complex epigenetically regulates mammary epithelial cell differentiation
Perturbations in stem cell activity and differentiation can lead to developmental defects and cancer. Here, Kuperwasser, Gupta, and colleagues show that the transcription factor SLUG plays a dual role in repressing luminal epithelial differentiation while unlocking stem cell transitions necessary for tissue regeneration and tumorigenesis.
Introduction
In renewable tissues such as the hematopoietic system, skin, and intestine, multipotent stem cells serve as a reservoir of cells that are called upon to maintain tissue homeostasis and function (Blanpain and Fuchs, 2006; Tesori et al., 2013; Toma et al., 2001; Barker et al., 2008; Weissman, 2000). These stem cells have been implicated as precursors to cancer, presumably due to their long-term persistence and high self-renewing capabilities (Barker et al., 2009; Bonnet and Dick, 1997). However, in other tissues such as the mammary gland, lineage-restricted progenitor cells, as opposed to multipotent stem cells, are responsible for tissue maintenance and homeostasis (Van Keymeulen et al., 2011). When called upon for tissue regeneration, as is the case upon transplantation or injury, these lineage-committed progenitor cells unlock primitive stem cell programs that are not normally required for tissue development or tissue homeostasis (Blanpain et al., 2004; Doupé et al., 2012; Kordon and Smith, 1998; Shackleton et al., 2006; Stingl et al., 2006; van Amerongen et al., 2012; Van Keymeulen et al., 2011). By doing so, these cells acquire properties that make them amenable to cancer initiation (Pacheco-Pinedo et al., 2011; Proia et al., 2011; Schwitalla et al., 2013; Youssef et al., 2010, 2012). However, the molecular mechanism by which committed progenitor cells access latent stem cell programs is not well understood.
Previously, we showed that the transcription factor SLUG is an important regulator of mammary epithelial lineage commitment and differentiation (Proia et al., 2011). Recent studies have also shown that SLUG is necessary for the mammary stem cell state (Guo et al., 2012). However, SLUG-deficient mice develop mammary glands, and transplantation of tissue fragments from these mice were able to fully regenerate functional mammary glands; this suggests that SLUG might be dispensable for stem cell activity (Nassour et al., 2012). Thus, the precise role of SLUG in mammary stem and progenitor cell dynamics remains unclear.
The ability to study stem cell-state transitions and progenitor cell dynamics in vivo is challenging; even when cell-state markers are available, most transitions are short-lived and difficult to capture. We sought to gain insights into how SLUG controls stem cell activity in normal disease-free mammary epithelial cells by using a recently developed and validated quantitative model to predict cell-state transition rates in vitro (Gupta et al., 2011). Using this approach, we were able to (1) infer differences in cell-state transition probabilities between wild-type (WT) and SLUG-deficient mammary epithelial cell populations, (2) accurately predict the in vivo phenotype associated with SLUG deficiency, and (3) provide insights into how SLUG inhibition influences progenitor cell dynamics to ultimately disrupt cellular differentiation as well as tissue homeostasis, regeneration, and tumor initiation.
Results
SLUG Inhibits Differentiation of Breast Epithelial Cells
SLUG could be regulating stem cell activity by preventing proliferation, by inhibiting differentiation, or by affecting cell-state transitions between stem cells and lineage-committed cells. To begin to distinguish between these possibilities, we used lentiviral-mediated short hairpin RNA to knockdown SLUG in human basal progenitor cell lines: human telomerase reverse transcriptase (hTERT) immortalized mammary epithelial cells (HMECs) derived from two different patient samples and the spontaneously immortalized MCF10A breast epithelial cell line (Figure 1A). In agreement with our previous findings (Proia et al., 2011), SLUG-inhibited (shSlug) HMECs adopted a tightly packed cobblestone-like appearance compared to control cells (shControl), consistent with a more differentiated epithelial cell phenotype (Figure S1A available online).
Figure 1.
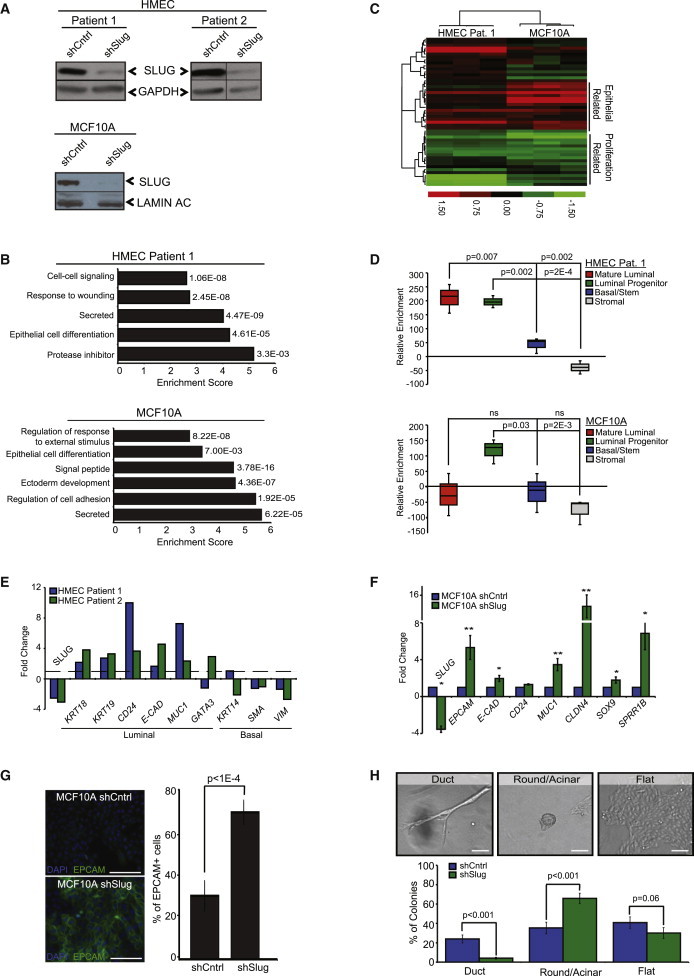
SLUG Inhibits Differentiation of Breast Epithelial Cells
(A) Western blot analysis of SLUG expression in shControl and shSlug HMECs and MCF10A cells.
(B) Gene Ontology biological process categories upregulated following SLUG inhibition in mammary epithelial cells: HMECs (patient 1) and MCF10A cells. The DAVID Functional Annotation Tool (Huang da et al., 2009) was used to identify categories with an enrichment score >2; the enrichment score and p value of genes differentially expressed in the microarray are shown.
(C) Hierarchical clustering heatmap of shSlug HMEC (patient 1) and shSlug MCF10A cells compared to shControl cells (n = 3 for each cell line) using the 50-gene set of the PAM50 breast cancer intrinsic subtype predictor. No gene centering was performed.
(D) Relative enrichment of mature luminal, luminal progenitor, basal/stem, and stromal signatures (defined by Lim et al., 2009) in shSlug HMEC (patient 1) and MCF10A cells compared to shControl cells.
(E) Relative mRNA expression levels (normalized to GAPDH) of luminal and basal markers in two different patient-derived HMEC lines following SLUG inhibition. Genes differentially expressed in the shSlug cells compared to the control cells (dashed line) are plotted.
(F) Quantitative real-time PCR analysis of luminal marker expression (normalized to GAPDH) in MCF10A cells following SLUG inhibition. Genes differentially expressed in shSlug cells compared to shControl cells are plotted. Bars represent the fold change ± SD of three independent experiments, and p values were calculated by Student’s two-tailed t test. ∗p < 0.05, ∗∗p < 0.005.
(G) Immunofluorescent staining for the luminal marker EPCAM in MCF10A shControl and shSlug cells. Representative images are shown and quantification is depicted in the graph below. Data represent the mean ± SEM of three independent experiments, and p values were calculated by Student’s two-tailed t test. Scale bars represent 100 μm.
(H) Phase-contrast images of MCF10A cells grown in 3D culture. Quantification of the percentage of round, ductal, and flat colonies formed by shControl and shSlug MCF10A cells. Data represent the mean ± SD of three independent experiments, and p values were calculated by Student’s two-tailed t test.
See also Figure S1.
To more comprehensively define the phenotype associated with SLUG inhibition in mammary progenitor cells, we performed global gene expression analysis on shControl and shSlug HMEC and MCF10A cells (Supplemental Experimental Procedures). Gene Ontology (GO) analysis revealed significant enrichment of genes involved in epithelial cell differentiation, ectoderm development, secretion, and the regulation of cell adhesion in SLUG-inhibited HMECs and MCF10A cells (Figure 1B). To further assess breast epithelial differentiation, microarray data were analyzed using the recently described Genomic Differentiation Predictor (Prat et al., 2010) and the 50 genes of the PAM50 breast cancer intrinsic subtype predictor (Parker et al., 2009). As predicted, SLUG inhibition led to significant changes in the expression of epithelial-related genes in both HMECs and MCF10A cells (Figure 1C; Figure S1B). Notably, there was increased expression of luminal genes (e.g., FOXA1, BAG1, and NAT1) and decreased expression of proliferation genes (e.g., MKI67, CDC6, and CDCA1) in both cell lines (Figure 1C; Gene Expression Omnibus [GEO] accession number GSE54735). Furthermore, when probed for signatures of lineage-specific mammary epithelial subpopulations (Lim et al., 2009), SLUG inhibition resulted in a significant enrichment in the luminal progenitor signature in both cell lines, while HMECs also displayed a significant enrichment in the mature luminal profile (Figure 1D). Transcriptional analysis using quantitative RT-PCR further confirmed the strong induction of luminal differentiation genes, with a concomitant decrease in the expression of genes associated with basal/stem differentiation following SLUG knockdown (Figures 1E and 1F). Consistent with these data, immunofluorescence analysis for the luminal marker EPCAM revealed a significant increase in its expression upon SLUG knockdown in MCF10A cells (Figure 1G).
Differentiation and morphogenesis of control and shSlug MCF10A cells was also evaluated using a 3D collagen/Matrigel assay. In these 3D cultures, luminal progenitor cells primarily differentiate into round alveolar colonies while basal progenitor cells form distinct flat colonies and branching ductal colonies (Keller et al., 2012). As expected, SLUG inhibition led to a significant increase in the formation of round alveolar colonies and a significant decrease in the number of flat and ductal structures following growth on collagen (Figure 1H). Together, these data fortify SLUG as a critical repressor of breast epithelial differentiation.
Modeling the Effect of SLUG on Cell-State Transition Rates
While the above findings clearly highlight SLUG’s influence on inhibiting mammary epithelial cell (MEC) differentiation, they do not divulge the dynamic cellular mechanisms that may be affecting cell-state transitions between stem cells and lineage-committed cells. To begin to address this, we examined breast epithelial cell-state proportions by fluorescence-activated cell sorting following SLUG inhibition. In cultured cells, luminal cells display EPCAM+ and CD24+ immunophenotypes, while basal cells exhibit EPCAM−/CD49f+ and CD24−/CD49f+ immunophenotypes (Eirew et al., 2008; Keller et al., 2010, 2012; Lim et al., 2009). Consistent with the gene expression data, SLUG inhibition resulted in increased proportions of CD24+ and EPCAM+ luminal cells and concomitant decreased proportions of CD24−/CD49f+ and EPCAM−/CD49f+ basal/progenitor cells (Figure 2A; Figures S2A–S2E).
Figure 2.
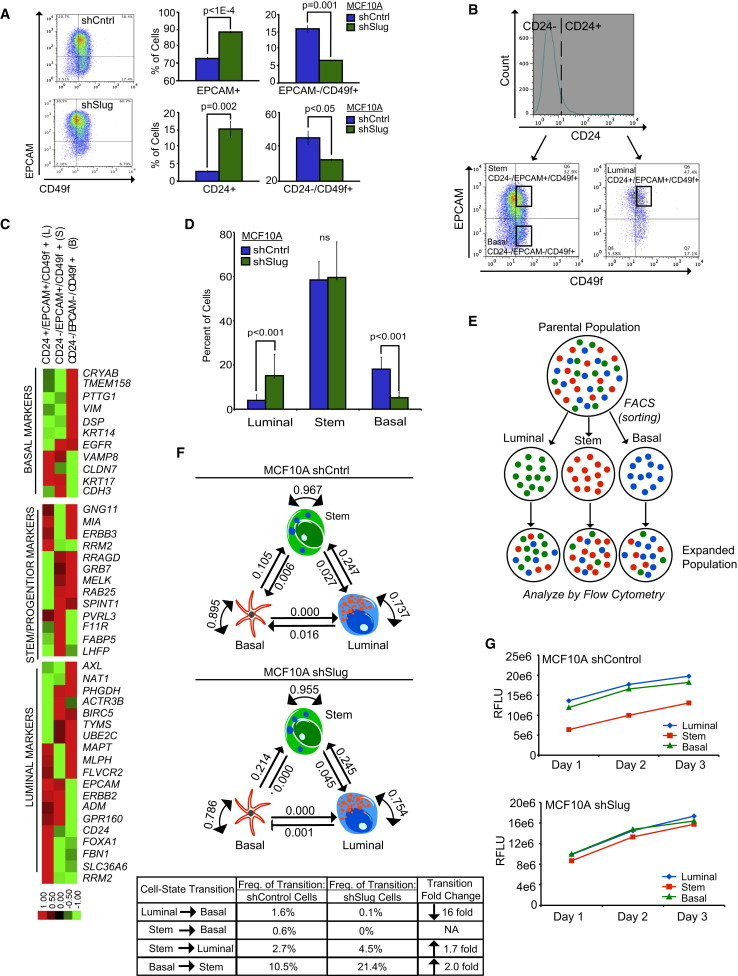
Loss of SLUG Alters Stochastic Cell-State Interconversions
(A) Flow cytometry analysis of luminal (EPCAM and CD24) and basal (CD49f) cell-surface markers in shControl (n = 3) and shSlug (n = 3) MCF10A cells. Representative dot plots for EPCAM versus CD49f expression are shown. Data represent the mean ± SD, and p values were calculated by Student’s two-tailed t test.
(B) Flow cytometry gating strategy for isolating luminal (CD24+/EPCAM+/CD49f+), stem (CD24−/EPCAM+/CD49f+), and basal (CD24−/EPCAM−/CD49f+) subpopulations from a heterogeneous parental MCF10A population.
(C) Expression of various differentiation-related genes in luminal, basal and stem subpopulations of MCF10A cells using the nCounter platform (Nanostring Technologies) (Geiss et al., 2008). The heatmap displays selected genes that showed the greatest differential expression across the three cell states. Data presented have been gene median centered.
(D) Flow cytometry analysis showing the proportion of cells in the luminal, basal, and stem states in MCF10A shSlug and shControl parental populations immediately prior to sorting. Data represent the mean ± SD of six independent experiments, and p values were calculated by Student’s two-tailed t test.
(E) Schematic of the experimental procedure used to calculate cell-state transition probabilities in MCF10A shSlug and shControl cells.
(F) Predicted cell-state transition probabilities for shControl and shSlug MCF10A cells. The table below summarizes the frequency of cell-state transitions in shControl and shSlug cells. Each transition’s fold change following SLUG inhibition is also displayed; only transitions that changed >1.5-fold following SLUG inhibition are shown. NA, not applicable.
(G) In vitro proliferation curves of purified subpopulations (luminal, stem, and basal) of MCF10A shControl and shSlug cells. RFLU, relative fluorescent light unit.
See also Figure S2.
To provide dynamic insights into how SLUG deficiency impacts these cell-state shifts, we employed a quantitative Markov model that has recently been used to study the dynamics of cell-state proportions in human breast cancer cell lines (Gupta et al., 2011). With this model, data generated from short-term in vitro studies can be used to deduce the probability of cellular transitions between any two phenotypic (e.g., differentiation) states. The model can also be used to predict how genetic perturbations affect cell-state interconversion rates; this allows us to infer, on a dynamic level, how changes in gene function disrupt cellular equilibrium.
We characterized the three main mammary epithelial cell states isolated from MCF10A cells (Keller et al., 2010): luminal (L) (CD24+/EPCAM+/CD49f+), basal (B) (CD24−/EPCAM−/CD49f+), and stem (S) (CD24−/EPCAM+/CD49f+) (Figure 2B). As expected, expression analysis of 105 selected genes that define different cell-differentiation states confirmed that this sorting technique successfully isolates populations of cells in each of the indicated cell-differentiation states (Figure 2C). In addition, the shSlug cells exhibited a higher percentage of cells in the luminal state (shControl = 4% versus shSlug = 15%) and a lower percentage of cells in the basal state (shControl = 23% versus shSlug = 7%), with no appreciable change in the stem state (shControl = 73% versus shSlug = 78%) compared to the control population (Figure 2D).
Based on these findings, L, B, and S sorted subpopulations were allowed to expand in culture for 4 days, at which time the proportion of cells in the luminal, basal, and stem states were reanalyzed by flow cytometry (Figure 2E). For each sorted subpopulation, there was an evident shift in cell-state proportions, suggesting that cells were interconverting between states (Figure 2F). In fact, SLUG inhibition reduced the plasticity of cell transitions into the basal state (L→B reduced 16-fold, S→B no longer present). In contrast, SLUG inhibition increased the plasticity of cell transitions from the stem state into the luminal state (S→L increases 1.7-fold) and from the basal state into the stem state (B→S increases 2-fold; Figure 2F). Because the S→B transitions were eliminated in shSlug cells, the increased proportion of luminal cells was effectively due to increased S→L transitions. Given that proliferation rates did not vary between the luminal, basal, and stem states of either parental line (Figure 2G), we could be confident that the observed transitions were not a consequence of differential growth rates inherent to each differentiation state, but rather were due to changes in cellular plasticity. Collectively, these findings, along with those above, reveal that SLUG inhibition affects cellular differentiation in addition to cellular plasticity, predominantly by altering transitions arising from stem and basal cells; together, these changes result in an unexpected accumulation of luminal epithelial cells.
Loss of SLUG Promotes Aberrant Differentiation and Mammary Progenitor Cell-State Transitions In Vivo
To determine if the above in vitro predictions of SLUG deficiency are observed in vivo, we examined the mammary glands of 16-week-old Snai2LacZ/LacZ mice; at this age, steady-state homeostasis of luminal and basal progenitor cells is well established. In these mice, the zinc-finger region of the Slug gene has been replaced by a β-galactosidase gene, resulting in the production of a SLUG-β-galactosidase fusion protein. The SLUG portion of this protein is nonfunctional, as it lacks the zinc-finger region; thus, mice homozygous for the Snai2LacZ/LacZ allele are functional SLUG knockout mice (Jiang et al., 1998; Parent et al., 2004).
Consistent with the increased proportions of luminal cells observed in vitro, Snai2LacZ/LacZ mammary glands exhibited a significant increase in the percentage of CD24hi/CD49f−/lo and EPCAMhi/CD49f−/lo luminal cells compared to WT controls (Figures 3Ai and 3B). This increase in luminal cells by flow cytometry manifested histologically as the formation of abnormal hyperplastic terminal ductal units, with intraductal micropapillary and solid growth patterns (Figures 3D and 3Ei). Notably, luminal cells, which were both Ki67 and estrogen receptor-α (ER-α) positive, accumulated within the lumens of Snai2LacZ/LacZ glands, consistent with a luminal progenitor state (Figures 3Eii and 3Eiii).
Figure 3.
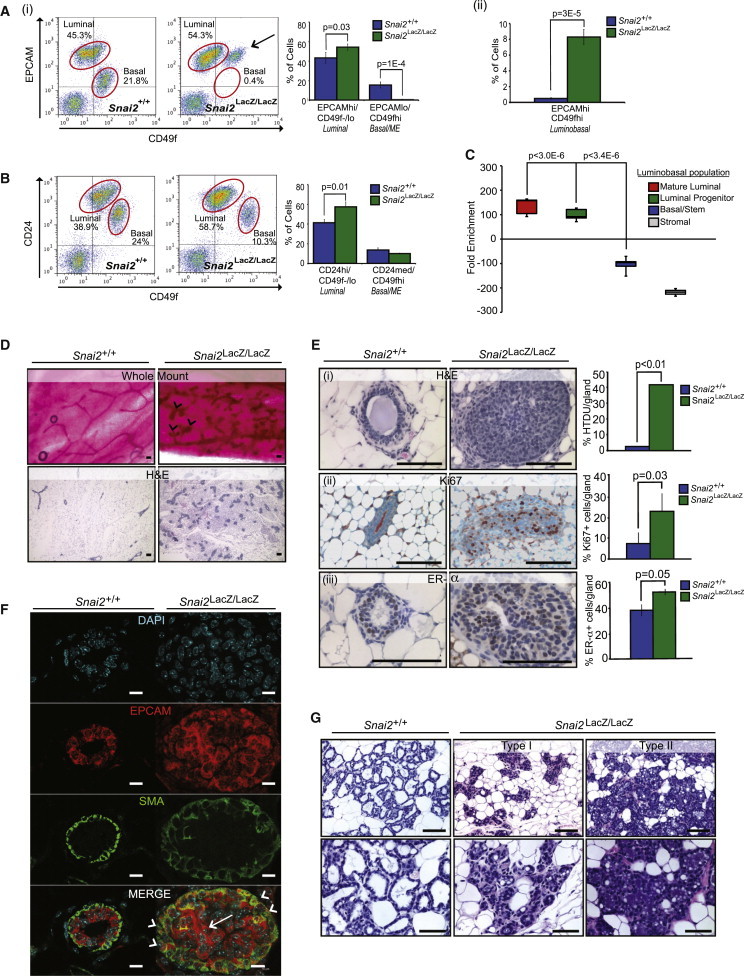
SLUG Loss Promotes Aberrant Differentiation and Compromises Normal Tissue Function In Vivo
(A and B) Flow cytometry analysis of luminal (CD24hi/CD49f−/lo and EpCAMhi/CD49f−/lo), basal/myoepithelial (ME) (CD24med/CD49fhi and EPCAMlo/CD49fhi), and luminobasal (EPCAMhi/CD49fhi) MEC populations from 16-week nulliparous Snai2+/+ and Snai2LacZ/LacZ mammary glands. Representative dot plots from a Snai2+/+ and Snai2LacZ/LacZ mouse are shown. Luminal and basal/ME populations are circled in red. Arrow points to the luminobasal population. Bar charts represent the percent of cells in each population. (A) EPCAM versus CD49f luminal and basal/ME (i) and luminobasal (ii). (B) CD24 versus CD49f. Error bars are ±SEM, and p values were calculated by Student’s two-tailed t test. CD24 versus CD49f: Snai2+/+, n = 11; Snai2LacZ/LacZ, n = 8. EPCAM versus CD49f: Snai2+/+, n = 5; Snai2LacZ/LacZ, n = 8.
(C) Relative enrichment of mouse mature luminal, luminal progenitor, basal/stem, and stromal signatures (defined by Lim et al., 2009) in the Snai2LacZ/LacZ luminobasal population (EPCAMhi/CD49fhi).
(D) Representative whole-mount and hematoxylin and eosin staining (H&E) images of nulliparous Snai2+/+ and Snai2LacZ/LacZ mammary glands (mice were 16 weeks). Arrowheads indicate hyperplastic terminal ductal units (HTDUs). Scale bars represent 100 μm.
(E) High-magnification H&E images of nulliparous Snai2+/+ and Snai2LacZ/LacZ mammary glands (a HTDU structure is depicted) (i). Quantification indicates the percent of HTDUs observed in mammary whole mounts. Snai2+/+, n = 5; Snai2LacZ/LacZ, n = 5. Immunohistochemical (IHC) staining for Ki67 (ii) and ER-α (iii) in nulliparous Snai2+/+ and Snai2LacZ/LacZ mammary glands. Staining is quantified to the right and indicates the percent of ER-α- or Ki67-positive cells per gland. Snai2+/+, n = 4; Snai2LacZ/LacZ, n = 4. All analyses were performed on 16-week-old mice. Scale bars represent 100 μm. Error bars are ±SD, and p values were calculated by Student’s two-tailed t test.
(F) Confocal immunofluorescent images of Snai2+/+ and Snai2LacZ/LacZ mammary glands stained for the luminal marker EPCAM (red) and the myoepithelial marker SMA (green). Nuclei were stained with DAPI (cyan). Arrowheads represent basal cells that are aberrantly expressing EPCAM. The arrow highlights the aberrant filling of the ductal lumen with luminal cells. Scale bars represent 10 μm.
(G) Representative H&E images of mammary glands from Snai2+/+ and Snai2LacZ/LacZ mice on day 1 of lactation. Type I and type II phenotypes from Snai2LacZ/LacZ mammary glands are shown. Mice were mated at 16 weeks. Scale bars represent 100 μm.
Also consistent with the in vitro findings, flow cytometry analysis of mammary epithelial cells from Snai2LacZ/LacZ mice revealed a significant reduction in the number of EPCAMlo/CD49fhi basal/myoepithelial (ME) cells compared to age-matched WT mice (with a similar, although not statistically significant, downward trend in the CD24med/CD49fhi basal/ME population; Figures 3Ai and 3B). Moreover, the EPCAMlo/CD49fhi basal cell population of Snai2LacZ/LacZ mammary glands exhibited a significant shift toward an EPCAMhi/CD49fhi state; termed the luminobasal state, this population reflected an altered basal state that acquired distinct features of luminal differentiation (Figure 3Aii). Consistent with this, genome-wide expression analysis on sorted luminobasal cells from Snai2LacZ/LacZ mammary glands revealed a significant enrichment of luminal-related epithelial genes, including several luminal cytokeratins and claudin tight junction proteins (GEO accession number GSE55620), compared to WT basal cells (EPCAMlo/CD49fhi). Additionally, when probed for signatures of lineage-specific mouse mammary epithelial subpopulations (Lim et al., 2009), the luminobasal cells showed significant enrichment in the luminal progenitor and mature luminal signatures (Figure 3C).
Confocal dual-immunofluorescence microscopy analysis for the luminal marker EPCAM and the basal/ME marker SMA was also performed to validate the cellular differentiation states of luminal and basal cells in Snai2LacZ/LacZ mammary glands in situ. The analysis revealed two striking details: (1) the population of aberrant cells filling the ductal lumen of Snai2LacZ/LacZ mammary glands was predominantly of the luminal lineage (EPCAM+), but some aberrantly expressed SMA, and (2) the outer basal/ME layer of Snai2LacZ/LacZ mammary glands contained an uncharacteristic number of basal/ME cells coexpressing both basal and luminal lineage markers, further supporting the notion that SLUG deficiency causes basal cells to acquire luminal features (Figure 3F).
Loss of SLUG Impairs Tissue Function and Regeneration and Confers Resistance to Tumorigenesis
To determine whether the defects in luminal and basal progenitor cells might alter tissue function, 16-week-old female Snai2LacZ/LacZ mutant mice were examined for their ability to undergo pregnancy-induced differentiation and lactation. Although Snai2LacZ/LacZ mutant mice were fertile and could give rise to viable pups with similar efficiencies as WT females, all of the pups nursed by the majority of Snai2LacZ/LacZ mutant mice (five out of seven) died, with pups appearing to have empty stomachs. Surprisingly, examination of mammary tissues from Snai2LacZ/LacZ mutant mice that were unable to nurse their pups revealed two prominent phenotypes: either (1) a block in alveologenesis and failure to undergo lactational differentiation, suggestive of luminal progenitor exhaustion (type I), or (2) apparent normal alveolar differentiation and milk production but evidence of premature involution (type II; Figure 3G). Because Snai2LacZ/LacZ females presented no obvious abnormal maternal nurturing behavior, this latter phenotype suggested that when milk was produced in the Snai2LacZ/LacZ mutant mice, it was not available to neonates. Given that basal/ME cells exhibited increased luminal differentiation, we reasoned this failure of milk ejection might be due to impaired function and contractile activity of basal/ME cells. Consistent with this notion, morphological and histological analyses revealed that mammary glands from Snai2LacZ/LacZ dams contained large, dilated ducts engorged with milk compared to WT glands in which the ducts were empty due to efficient milk ejection. Collapsed alveoli and gland fragmentation, an indication of complete secretory tissue regression, were also found in Snai2 mutant mammary epithelium (Figure 3F), similar to those resulting from milk stasis when milk ejection is impaired in other contexts (Quarrie et al., 1996). Taken together, our in vivo analysis of Snai2LacZ/LacZ mammary epithelium confirms the in vitro predicted phenotype associated with altered cellular dynamics due to SLUG inhibition. Furthermore, these findings demonstrate that SLUG loss in mammary epithelial cells leads to defects in basal/ME cell differentiation.
Given the defects in progenitor differentiation as well as tissue function during pregnancy/lactation, we speculated that stem cell activity necessary for tissue regeneration following transplantation might also be compromised in SLUG-deficient mammary epithelium. The mammary transplantation assay activates committed progenitors to adopt a more primitive state with extensive bipotent and regenerative potential (Kordon and Smith, 1998; Shackleton et al., 2006; Stingl et al., 2006; Van Keymeulen et al., 2011). Consistent with the in vitro prediction that stem cells can no longer transition into basal cells following SLUG inhibition, transplantation of 50,000 Snai2LacZ/LacZ MECs failed to generate any mammary outgrowths, while nearly complete mammary repopulation was observed in 100% of the transplants from WT MECs (Figure 4A). This suggested that SLUG might be necessary for mammary progenitor cells to transition back into stem/basal states during tissue regeneration in vivo.
Figure 4.
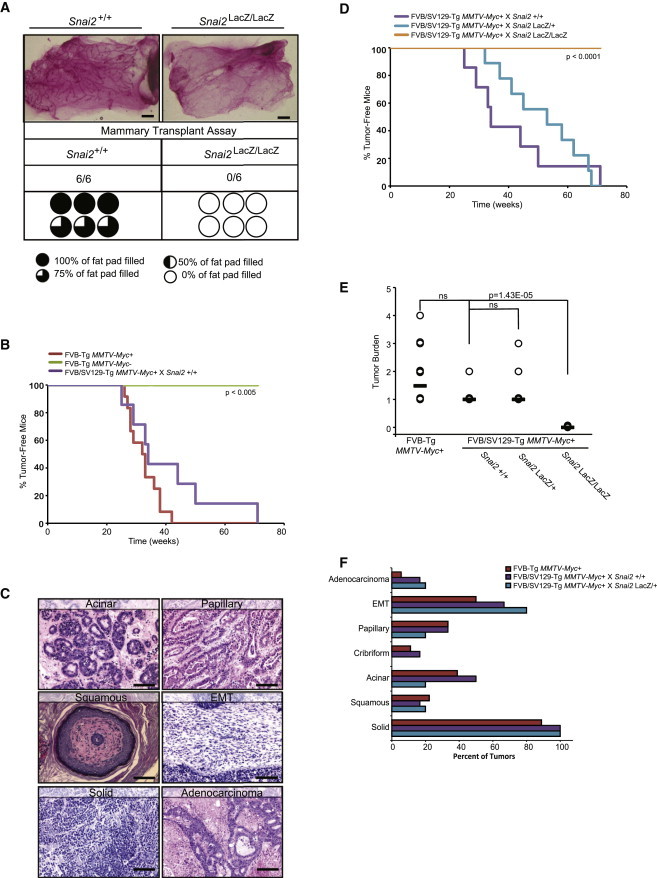
SLUG Loss Impairs Tissue Regeneration and Confers Resistance to Tumorigenesis
(A) Whole-mount analysis of mammary epithelial outgrowths 12 weeks after transplantation. A total of 50,000 MECs isolated from Snai2+/+ or Snai2LacZ/LacZ mammary glands (nulliparous, 16 weeks) were transplanted into the cleared fat pads of 3-week-old nonobese diabetic/severe combined immunodeficiency (NOD/SCID) mice. Scale bars represent 200 μm. The extent to which each outgrowth filled the fat pad is indicated by the “pie chart” symbols.
(B) Kaplan-Meier tumor-free survival curves of FVB-Tg MMTV-Myc+ (n = 12; red), FVB-Tg MMTV-Myc− (n = 6; green) and FVB/SV129-Tg x Snai2+/+ mice (n = 7; purple). p values were calculated using the log-rank test.
(C) MMTV-Myc tumor histopathology. Representative H&E staining of tumors from FVB-Tg MMTV-Myc+, and FVB/SV129-Tg MMTV-Myc+ mice. Scale bars represent 100 μm.
(D) Kaplan-Meier tumor-free survival curves of FVB/SV129-Tg MMTV-Myc+ mice: Snai2+/+ (n = 7; purple), Snai2LacZ/+ (n = 9; blue), and Snai2LacZ/LacZ (n = 6; orange). p values were calculated using the log-rank test.
(E) Tumor burden curve for FVB-Tg MMTV-Myc+ (parental, n = 14), FVB/SV129-Tg x Snai2+/+ (n = 7), FVB/SV129-Tg × Snai2LacZ/+ (n = 9), and FVB/SV129-Tg x Snai2LacZ/LacZ (n = 6) mice. Black bars represent the median tumor burden for each cohort. p values were calculated by Student’s two-tailed t test.
(F) Histologic features from tumors arising in FVB-Tg MMTV-Myc+ (n = 14), FVB/SV129-Tg MMTV-Myc+ × Snai2+/+ (n = 6), and FVB/SV129-Tg MMTV-Myc+ × Snai2LacZ/+ (n = 5) mice were examined. The tumors were scored for the presence of the various dominant histological patterns.
Because tumor formation also requires activation of primitive stem/basal cell programs (Youssef et al., 2012), we crossed Snai2LacZ/LacZ mice onto the MMTV-Myc mouse mammary tumor model background to determine whether defects in mammary progenitor cell-state transitions might also affect tumorigenesis. MMTV-Myc+ mice develop heterogeneous tumors with various histologies and phenotypes associated with both luminal and basal features, including dominant luminal type tumors (microacinar and papillary), dominant basal type tumors (squamous and epithelial-to-mesenchymal transition), and mixed solid and adenocarcinomas with features of both basal and luminal differentiation (Andrechek et al., 2009; Sinn et al., 1987). Snai2+/+/MMTV-Myc+ and Snai2LacZ/+/MMTV-Myc+ compound mice also developed mammary adenocarcinomas with similar histologies and frequencies as the parental MMTV-Myc+ mice (Figures 4B–4F). Strikingly, however, Snai2LacZ/LacZ/MMTV-Myc+ compound mice completely failed to develop tumors by 70 weeks and thus were resistant to mammary tumorigenesis (Figure 4D). Taken together, these findings indicate that SLUG is necessary for mammary epithelial cell plasticity and that transitioning back into more primitive stem-like states is a prerequisite for both tissue regeneration and tumor initiation.
A SLUG/LSD1 Histone-Modifying Complex Regulates Gene Expression Programs in Basal Cells
Our findings have shown that SLUG is a critical regulator of breast epithelial cell plasticity, cell-state transitions, and differentiation. As a transcriptional repressor that mediates sequence-specific interactions with DNA (Hemavathy et al., 2000; Nieto, 2002), we hypothesized that SLUG might be interacting with other proteins to transcriptionally control these various differentiation programs. To identify interacting proteins that could cooperate with SLUG to regulate gene expression, we performed immunoprecipitation-coupled mass spectrometry by overexpressing a FLAG-tagged SLUG in 293T cells. Consistent with a recent report also using this approach, we found that lysine-specific demethylase 1 (LSD1) coimmunopurifies with SLUG (Figure S3A) (Wu et al., 2012). We confirmed this endogenous interaction in both MCF10A and HMEC basal progenitor cells (Figure 5A).
Figure 5.
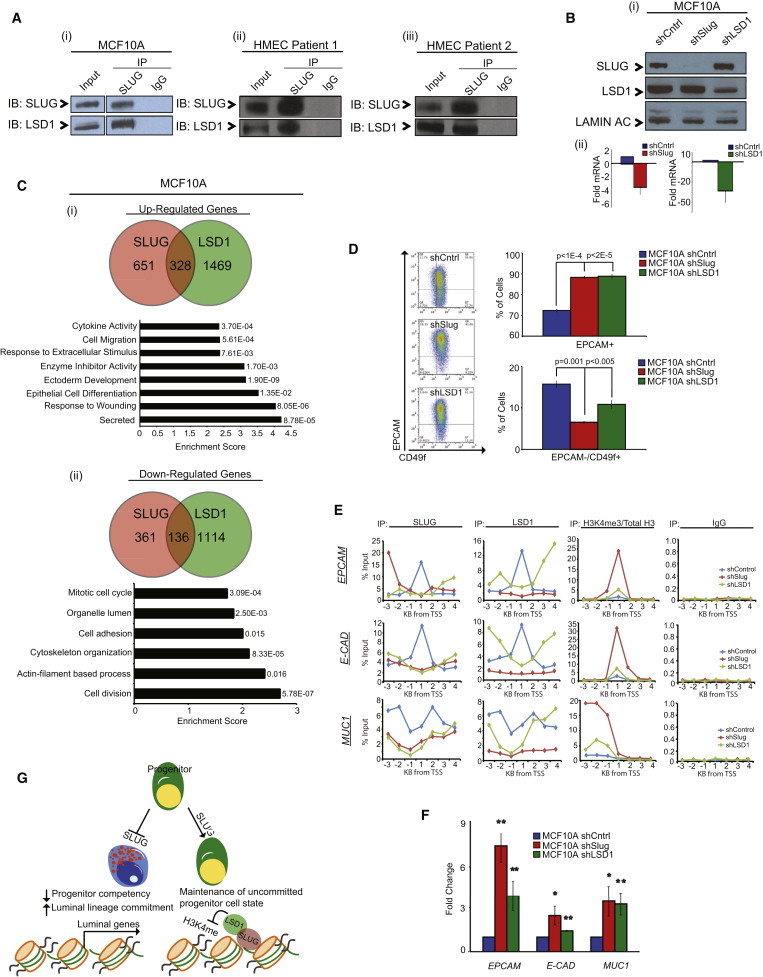
A SLUG/LSD1 Complex Regulates Gene Expression in Basal Cells
(A) Coimmunoprecipitation of endogenous SLUG and LSD1 from MCF10A cells (i), HMEC patient 1 (ii), and HMEC patient 2 (iii).
(B) Western blot analysis of SLUG and LSD1 expression in shControl, shSlug, and shLSD1 MCF10A cells (i). Quantitative real-time PCR analysis of SLUG and LSD1 mRNA levels (normalized to GAPDH) in shSlug and shLSD1 MCF10A cells relative to control cells (ii). Data represent the mean ± SD of three independent experiments, and p values were calculated by Student’s two-tailed t test.
(C) Top: Venn diagrams showing the overlap of microarray-identified genes commonly upregulated (i) or downregulated (ii) in shSlug and shLSD1 MCF10A cells compared to control cells. Bottom: Gene Ontology biological process categories commonly upregulated (i) or downregulated (ii) in shSlug and shLSD1 MCF10A cells compared to control cells. The DAVID Functional Annotation Tool was used to define categories with an enrichment score >1.5; the enrichment score and the p value of genes differentially expressed in each category are shown.
(D) Flow cytometry analysis of luminal (EPCAM) and basal (CD49f) cell-surface marker expression in shControl, shSlug and shLSD1 MCF10A cells. Representative dot plots for EPCAM versus CD49f expression are shown. Data represent the mean ± SD of three independent experiments, and p values were calculated by Student’s two-tailed t test.
(E) ChIP analysis showing profiles for SLUG and LSD1 localization along the transcriptional start site (TSS; −3 kb to 4 kb) of common SLUG/LSD1 target genes (EPCAM, E-CAD and MUC1). Also depicted is relative enrichment of H3K4me3 (compared to total H3 levels) along these sites. Data are plotted as percent of input. ChIP was performed in shControl, shSlug, and shLSD1 MCF10A cells. For each cell line, DNA from two separate ChIP experiments was pooled, and enrichment was tested at the indicated promoter regions using a customized quantitative RT-PCR array.
(F) Quantitative real-time PCR analysis of luminal marker expression (normalized to GAPDH) in MCF10A shSlug and shLSD1 cells. Genes differentially expressed in the shSlug and shLSD1 cells compared to the scrambled control cells are plotted. Bars represent the fold change ± SD of three independent experiments, and p values were calculated by Student’s two-tailed t test. ∗p < 0.05, ∗∗p < 0.01.
(G) Schematic diagram showing the mechanism by which SLUG and LSD1 regulate cell-state dynamics in mammary epithelial cells.
See also Figure S3.
LSD1 is a histone demethylase whose transcriptional repression activity has been correlated with enzymatic removal of mono- and dimethyl groups from histone H3 Lysine 4 (H3K4; Shi et al., 2004; Wang et al., 2009). LSD1 has been shown to interact with the SNAG domain of SNAIL to regulate its activity and stability (Lin et al., 2010; Christofori, 2010). Based on this, we hypothesized that SLUG may be recruiting LSD1 to specific sites on luminal and stem cell gene promoters where it modifies histone marks associated with active transcription to suppress lineage commitment and differentiation and promote plasticity. In support of this hypothesis, genome-wide expression analysis of HMECs and MCF10A cells in which LSD1 had been inhibited (Figure 5B; Figures S3B and S3C) identified a common set of epithelial-related genes whose expression was similarly regulated upon SLUG knockdown (Figure 5C; Figure S3D). Additionally, similar to shSlug cells, inhibition of LSD1 led to an increased proportion of EPCAM+ luminal cells and a decreased proportion of EPCAM−/CD49f+ basal cells (Figures 2A and 5D; Figures S3E and S3F).
To show that the SLUG/LSD1 complex transcriptionally regulates MEC differentiation, a core set of SLUG/LSD1 target genes, including EPCAM, E-CADHERIN (E-CAD), and MUC1, were used to evaluate SLUG recruitment of LSD1 to their promoters. In addition, these genes were used to examine whether the SLUG/LSD1 complex was modifying histone marks to affect chromatin and gene transcription. Chromatin immunoprecipitation (ChIP) confirmed SLUG and LSD1 occupancy at the proximal promoters of the indicated luminal epithelial genes (Figure 5E). Upon SLUG knockdown, SLUG and LSD1 occupancy at these promoter regions was lost. This loss of SLUG and LSD1 occupancy was accompanied by a significant increase in the LSD1-associated activating H3K4me3 histone mark (Saleque et al., 2007) at these promoters (Figure 5E) and increased gene expression (Figure 5F). Interestingly, upon LSD1 knockdown, SLUG and LSD1 occupancy at these promoter regions was also lost and gene expression was increased; this suggested that LSD1 is necessary for SLUG recruitment to these promoters. In addition, LSD1 knockdown also led to increased H3K4me3 histone marks at these promoters, although it was not as robust as compared to SLUG knockdown. This suggests that SLUG is necessary to recruit LSD1 in a sequence-specific manner but that LSD1 is also necessary for effective occupancy and histone demethylase activity of the SLUG/LSD1 complex. Together, these findings show that SLUG interaction with LSD1 is important to modify chromatin and repress luminal gene expression (Figure 5G).
Discussion
In this study, we uncover the complex connection between cellular differentiation and cellular plasticity regulated by SLUG, thus revealing how it impacts stem cell activity during tissue homeostasis, function, regeneration, and even the genesis of cancer. Our findings support a model in which the transcription factor, SLUG, plays a dual role in regulating MEC lineage identity; on the one hand, it represses luminal epithelial differentiation, but on the other it promotes stem cell-state transitions necessary for transplantation and tumorigenesis. As a transcriptional repressor of luminal differentiation, we showed that SLUG interacts with LSD1 and recruits it to specific luminal gene promoters where it demethylates H3K4 (Figure 5E). In the absence of SLUG, LSD1 is no longer recruited to these genes to modify chromatin; this results in the expression of otherwise-repressed genes. Consistent with this, our in vivo and in vitro observations showed that loss of SLUG resulted in aberrant EPCAM expression in basal/ME cells. As a regulator of progenitor cell dynamics, we found that SLUG also actively influences stem cell transitions. In the absence of SLUG, cellular transitions from and into the basal and stem cell states were compromised. This was supported in vivo, where SLUG-deficient MECs were unable to regenerate a mammary gland following transplantation and were unable to form oncogene induced mammary tumors; both processes require the transition of basal progenitor cells into primitive stem-like states not normally present during development (van Amerongen et al., 2012; Van Keymeulen et al., 2011). Future studies will be needed to determine whether LSD1 is also necessary for repressing SLUG target genes that regulate stem cell activity.
The observations that transplantation of Snai2LacZ/LacZ mouse tissue fragments, rather than dissociated cells, results in mature, highly branched mammary ductal trees that infiltrate the entire fat pad (Nassour et al., 2012) and that Snai2LacZ/LacZ mice exhibit normal embryonic and pubertal mammary stem cell activity suggest that SLUG is dispensable for normal mammary stem cell activity. However, our findings and those of others clearly show that SLUG is necessary for mammary stem cell activity during transplantation of dissociated cells (Figure 4A) (Guo et al., 2012). These conflicting observations can be reconciled by the differences in stem cell activity required during tissue regeneration following transplantation of dissociated cells from those used during ductal elongation of already-established structures. Mammary tissues are regenerated by unipotent lineage-restricted progenitor cells that can expand to give rise to mature luminal or basal/ME cells (Keller et al., 2011; van Amerongen et al., 2012; Van Keymeulen et al., 2011). Therefore, dissociated cells must adopt a bipotent fate upon transplantation, unlocking a regenerative potential that is not normally used during development (van Amerongen et al., 2012; Van Keymeulen et al., 2011). Thus, our findings suggest that the cell-state transitions necessary for this process require SLUG.
The dedifferentiation of lineage-committed cells into more primitive stem-like states during transplantation is similar to the cell-state transitions that occur during tumor initiation (Keller et al., 2010). For example, preceding the onset of basal cell carcinoma, adult tumor-initiating cells are reprogrammed into a fate resembling embryonic hair follicle progenitors (Youssef et al., 2012). Similarly, in a model of intestinal cancer, epithelial non-stem cells have been shown to dedifferentiate into tumor-initiating cells (Schwitalla et al., 2013). These changes in cell-state transitions are genetically and epigenetically controlled (Chaffer et al., 2013; Pacheco-Pinedo et al., 2011), and here we show that in the mammary gland, they require the transcription factor SLUG.
Although epithelial cell-state conversions have been shown to occur in vivo (Doupé et al., 2012; Wang et al., 2013), quantitative modeling of this dynamic process has been challenging. We speculated that a Markov model previously used to study cell-state transitions of cancer cells in vitro (Gupta et al., 2011) could also be used to uncover important cell-state conversions in normal MEC populations; we also wondered whether the model’s predictions could be tested in vivo. Accordingly, we applied the model to normal, disease-free mammary epithelial cells in vitro and found that it could accurately predict epithelial plasticity in vivo. Remarkably, the model predicted that upon loss of SLUG, there would be an accumulation of luminal cells due to the increased probability that stem cells would transition into luminal cells. Indeed, this phenotype was observed in vivo in Snai2LacZ/LacZ mice. Thus, this approach opens new possibilities for assessing the consequence of genetic perturbations on cell-state transitions in normal cells that can be used to predict and understand complex phenotypes in vivo.
Experimental Procedures
Cell Lines and Tissue Culture
HMECs and MCF10A cells were cultured in mammary epithelial growth medium (MEGM Bullet Kit; Lonza Corporation) comprising mammary epithelial cell basal medium supplemented with bovine pituitary extract (52 μg/ml), hydrocortisone (0.5 μg/ml), human epidermal growth factor (10 ng/ml), and insulin (5 μg/ml). MCF10A cells were further supplemented with cholera toxin (100 ng/ml). For proliferation assays, cells were plated in 96-well plates at 1,000 cells per well. On days 1, 2, and 3, cells were lysed with CellTiter-Glo Luminescent Cell Viability Assay reagent (Promega) and luminescence was read using the Sirius/FB15 Luminometer (Berthold).
Mouse Strains
The generation of Snai2LacZ/LacZ mice was described previously (Jiang et al., 1998) and generously provided by Donna F. Kusewitt. The MMTV-Myc mouse (FVB-Tg MMTV-Myc) used in this study has been described elsewhere (Sinn et al., 1987).
Animal Surgery
All animal procedures were conducted in accordance with a protocol approved by the Tufts University IACUC committee. A colony of Snai2LacZ/LacZ, FVB-Tg MMTV-Myc+, and FVB/SV129-Tg MMTV-Myc+ × Snai2LacZ/LacZ mice were maintained in-house under aseptic sterile conditions. Mice were administered autoclaved food and water ad libitum. Surgeries were performed under sterile conditions, and animals received antibiotics in the drinking water up to 2 weeks after all surgical procedures.
Acknowledgments
The authors would like to thank Dr. Jessica McCready and Karrie Southwell for assistance with animal breeding and genotyping. We would also like to thank Lisa Arendt for her intellectual and technical assistance. This work was supported by grants from the Breast Cancer Research Foundation, the NIH/NICHD (R01HD073035), the NCI Breast SPORE program at UNC (P50-CA58223-09A1), grant RO1-CA148761, and the NIH/NCI (R01CA125554). In addition, this project was supported by the National Center for Research Resources (grant UL1 RR025752) and the National Center for Advancing Translational Sciences, National Institutes of Health (grant number UL1 TR000073). The content is solely the responsibility of the authors and does not necessarily represent the official views of the NIH.
Footnotes
This is an open access article under the CC BY-NC-ND license (http://creativecommons.org/licenses/by-nc-nd/3.0/).
Contributor Information
Piyush B. Gupta, Email: pgupta@wi.mit.edu.
Charlotte Kuperwasser, Email: charlotte.kuperwasser@tufts.edu.
Accession Numbers
The GEO accession number for the human microarray data reported in this paper is GSE54735. The GEO accession number for the mouse microarray data is GSE55620.
Supplemental Information
References
- Andrechek E.R., Cardiff R.D., Chang J.T., Gatza M.L., Acharya C.R., Potti A., Nevins J.R. Genetic heterogeneity of Myc-induced mammary tumors reflecting diverse phenotypes including metastatic potential. Proc. Natl. Acad. Sci. USA. 2009;106:16387–16392. doi: 10.1073/pnas.0901250106. [DOI] [PMC free article] [PubMed] [Google Scholar]
- Barker N., van de Wetering M., Clevers H. The intestinal stem cell. Genes Dev. 2008;22:1856–1864. doi: 10.1101/gad.1674008. [DOI] [PMC free article] [PubMed] [Google Scholar]
- Barker N., Ridgway R.A., van Es J.H., van de Wetering M., Begthel H., van den Born M., Danenberg E., Clarke A.R., Sansom O.J., Clevers H. Crypt stem cells as the cells-of-origin of intestinal cancer. Nature. 2009;457:608–611. doi: 10.1038/nature07602. [DOI] [PubMed] [Google Scholar]
- Blanpain C., Fuchs E. Epidermal stem cells of the skin. Annu. Rev. Cell Dev. Biol. 2006;22:339–373. doi: 10.1146/annurev.cellbio.22.010305.104357. [DOI] [PMC free article] [PubMed] [Google Scholar]
- Blanpain C., Lowry W.E., Geoghegan A., Polak L., Fuchs E. Self-renewal, multipotency, and the existence of two cell populations within an epithelial stem cell niche. Cell. 2004;118:635–648. doi: 10.1016/j.cell.2004.08.012. [DOI] [PubMed] [Google Scholar]
- Bonnet D., Dick J.E. Human acute myeloid leukemia is organized as a hierarchy that originates from a primitive hematopoietic cell. Nat. Med. 1997;3:730–737. doi: 10.1038/nm0797-730. [DOI] [PubMed] [Google Scholar]
- Chaffer C.L., Marjanovic N.D., Lee T., Bell G., Kleer C.G., Reinhardt F., D’Alessio A.C., Young R.A., Weinberg R.A. Poised chromatin at the ZEB1 promoter enables breast cancer cell plasticity and enhances tumorigenicity. Cell. 2013;154:61–74. doi: 10.1016/j.cell.2013.06.005. [DOI] [PMC free article] [PubMed] [Google Scholar]
- Christofori G. Snail1 links transcriptional control with epigenetic regulation. EMBO J. 2010;29:1787–1789. doi: 10.1038/emboj.2010.92. [DOI] [PMC free article] [PubMed] [Google Scholar]
- Doupé D.P., Alcolea M.P., Roshan A., Zhang G., Klein A.M., Simons B.D., Jones P.H. A single progenitor population switches behavior to maintain and repair esophageal epithelium. Science. 2012;337:1091–1093. doi: 10.1126/science.1218835. [DOI] [PMC free article] [PubMed] [Google Scholar]
- Eirew P., Stingl J., Raouf A., Turashvili G., Aparicio S., Emerman J.T., Eaves C.J. A method for quantifying normal human mammary epithelial stem cells with in vivo regenerative ability. Nat. Med. 2008;14:1384–1389. doi: 10.1038/nm.1791. [DOI] [PubMed] [Google Scholar]
- Geiss G.K., Bumgarner R.E., Birditt B., Dahl T., Dowidar N., Dunaway D.L., Fell H.P., Ferree S., George R.D., Grogan T. Direct multiplexed measurement of gene expression with color-coded probe pairs. Nat. Biotechnol. 2008;26:317–325. doi: 10.1038/nbt1385. [DOI] [PubMed] [Google Scholar]
- Guo W., Keckesova Z., Donaher J.L., Shibue T., Tischler V., Reinhardt F., Itzkovitz S., Noske A., Zürrer-Härdi U., Bell G. Slug and Sox9 cooperatively determine the mammary stem cell state. Cell. 2012;148:1015–1028. doi: 10.1016/j.cell.2012.02.008. [DOI] [PMC free article] [PubMed] [Google Scholar]
- Gupta P.B., Fillmore C.M., Jiang G., Shapira S.D., Tao K., Kuperwasser C., Lander E.S. Stochastic state transitions give rise to phenotypic equilibrium in populations of cancer cells. Cell. 2011;146:633–644. doi: 10.1016/j.cell.2011.07.026. [DOI] [PubMed] [Google Scholar]
- Hemavathy K., Ashraf S.I., Ip Y.T. Snail/slug family of repressors: slowly going into the fast lane of development and cancer. Gene. 2000;257:1–12. doi: 10.1016/s0378-1119(00)00371-1. [DOI] [PubMed] [Google Scholar]
- Huang da W., Sherman B.T., Lempicki R.A. Systematic and integrative analysis of large gene lists using DAVID bioinformatics resources. Nat. Protoc. 2009;4:44–57. doi: 10.1038/nprot.2008.211. [DOI] [PubMed] [Google Scholar]
- Jiang R., Lan Y., Norton C.R., Sundberg J.P., Gridley T. The Slug gene is not essential for mesoderm or neural crest development in mice. Dev. Biol. 1998;198:277–285. [PubMed] [Google Scholar]
- Keller P.J., Lin A.F., Arendt L.M., Klebba I., Jones A.D., Rudnick J.A., DiMeo T.A., Gilmore H., Jefferson D.M., Graham R.A. Mapping the cellular and molecular heterogeneity of normal and malignant breast tissues and cultured cell lines. Breast Cancer Res. 2010;12:R87. doi: 10.1186/bcr2755. [DOI] [PMC free article] [PubMed] [Google Scholar]
- Keller P.J., Arendt L.M., Kuperwasser C. Stem cell maintenance of the mammary gland: it takes two. Cell Stem Cell. 2011;9:496–497. doi: 10.1016/j.stem.2011.11.008. [DOI] [PubMed] [Google Scholar]
- Keller P.J., Arendt L.M., Skibinski A., Logvinenko T., Klebba I., Dong S., Smith A.E., Prat A., Perou C.M., Gilmore H. Defining the cellular precursors to human breast cancer. Proc. Natl. Acad. Sci. USA. 2012;109:2772–2777. doi: 10.1073/pnas.1017626108. [DOI] [PMC free article] [PubMed] [Google Scholar]
- Kordon E.C., Smith G.H. An entire functional mammary gland may comprise the progeny from a single cell. Development. 1998;125:1921–1930. doi: 10.1242/dev.125.10.1921. [DOI] [PubMed] [Google Scholar]
- Lim E., Vaillant F., Wu D., Forrest N.C., Pal B., Hart A.H., Asselin-Labat M.L., Gyorki D.E., Ward T., Partanen A., kConFab Aberrant luminal progenitors as the candidate target population for basal tumor development in BRCA1 mutation carriers. Nat. Med. 2009;15:907–913. doi: 10.1038/nm.2000. [DOI] [PubMed] [Google Scholar]
- Lin T., Ponn A., Hu X., Law B.K., Lu J. Requirement of the histone demethylase LSD1 in Snai1-mediated transcriptional repression during epithelial-mesenchymal transition. Oncogene. 2010;29:4896–4904. doi: 10.1038/onc.2010.234. [DOI] [PMC free article] [PubMed] [Google Scholar]
- Nassour M., Idoux-Gillet Y., Selmi A., Côme C., Faraldo M.L., Deugnier M.A., Savagner P. Slug controls stem/progenitor cell growth dynamics during mammary gland morphogenesis. PLoS ONE. 2012;7:e53498. doi: 10.1371/journal.pone.0053498. [DOI] [PMC free article] [PubMed] [Google Scholar]
- Nieto M.A. The snail superfamily of zinc-finger transcription factors. Nat. Rev. Mol. Cell Biol. 2002;3:155–166. doi: 10.1038/nrm757. [DOI] [PubMed] [Google Scholar]
- Pacheco-Pinedo E.C., Durham A.C., Stewart K.M., Goss A.M., Lu M.M., Demayo F.J., Morrisey E.E. Wnt/β-catenin signaling accelerates mouse lung tumorigenesis by imposing an embryonic distal progenitor phenotype on lung epithelium. J. Clin. Invest. 2011;121:1935–1945. doi: 10.1172/JCI44871. [DOI] [PMC free article] [PubMed] [Google Scholar]
- Parent A.E., Choi C., Caudy K., Gridley T., Kusewitt D.F. The developmental transcription factor slug is widely expressed in tissues of adult mice. J. Histochem. Cytochem. 2004;52:959–965. doi: 10.1369/jhc.4A6277.2004. [DOI] [PubMed] [Google Scholar]
- Parker J.S., Mullins M., Cheang M.C., Leung S., Voduc D., Vickery T., Davies S., Fauron C., He X., Hu Z. Supervised risk predictor of breast cancer based on intrinsic subtypes. J. Clin. Oncol. 2009;27:1160–1167. doi: 10.1200/JCO.2008.18.1370. [DOI] [PMC free article] [PubMed] [Google Scholar]
- Prat A., Parker J.S., Karginova O., Fan C., Livasy C., Herschkowitz J.I., He X., Perou C.M. Phenotypic and molecular characterization of the claudin-low intrinsic subtype of breast cancer. Breast Cancer Res. 2010;12:R68. doi: 10.1186/bcr2635. [DOI] [PMC free article] [PubMed] [Google Scholar]
- Proia T.A., Keller P.J., Gupta P.B., Klebba I., Jones A.D., Sedic M., Gilmore H., Tung N., Naber S.P., Schnitt S. Genetic predisposition directs breast cancer phenotype by dictating progenitor cell fate. Cell Stem Cell. 2011;8:149–163. doi: 10.1016/j.stem.2010.12.007. [DOI] [PMC free article] [PubMed] [Google Scholar]
- Quarrie L.H., Addey C.V., Wilde C.J. Programmed cell death during mammary tissue involution induced by weaning, litter removal, and milk stasis. J. Cell. Physiol. 1996;168:559–569. doi: 10.1002/(SICI)1097-4652(199609)168:3<559::AID-JCP8>3.0.CO;2-O. [DOI] [PubMed] [Google Scholar]
- Saleque S., Kim J., Rooke H.M., Orkin S.H. Epigenetic regulation of hematopoietic differentiation by Gfi-1 and Gfi-1b is mediated by the cofactors CoREST and LSD1. Mol. Cell. 2007;27:562–572. doi: 10.1016/j.molcel.2007.06.039. [DOI] [PubMed] [Google Scholar]
- Schwitalla S., Fingerle A.A., Cammareri P., Nebelsiek T., Göktuna S.I., Ziegler P.K., Canli O., Heijmans J., Huels D.J., Moreaux G. Intestinal tumorigenesis initiated by dedifferentiation and acquisition of stem-cell-like properties. Cell. 2013;152:25–38. doi: 10.1016/j.cell.2012.12.012. [DOI] [PubMed] [Google Scholar]
- Shackleton M., Vaillant F., Simpson K.J., Stingl J., Smyth G.K., Asselin-Labat M.L., Wu L., Lindeman G.J., Visvader J.E. Generation of a functional mammary gland from a single stem cell. Nature. 2006;439:84–88. doi: 10.1038/nature04372. [DOI] [PubMed] [Google Scholar]
- Shi Y., Lan F., Matson C., Mulligan P., Whetstine J.R., Cole P.A., Casero R.A., Shi Y. Histone demethylation mediated by the nuclear amine oxidase homolog LSD1. Cell. 2004;119:941–953. doi: 10.1016/j.cell.2004.12.012. [DOI] [PubMed] [Google Scholar]
- Sinn E., Muller W., Pattengale P., Tepler I., Wallace R., Leder P. Coexpression of MMTV/v-Ha-ras and MMTV/c-myc genes in transgenic mice: synergistic action of oncogenes in vivo. Cell. 1987;49:465–475. doi: 10.1016/0092-8674(87)90449-1. [DOI] [PubMed] [Google Scholar]
- Stingl J., Eirew P., Ricketson I., Shackleton M., Vaillant F., Choi D., Li H.I., Eaves C.J. Purification and unique properties of mammary epithelial stem cells. Nature. 2006;439:993–997. doi: 10.1038/nature04496. [DOI] [PubMed] [Google Scholar]
- Tesori V., Puglisi M.A., Lattanzi W., Gasbarrini G.B., Gasbarrini A. Update on small intestinal stem cells. World J. Gastroenterol. 2013;19:4671–4678. doi: 10.3748/wjg.v19.i29.4671. [DOI] [PMC free article] [PubMed] [Google Scholar]
- Toma J.G., Akhavan M., Fernandes K.J., Barnabé-Heider F., Sadikot A., Kaplan D.R., Miller F.D. Isolation of multipotent adult stem cells from the dermis of mammalian skin. Nat. Cell Biol. 2001;3:778–784. doi: 10.1038/ncb0901-778. [DOI] [PubMed] [Google Scholar]
- van Amerongen R., Bowman A.N., Nusse R. Developmental stage and time dictate the fate of Wnt/β-catenin-responsive stem cells in the mammary gland. Cell Stem Cell. 2012;11:387–400. doi: 10.1016/j.stem.2012.05.023. [DOI] [PMC free article] [PubMed] [Google Scholar]
- Van Keymeulen A., Rocha A.S., Ousset M., Beck B., Bouvencourt G., Rock J., Sharma N., Dekoninck S., Blanpain C. Distinct stem cells contribute to mammary gland development and maintenance. Nature. 2011;479:189–193. doi: 10.1038/nature10573. [DOI] [PubMed] [Google Scholar]
- Wang J., Hevi S., Kurash J.K., Lei H., Gay F., Bajko J., Su H., Sun W., Chang H., Xu G. The lysine demethylase LSD1 (KDM1) is required for maintenance of global DNA methylation. Nat. Genet. 2009;41:125–129. doi: 10.1038/ng.268. [DOI] [PubMed] [Google Scholar]
- Wang Z.A., Mitrofanova A., Bergren S.K., Abate-Shen C., Cardiff R.D., Califano A., Shen M.M. Lineage analysis of basal epithelial cells reveals their unexpected plasticity and supports a cell-of-origin model for prostate cancer heterogeneity. Nat. Cell Biol. 2013;15:274–283. doi: 10.1038/ncb2697. [DOI] [PMC free article] [PubMed] [Google Scholar]
- Weissman I.L. Stem cells: units of development, units of regeneration, and units in evolution. Cell. 2000;100:157–168. doi: 10.1016/s0092-8674(00)81692-x. [DOI] [PubMed] [Google Scholar]
- Wu Z.Q., Li X.Y., Hu C.Y., Ford M., Kleer C.G., Weiss S.J. Canonical Wnt signaling regulates Slug activity and links epithelial-mesenchymal transition with epigenetic Breast Cancer 1, Early Onset (BRCA1) repression. Proc. Natl. Acad. Sci. USA. 2012;109:16654–16659. doi: 10.1073/pnas.1205822109. [DOI] [PMC free article] [PubMed] [Google Scholar]
- Youssef K.K., Van Keymeulen A., Lapouge G., Beck B., Michaux C., Achouri Y., Sotiropoulou P.A., Blanpain C. Identification of the cell lineage at the origin of basal cell carcinoma. Nat. Cell Biol. 2010;12:299–305. doi: 10.1038/ncb2031. [DOI] [PubMed] [Google Scholar]
- Youssef K.K., Lapouge G., Bouvrée K., Rorive S., Brohée S., Appelstein O., Larsimont J.C., Sukumaran V., Van de Sande B., Pucci D. Adult interfollicular tumour-initiating cells are reprogrammed into an embryonic hair follicle progenitor-like fate during basal cell carcinoma initiation. Nat. Cell Biol. 2012;14:1282–1294. doi: 10.1038/ncb2628. [DOI] [PubMed] [Google Scholar]
Associated Data
This section collects any data citations, data availability statements, or supplementary materials included in this article.