

Summary
The microenvironment is a critical mediator of stem cell survival, proliferation, migration, and differentiation. The majority of preclinical studies involving transplantation of neural stem cells (NSCs) into the CNS have focused on injured or degenerating microenvironments, leaving a dearth of information as to how NSCs differentially respond to intact versus damaged CNS. Furthermore, single, terminal histological endpoints predominate, providing limited insight into the spatiotemporal dynamics of NSC engraftment and migration. We investigated the early and long-term engraftment dynamics of human CNS stem cells propagated as neurospheres (hCNS-SCns) following transplantation into uninjured versus subacutely injured spinal cords of immunodeficient NOD-scid mice. We stereologically quantified engraftment, survival, proliferation, migration, and differentiation at 1, 7, 14, 28, and 98 days posttransplantation, and identified injury-dependent alterations. Notably, the injured microenvironment decreased hCNS-SCns survival, delayed and altered the location of proliferation, influenced both total and fate-specific migration, and promoted oligodendrocyte maturation.
Highlights
-
•
hCNS-SCns survival is decreased in the injured niche versus the intact niche
-
•
hCNS-SCns proliferation is delayed and proximal to the lesion in the injured niche
-
•
hCNS-SCns migration is localized near the lesion in the injured niche
-
•
Oligodendrocytic maturation of hCNS-SCns is increased in the injured niche
Anderson and colleagues investigated the spatiotemporal dynamics of human neural stem cell engraftment, proliferation, migration, and differentiation in the injured and uninjured spinal cord. They report that the injured microenvironment decreased hCNS-SCns survival, delayed and altered the location of proliferation, influenced both total and fate-specific migration, and promoted oligodendrocyte maturation.
Introduction
Spinal cord injury (SCI) affects approximately 1,275,000 people in the United States alone, at a cost of over $40.5 billion annually (Christopher & Dana Reeve Foundation, 2009). Human neural stem cell (hNSC) transplantation has emerged as an approach to promote repair or regeneration of the damaged CNS. However, the role of the transplantation niche in hNSC survival, proliferation, migration, and differentiation has received little attention.
A niche provides extrinsic cues that influence many aspects of stem cell biology (Decimo et al., 2012). Accordingly, a transplantation niche in an injured microenvironment could alter both the engraftment dynamics and the availability of differentiation cues. At least two paradigms can be postulated for the dynamics of transplanted cell engraftment (Figure 1A) and migration (Figure 1B) in the spinal cord. The injured microenvironment could alter these dynamics by causing a paradigm shift or enhancing/impairing one paradigm. Furthermore, the injured microenvironment could alter the lineage-specific differentiation or localization of transplanted cells.
Figure 1.
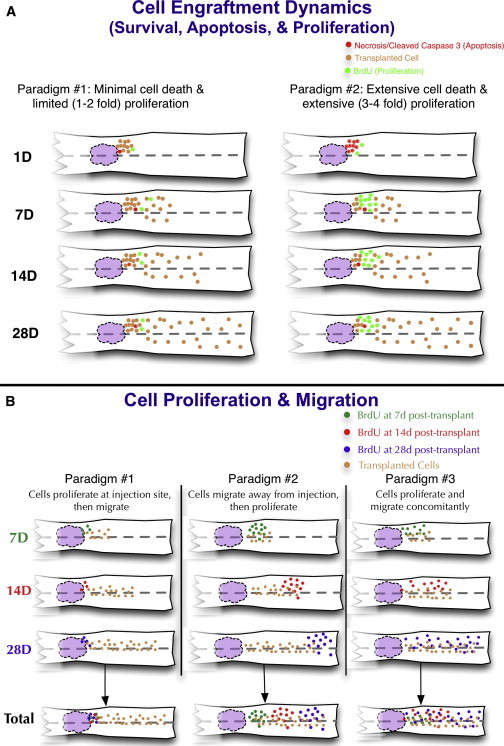
Spatiotemporal Dynamics Paradigms
(A) Engraftment paradigm 1: minimal cell death followed by limited (1- to 2-fold) proliferation. Engraftment paradigm 2: extensive cell death followed by extensive (3- to 4-fold) proliferation.
(B) Proliferation paradigm 1: cells proliferate near the site of transplantation prior to migrating away. Proliferation paradigm 2: cells migrate from the site of transplantation and then proliferate. Proliferation paradigm 3: cells proliferate and migrate concomitantly. The white structure represents the spinal cord, the purple region represents the lesion, and the dashed line indicates the midline. Predictions for rostral and caudal regions were set as equivalent in these paradigms.
See also Figure S7.
In previous studies, we tested the transplantation of human CNS stem cells propagated as neurospheres (hCNS-SCns; Uchida et al., 2000) into immediate, subacute, and chronic microenvironments following contusive SCI in NOD-scid mice (Cummings et al., 2005, 2006, 2008; Hooshmand et al., 2009; Salazar et al., 2010), C57Bl/6 mice (Sontag et al., 2013), and athymic nude rats (Piltti et al., 2013a, 2013b). In those studies, we identified robust engraftment, long-term survival, proliferation, differentiation, and extensive migration, along with improved locomotor function, with no evidence of allodynia or hyperalgesia. Although it has been suggested that cell engraftment could be adversely affected by transplantation timing (Okano et al., 2003), we have reported that stereological quantification of engrafted cells after immediate, subacute, or early chronic transplantation revealed similar total numbers of human cells 12–16 weeks posttransplantation (Cummings et al., 2005, 2006, 2008; Hooshmand et al., 2009; Salazar et al., 2010). Our objective in the present study was to investigate the effect of the transplantation niche and injured microenvironment on the spatiotemporal dynamics of hNSC engraftment. For these experiments, we focused on the subacute hCNS-SCns transplantation paradigm, which was previously demonstrated to improve locomotor function (Cummings et al., 2005, 2008; Hooshmand et al., 2009).
Results
To investigate the dynamics of hCNS-SCns engraftment, we quantified SC121, a human cytoplasmic marker, in conjunction with bromodeoxyuridine (BrdU) or KI67, markers for mitotically active cells, or cleaved caspase 3 (CC3), a marker for cellular apoptosis. Lineage-specific differentiation of hCNS-SCns was determined by double-labeling immunohistochemistry for SC121 in combination with OLIG2 (oligodendrocytic) or DCX (neuronal), or single labeling for SC123 (human astrocytic). Representative images of coronal sections for human cells with proliferating or apoptotic cells are shown in Figures 2 and S1 (available online). Stereological quantification for these markers was performed on all animals.
Figure 2.
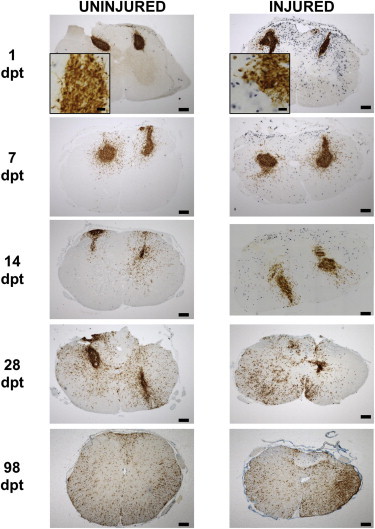
hCNS-SCns Engraftment and Proliferation
hCNS-SCns survived and proliferated in both groups, as shown in representative images of coronal sections from uninjured and injured spinal cords immunolabeled for SC121 (brown) and BrdU (blue) at 1, 7, 14, 28, and 98 dpt. Scale bar, 200 μm in complete sections and 20 μm in insets.
See also Figure S1.
hCNS-SCns Engraftment Is Altered in the Injured Microenvironment
All animals exhibited labeling for human cells at all time points, demonstrating 100% engraftment success. We investigated changes in the total hCNS-SCns number at 1, 7, 14, 28, and 98 days posttransplantation (dpt) in injured and uninjured mice (Figure 3A). Two-way ANOVA identified a significant interaction for both time posttransplantation (p < 0.001) and injury (p < 0.001), suggesting that hCNS-SCns engraftment was altered in the injured microenvironment. Analysis revealed a significant decrease in the number of hCNS-SCns in injured mice in comparison with uninjured mice at all posttransplantation times investigated (7,739 ± 1,273 versus 18,690 ± 1,634, p < 0. 001). Relatively few human cells were detected by SC121 1 dpt (11% of the initial hCNS-SCns transplant dose in injured animals and 25% in uninjured animals). At 7 dpt, hCNS-SCns numbers had not changed significantly from 1 dpt levels in injured (5,303 ± 1,463) or uninjured (16,910 ± 2,898) mice, and the significant difference in total hCNS-SCns number between injured and uninjured groups persisted (p < 0.01). By 14 dpt, significantly higher hCNS-SCns numbers were observed in both injured (16,450 ± 3,334, p < 0.01) and uninjured (35,210 ± 3,466, p < 0.01) mice in comparison with 7 dpt. Injured mice still retained fewer hCNS-SCns than uninjured mice (p < 0.01) at 14 dpt. hCNS-SCns number in injured mice at 28 dpt was not significantly different from that at 14 dpt (25,640 ± 4,320); however, hCNS-SCns number in uninjured mice had increased significantly (123,100 ± 25,450, p < 0.05). Nonetheless, the 28 dpt hCNS-SCns number in injured mice was again significantly increased in comparison with both 1 and 7 dpt (p < 0.001, p < 0.001), and hCNS-SCns in injured mice continued to be significantly lower than in uninjured mice (p < 0.01). At 98 dpt, injured spinal cord still had a significantly decreased number of hCNS-SCns compared with uninjured spinal cord (214,900 ± 36,380 versus 319,700 ± 11,950, respectively; p < 0.05). Finally, hCNS-SCns number had significantly increased in both injured and uninjured groups in comparison with 28 dpt (p < 0.001, p < 0.001).
Figure 3.

Stereological Quantification of hCNS-SCns Engraftment and Migration
(A) Total number of engrafted hCNS-SCns 1, 7, 14, 28, and 98 dpt. Statistics: two-way ANOVA followed by Bonferroni’s multiple comparison test. ∗/∗∗/∗∗∗ denote comparisons between groups (uninjured versus injured) at a specific time point. #/##/### denote comparisons between time points within one group (uninjured or injured). ∗/#p < 0.05, ∗∗/##p < 0.01, ∗∗∗/###p < 0.001.
(B–F) Normalized localization of hCNS-SCns at 1 (B), 7 (C), 14 (D), 28 (E), and 98 (F) dpt. Red line, injury epicenter; gray lines, transplant sites. Negative distances are rostral and positive distances are caudal to the injury epicenter, which is defined as zero. Statistics: two-way repeated-measures ANOVA followed by Bonferroni’s multiple comparison test. ∗p < 0.05, ∗∗p < 0.01, ∗∗∗p < 0.001. All graphs are means ± SEM from n ≥ 6 animals/group.
See also Figures S2 and S7.
The differences in engraftment numbers in injured versus uninjured spinal cord over time suggested that differential expansion was occurring. To test this hypothesis, we performed a comparative best-fit analysis between a straight line (linear) and second-order polynomial (quadratic) equation on the engraftment numbers over time. From 1 to 28 dpt, engraftment in injured mice best fit a straight line (linear) model (R2 = 0.9261), whereas engraftment in uninjured mice best fit a second-order polynomial (quadratic) model (R2 = 0.9993). However, from 1 to 98 dpt, both injured and uninjured mice fit a second-order polynomial (quadratic) model (R2 = 0.9994 and R2 = 0.9848, respectively). Taken together, these data suggest that hCNS-SCns expansion began later in the injured microenvironment.
Although CC3 was detected in mouse cells at early time points, CC3 was not found to be colocalized with SC121+ hCNS-SCns at any of the assessed time points (Figure S1). These data suggest that the human cells did not undergo significant apoptotic cell death, even 24 hr after injection. However, these data also suggest that a relatively small percentage of the initially transplanted hCNS-SCns survived after injection into the uninjured spinal cord, and may have been further reduced by microenvironmental factors in injured mice. Despite this observation, a steady, significant increase in total hCNS-SCns number was observed in both groups over time. Additionally, the hCNS-SCns number increased at a greater rate in the uninjured spinal cord during the first 28 dpt, suggesting increased proliferation during this time. These data would support an engraftment paradigm similar to the second paradigm (extensive cell loss followed by increased proliferation) in Figure 1A. In contrast, the total number of hCNS-SCns between 28 and 98 dpt increased 2.6-fold in the uninjured spinal cord, compared with 8.4-fold in the injured spinal cord. These data suggest that hCNS-SCns either expanded at a greater rate in the injured spinal cord or were lost in the uninjured spinal cord in the interim.
hCNS-SCns Migration Is Altered in the Injured Spinal Cord in a Time-Dependent Manner
Stereological quantification of hCNS-SCns provided positional data that allowed us to assess hCNS-SCns migration at 1, 7, 14, 28, and 98 dpt (Figures 3B–3F). Two-way repeated-measures ANOVA revealed a significant main effect for distance on cell number (p < 0.001) and an interaction effect for group, suggesting that the injured spinal cord microenvironment altered hCNS-SCns migration in a time-dependent manner. Because hNCS-SCns engraftment was lower in the injured spinal cord at all time points, we normalized the raw migration data (Figure S2) to the total cell number to more accurately compare hCNS-SCns distribution along the rostral-caudal axis (Figure 3). Analysis of the normalized distribution data demonstrated that injury did not influence the distribution of hCNS-SCns at 1, 7, 14, or 28 dpt. However, at 98 dpt, we identified a significant difference in the distribution of hCNS-SCns between injured and uninjured spinal cords (p < 0.01; Figure 3F). In the injured spinal cord, there was a shift to a greater percentage of hCNS-SCns (∼20%) residing 1 mm rostral and caudal to the injury epicenter, with lower percentages of hCNS-SCns found distal to this region. Therefore, although the distribution of subacutely transplanted hCNS-SCns was not modulated by injury in the first 28 dpt, hCNS-SCns at 98 dpt were differentially localized near the epicenter of the injured spinal cord, suggesting that the spatiotemporal profile of proliferation and migration of human cells was altered in the injured spinal cord.
hCNS-SCns Proliferation Is Altered in the Injured Spinal Cord
We investigated changes in hCNS-SCns proliferation via terminal BrdU incorporation at 1, 7, 14, and 28 dpt in injured and uninjured mice (Figure 4A). Two-way ANOVA identified a significant interaction for both time (p < 0.001) and the presence of an injury (p < 0.01), suggesting that hCNS-SCns proliferation was altered in the injured spinal cord. NG2+ glial progenitors, astrocytes, microglia, and macrophages (McTigue et al., 2001; Zai and Wrathall, 2005) have been reported to proliferate extensively in the early postinjury period. Our data corroborate extensive host cell proliferation at this time point (SC121−/BrdU+; Figure 2). However, virtually no hCNS-SCns were mitotically active (SC121+/BrdU+) at 1 dpt in either injured or uninjured mice (0.7% ± 0.2% versus 0.4% ± 0.3%). At 7 dpt, the proliferation of hCNS-SCns remained unchanged in injured mice (1.7% ± 0.8%), but had increased significantly in uninjured mice (6.6% ± 1.3%, p < 0.001). Consequently, hCNS-SCns proliferation in injured mice at 7 dpt was significantly lower than in uninjured mice (p < 0.01). At 14 dpt, hCNS-SCns proliferation had not significantly changed in injured (2.4% ± 0.5%) or uninjured (5.3% ± 0.9%) mice in comparison with 7 dpt. However, hCNS-SCns proliferation still remained significantly lower in injured mice compared with uninjured mice (p < 0.05). At 28 dpt, neither injured nor uninjured hCNS-SCns proliferation had changed significantly in comparison with 14 dpt (6.8% ± 2.6% and 10.9% ± 3.8%, respectively). However, 28 dpt, hCNS-SCns proliferation had significantly increased in comparison with 1 dpt in injured mice (p < 0.05). Finally, no significant difference between hCNS-SCns proliferation was detected between injured and uninjured mice at 28 dpt, the longest terminal BrdU time point assessed.
Figure 4.

Stereological Quantification of Proliferation and Migration of Proliferating hCNS-SCns
(A) Percentage of BrdU+ hCNS-SCns at 1, 7, 14, and 28 dpt. Statistics: two-way ANOVA followed by Bonferroni’s multiple comparison test. ∗/∗∗/∗∗∗ denote comparisons between groups (uninjured versus injured) at a specific time point. #/##/### denote comparisons between time points within one group (uninjured or injured). ∗/#p < 0.05, ∗∗/##p < 0.01, ∗∗∗/###p < 0.001.
(B–F) Normalized localization of BrdU+ hCNS-SCns at 1 (B), 7 (C), 14 (D), 28 (E), and 98 (F) dpt. Data obtained at 1, 7, 14, and 28 dpt reflect a terminal BrdU pulse, and those obtained at 98 dpt reflect cumulative BrdU pulses. Red line, injury epicenter; gray lines, transplant sites. Negative distances are rostral and positive distances are caudal to the injury epicenter, which is defined as zero. Statistics: two-way repeated-measures ANOVA followed by Bonferroni’s multiple comparison test. ∗p < 0.05, ∗∗p < 0.01, ∗∗∗p < 0.001. All graphs are means ± SEM from n ≥ 6 animals/group.
See also Figures S3 and S5–S7.
In order to evaluate whether hCNS-SCns proliferation remained comparable between injured and uninjured mice for the term of the experiment, we quantified KI67 expression at 98 dpt. KI67 is a commonly used proliferation marker that is present during G1, S, G2, and M phases of the cell cycle, but absent from resting G0 cells (Sawhney and Hall, 1992; Hurelbrink et al., 2002). In parallel with BrdU incorporation data at 28 dpt, we found no significant difference in the percentage of hCNS-SCns expressing nuclear KI67 in the injured or uninjured spinal cord at 98 dpt (10.9% ± 0.8% versus 11.0% ± 2.2%, respectively; Figures S3A and S3B).
In parallel, we found no evidence of tumor formation in any animals that received hCNS-SCns. Importantly, although ∼10% of cells were immunopositive for KI67 98 dpt, KI67 expression overestimates the number of actively dividing cells, as quiescent cells can exhibit KI67 expression at sites of RNA synthesis (Gerdes et al., 1984; Bullwinkel et al., 2006). Furthermore, because KI67 is expressed in G1, S, G2, and M phase, it is detected in a larger proportion of cells than specific M or S phase markers (e.g., phosphohistone-3 (PH3) or BrdU, respectively) (Kill, 1996; Starborg et al., 1996; Tanaka et al., 2011). To address this issue, we performed triple immunolabeling for SC121, KI67, and PH3, which revealed that only a small subpopulation of KI67 cells were indeed PH3+ (1%–3%; Figures S3C–S3F). Furthermore, triple immunolabeling for SC121 and KI67 in conjunction with neural lineage markers (Figure S4) revealed that only OLIG2+ hCNS-SCns were also KI67+. These data suggest that the level of active hCNS-SCns proliferation at 98 dpt was minimal, significantly lower than that identified by KI67 labeling, and restricted to cells in a progenitor/precursor pathway, indicating lineage commitment rather than maintenance as a multipotent stem cell population.
Finally, to assess the overall effect of the injured microenvironment on hCNS-SCns proliferation, we investigated cumulative BrdU incorporation after weekly administration until sacrifice at 98 dpt (Figure S5). We identified a significant decrease in BrdU incorporation in hCNS-SCns over the 98 days of engraftment in the injured versus the uninjured spinal cord (16.2% ± 1.9% versus 30.9% ± 2.0% respectively; p < 0.001). Taken together, these data suggest that the initial reduction in hCNS-SCns proliferation within the first 28 dpt in the injured compared with the uninjured microenvironment created a cumulative overall deficit in hCNS-SCns proliferative activity across the entire survival period. Furthermore, these data support engraftment paradigm 2 (extensive cell loss followed by increased proliferation) proposed in Figure 1A.
Localization of hCNS-SCns Proliferation Is Altered in the Injured Spinal Cord
We next tested proliferation and migration dynamics (Figure 1B) by assessing the migration of proliferating hCNS-SCns, as visualized by terminal BrdU incorporation, at 1, 7, 14, and 28 dpt, as well as cumulative weekly BrdU incorporation at 98 dpt (Figures 4B–4F). We again normalized the raw migration data (Figure S6) to the total cell number to compare proliferating hCNS-SCns distribution along the rostral-caudal axis. Two-way repeated-measures ANOVA revealed a significant main effect for distance on cell number (p < 0.001) and an interaction effect for injury at the time points indicated below, suggesting that the localization of hCNS-SCns proliferation was altered in the injured spinal cord. At 1 dpt, the small number of proliferating hCNS-SCns observed were closely localized to the initial injection site (Figure 4B), regardless of whether the spinal cord was injured or not. However, at 7 dpt (p < 0.01; Figure 4C), 14 dpt (p < 0.001; Figure 4D), and 28 dpt (p < 0.05; Figure 4E), the distance at which proliferating hCNS-SCns were observed relative to the initial injection site was significantly decreased in injured animals. By 28 dpt, proliferating hCNS-SCns were found up to 2 mm distal to the injury epicenter in the injured spinal cord versus 4 mm in the uninjured spinal cord. Following weekly BrdU administration, the cumulative percentage of BrdU+ hCNS-SCns at 98 dpt (Figure 4F) in the injured spinal cord remained lower than in the uninjured spinal cord (p < 0.001), and a smaller percentage of proliferating cells was found to be migrating along the length of the injured spinal cord. Taken together, these data suggest that the dynamics of hCNS-SCns proliferation and migration were altered by the injured microenvironment, such that proliferation occurred near the site of transplantation and prior to migration in the injured spinal cord (paradigm 1 in Figure 1B), as opposed to multiple waves alternating with migration in the uninjured spinal cord (paradigm 2 in Figure 1B). These differences resulted in a cumulative shift in the localization of human cells as illustrated in Figure S7.
The Majority of hCNS-SCns Differentiate into the Oligodendrocytic Lineage, Regardless of Injury
Next, to test the hypothesis that the injured microenvironment would alter hCNS-SCns differentiation, we investigated the percentage of hCNS-SCns that expressed markers for the oligodendrocytic (OLIG2), astrocytic (SC123), and neuronal (DCX) lineages at 98 dpt (Figure 5D). A reduced percentage of hCNS-SCns expressing OLIG2+ was detected in injured versus uninjured spinal cord (45.6% ± 6.0% versus 67.5% ± 4.7%, respectively; p < 0.05). No differences in the percentages of hCNS-SCns expressing SC123 (9.1% ± 1.0% versus 8.9% ± 2.5%, n.s.) or DCX (17.2% ± 2.3% versus 15.6% ± 2.6%, n.s.), were detected in injured versus uninjured spinal cord. These data suggest that the injured microenvironment altered oligodendroglial differentiation, but the majority of hCNS-SCns still differentiated along the oligodendrocytic lineage.
Figure 5.
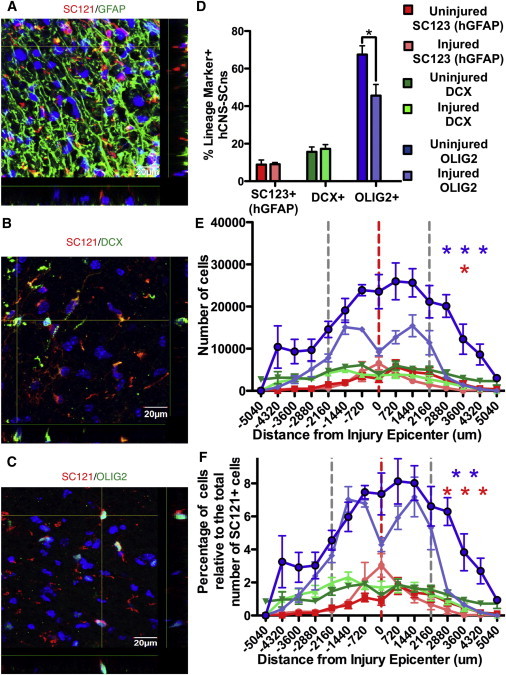
Stereological Quantification of hCNS-SCns Differentiation and Migration of Specific Lineages
(A–C) Representative confocal images of spinal cords fluorescently immunolabeled for SC121 in conjunction with GFAP (A), Dcx (B), and OLIG2 (C). Scale bar, 20 μm.
(D) Percentage of hCNS-SCns in astrocytic, neuronal, and oligodendrocytic lineages in uninjured versus injured spinal cords at 98 dpt. Statistics: two-tailed Student’s t test.
(E) Raw localization of hCNS-SCns in astrocytic, neuronal, and oligodendrocytic lineages in uninjured versus injured spinal cords at 98 dpt.
(F) Normalized localization of hCNS-SCns in astrocytic, neuronal, and oligodendrocytic lineages in uninjured versus injured spinal cords at 98 dpt. Red line, injury epicenter; gray lines, transplant sites. Negative distances are rostral and positive distances are caudal to the injury epicenter, which is defined as zero. Statistics: two-way repeated-measures ANOVA followed by Bonferroni’s multiple comparison test. ∗p < 0.05, ∗∗p < 0.01, ∗∗∗p < 0.001. All graphs are means ± SEM from n ≥ 6 animals/group.
See also Figure S4.
The Migration of hCNS-SCns Differentiating along the Oligodendrocytic and Astrocytic Lineages Is Altered in the Injured Spinal Cord
Next, we investigated how the injured microenvironment altered the migration and distribution of specific hCNS-SCns fates at 98 dpt (Figure 5E). A significant decrease in the number of OLIG2+ hCNS-SCns was found at all distances along the spinal cord of injured animals in comparison with uninjured animals (p < 0.001); however, no difference was seen in DCX+ hCNS-SCns number or distribution. A significant spike in the number of GFAP+ hCNS-SCns was present at the lesion epicenter of injured mice versus naive mice (p < 0.05); otherwise, there was no difference between groups. As described above, to better compare the distribution data, we normalized the stereological counts to the total hCNS-SCns number. Analysis of normalized data (Figure 5F) revealed that the localization of OLIG2+ hCNS-SCns in the injured cord was significantly altered by injury (p < 0.01), exhibiting localized peaks around the injury epicenter, as opposed to an even rostral-caudal distribution in the uninjured spinal cord. No difference in DCX+ hCNS-SCns was observed between groups. However, a significant increase in the percentage of SC123+ hCNS-SCns was present in injured animals directly at the injury epicenter (p < 0.001), nearly proportional to the decrease in the percentage of OLIG2+ cells. 3D reconstructions of representative animals from stereology data sets are presented in Figure 6. These data suggest that the injured microenvironment influenced the localized recruitment of differentiated astrocytic lineage hCNS-SCns at the expense of the oligodendrocytic lineage.
Figure 6.
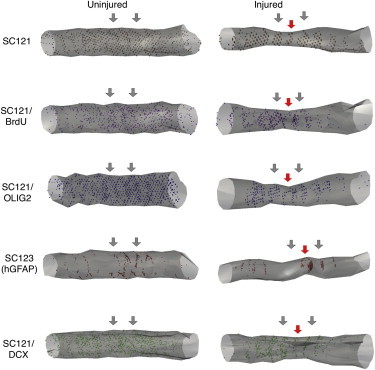
3D Reconstructions of hCNS-SCns Engraftment, Proliferation, and Differentiation
3D reconstructions of hCNS-SCns engraftment, proliferation, and differentiation into oligodendrocytic, astrocytic, and neuronal lineages at 98 dpt in uninjured and injured spinal cords. Red arrows, injury epicenter; blue arrows, transplant sites.
Oligodendrocytic Maturation of hCNS-SCns Is Increased in the Injured Spinal Cord
Finally, we assessed the coverage of lineage markers (SC123, DCX, and OLIG2) for hCNS-SCns differentiation. We found that 71.9% of hCNS-SCns in the injured spinal cord versus 92.0% in the uninjured spinal cord were accounted for by these three markers (Figure 7A), which suggested the potential for a missing population of hCNS-SCns in the injured spinal cord. Based on the differential OLIG2+ hCNS-SCns localization in the injured spinal cord (Figures 5E and 5F), we hypothesized that a population of hCNS-SCns in the oligodendrocytic lineage could have eluded detection by OLIG2 quantification alone. Nuclear OLIG2 expression is predominantly expressed in precursors/progenitors (Nishiyama et al., 2009; Emery, 2010b), suggesting that a more mature population of oligodendrocytes of hCNS-SCns origin could be missed by OLIG2 quantification. Hence, we quantified the percentage of hCNS-SCns expressing APC-CC1 (Figure 7B), a more mature oligodendrocyte marker, at 98 dpt. We found a significant difference between oligodendrocytic maturation in the injured and uninjured spinal cords, with 25.5% APC/CC1+ hCNS-SCns detected in the injured spinal cord versus 0.7% APC/CC1+ hCNS-SCns detected in the uninjured spinal cord (p < 0.001; Figure 7C). When we added APC/CC1 percentages into our lineage marker sums (Figure 7D), the percentage of cells accounted for increased from 71.9% to 97.4%. These data suggest that, on the whole, the injured microenvironment shifted hCNS-SCns in the oligodendrocytic lineage to a more mature, APC/CC1+ phenotype.
Figure 7.
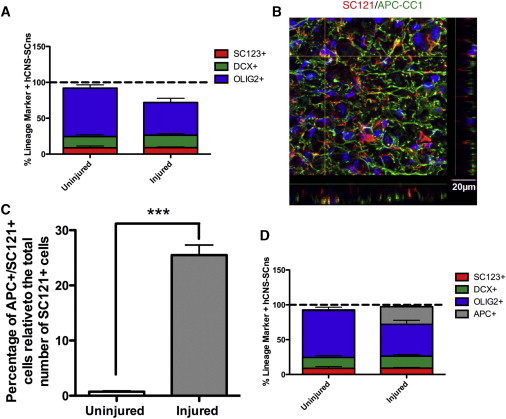
Summation of Stereologically Quantified hCNS-SCns Lineage Analysis and Quantification of Oligodendrocytic Maturation
(A) Summation of stereologically quantified hCNS-SCns in astrocytic (SC123, red), neuronal (DCX, green), and oligodendrocytic (OLIG2, blue) lineages at 98 dpt.
(B) Representative confocal immunofluorescent image for SC121 (red) in conjunction with APC-CC1 (green). Scale bar, 20 μm.
(C) Quantification of oligodendrocytic maturation of hCNS-SCns (APC+/SC121+) at 98 dpt. Statistics: two-tailed Student’s t test. ∗∗∗p < 0.001.
(D) Summation of stereologically quantified hCNS-SCns in astrocytic (SC123, red), neuronal (DCX, green), early oligodendrocytic (OLIG2, blue), and late oligodendrocytic (APC-CC1, gray) lineages at 98 dpt. All graphs are means ± SEM from n = 3 animals/group.
Discussion
In this study, we systematically assessed the detailed kinetics of NSC survival, migration, proliferation, and differentiation in the injured versus uninjured microenvironment, an issue that has received little attention in previous studies despite rapid advances in stem cell transplantation research. We report that the injured microenvironment (1) reduced initial cell survival, but was permissive for expansion of total engraftment to 2–3 times the initial cell dose; (2) delayed early cell proliferation, which resulted in a cumulative reduction in proliferative activity; (3) shifted proliferation to occur closer to the lesion in the injured spinal cord, as opposed to along the length of the uninjured spinal cord; (4) limited the rostral/caudal migration of cells; (5) increased differentiation into more mature oligodendrocytes; and (6) increased the proportion of astrocytes and oligodendrocytes proximal to the injury epicenter.
In the SCI field, subacute NSC transplantation time points (7–10 dpi) have been postulated to increase survival by avoiding acute inflammation (Okano et al., 2003) and have persisted as a paradigm for the majority of preclinical studies (Tetzlaff et al., 2011). The data presented here demonstrate that although the injured microenvironment at subacute time points may play a role in survival, the majority of subacutely transplanted cells did not survive at 1 dpt, even in an uninjured spinal cord. Recent studies have identified a prominent role for biomechanical disruption during the injection process in determining early survival of injected cells (Aguado et al., 2012). Taken together, these data suggest that early survival of transplanted NSC populations may be more dependent on transplantation parameters than on postinjury transplantation timing. However, differences in the injured microenvironment at different postinjury time points may still regulate the engraftment dynamics.
Between 1 dpt and 98 dpt, the total number of hCNS-SCns increased dramatically in both the injured and uninjured spinal cords (15-fold and 20-fold, respectively) when calculated relative to the number of surviving cells and not transplantation dose. Despite this observation, hCNS-SCns proliferation in the injured spinal cord was delayed for the first 28 dpt, an effect that may be influenced by multiple factors. For example, inflammation, including toll-like receptor (TLR) activation, can inhibit NSC proliferation (Das and Basu, 2008; Ekdahl et al., 2009; Okun et al., 2010; Taylor et al., 2010) and is altered in a spatiotemporal manner after SCI (Anderson, 2002; Popovich and Jones, 2003; Anderson et al., 2004; Fleming et al., 2006; Kigerl et al., 2007; Kigerl and Popovich, 2009; Beck et al., 2010). Similarly, chondroitin sulfate proteoglycans (CSPGs) in the injured spinal cord have been shown to diminish the proliferation of both transplanted (Karimi-Abdolrezaee et al., 2010) and endogenous (Karimi-Abdolrezaee et al., 2012; Karus et al., 2012) NSCs.
Between 28 dpt and 98 dpt, hCNS-SCns number increased 8-fold in the injured spinal cord, compared with 2-fold in the uninjured spinal cord. Again, these data could be the result of multiple nonmutually exclusive mechanisms. First, although hCNS-SCns proliferation was equivalent at both 28 dpt and 98 dpt, proliferation may have been differentially regulated in the interim period, which would not have been detected in the cumulative BrdU incorporation paradigm employed in the 98 dpt cohort. Alternatively, there could have been decreased long-term survival of hCNS-SCns in the uninjured spinal cord during this period. Many newborn cells in the dentate gyrus and subventricular zone die within 4 weeks after birth, presumably as a result of failing to functionally integrate into circuitry (Zhao et al., 2008). Thus, it is possible that hCNS-SCns in the uninjured spinal cord, which in contrast to the injured spinal cord may lack appropriate sites for integration, were pruned in the period between 28 dpt and 98 dpt. Future studies utilizing intermediate time points or advances in noninvasive cell-tracking methods (Li et al., 2010) could elucidate these mechanisms.
Despite robust proliferation, there was no evidence of tumor formation in any animal that received hCNS-SCns. At 98 dpt, we identified that ∼10% of hCNS-SCns expressed KI67, which is slightly higher than values reported in previous studies using similar transplantation paradigms (1%–5%) (Yan et al., 2007; Ogawa et al., 2009; Nori et al., 2011). However, those studies did not utilize stereological sampling methods, which preclude direct comparisons with the work presented here. Furthermore, the majority of transplanted cells in those studies exhibited neuronal lineage differentiation. In contrast, we found that the majority of hCNS-SCns differentiated along the oligodendroglial lineage, and that human cells expressing KI67+ also exhibited labeling for OLIG2, supporting the lineage commitment of this cell population by 98 dpt. Oligodendrocyte precursor cells proliferate extensively in both intact and injured spinal cords (Barnabé-Heider et al., 2010; Payne et al., 2013), which may suggest that transplanted hCNS-SCns respond to similar cues.
hCNS-SCns migration was extensive, detected by 1 week following transplantation, and altered by the injured microenvironment. Injury induced transplanted hCNS-SCns to remain closer to the SCI epicenter, which has been reported in other cases of CNS trauma and degeneration (Connor et al., 2011; Leong and Turnley, 2011). As in the case of cell survival, inflammatory chemokines and cytokines can regulate NSC migration (Connor et al., 2011). Alternatively, CSPGs could also play a role in hCNS-SCns migration/localization (Kearns et al., 2003; Ikegami et al., 2005; Karimi-Abdolrezaee et al., 2010, 2012). Surprisingly, we found that hCNS-SCns migrated in an evenly distributed manner over even longer distances in the uninjured compared with the injured microenvironment. NSC migration in adult, intact CNS is typically inhibited by regulators (e.g., netrin-1) outside of specialized sites (e.g., the rostral migratory stream) (Petit et al., 2007). Taken together, these data suggest the potential for transplanted hCNS-SCns to overcome migratory repulsion, allowing for greater surveillance of the transplantation niche. Molecular dissection of these interactions could permit manipulation of the injured spinal cord or transplanted NSCs to allow for even greater migration and repair.
Our data demonstrate that proliferation and migration occurred in waves from the site of transplantation in the uninjured spinal cord (Figure 1B, paradigm 2), as opposed to predominantly near the lesion epicenter in the injured spinal cord (Figure 1B, paradigm 1). This suggests that injury shifted the dynamics of hCNS-SCns migration and proliferation from one paradigm to another. Many factors, including FGF, Wnts, BMPs, and Shh, are altered following SCI and could mediate this effect, given their established roles in NSC proliferation in the CNS (Ulloa and Briscoe, 2007; Sabo et al., 2009; Fernández-Martos et al., 2011).
We also found that SCI altered the localization of specific hCNS-SCns fates along the axis of the spinal cord. hCNS-SCns retained a more immature, OLIG2+ phenotype in the uninjured spinal cord and migrated in a long and even distribution (Figure 6), whereas this population was found predominantly in the region 1–2 mm from the lesion epicenter in the injured spinal cord. This suggests that hCNS-SCns in the injured spinal cord were recruited to perilesional sites based on region- and niche-specific cues.
Finally, our OLIG2 and APC/CC1 data demonstrated that hCNS-SCns acquired a more mature oligodendrocyte phenotype in injured spinal cord by 98 dpt. These data suggest that transplanted hCNS-SCns responded not only to localization cues but also to maturation cues specific to the injured spinal cord. Although the mechanisms of oligodendrocyte maturation remain incompletely understood, multiple regulators, such as axonally expressed ligands, secreted molecules, and neuronal activity, have been identified (Emery, 2010a) and all may be present in the injured spinal cord microenvironment. The uninjured spinal cord may lack these signals, presenting a fundamentally different niche resulting in restricted maturation. In summary, these findings could have profound significance for the field of regenerative medicine, as they suggest the capacity of multipotent cells to respond dynamically to the microenvironment in a niche-specific manner.
Experimental Procedures
Ethics Statement
All animal housing conditions, surgical procedures, and postoperative care were in accordance with the guidelines of the Institutional Animal Care and Use Committee of the University of California, Irvine.
hNSC Isolation and Culture
The derivation, culture, and characterization of hCNS-SCns were described previously (Uchida et al., 2000), and the methods and lines used in this study are identical to those described in previous publications (Cummings et al., 2005; Hooshmand et al., 2009; Salazar et al., 2010; Piltti et al., 2013a, 2013b). Briefly, hCNS-SCns were propagated as neurospheres in supplemented X-Vivo 15 media (Lonza). On the day of transplantation, cells at passage 9 were dissociated into single cells and triturated to a volume of 75,000 cells/μl in X-Vivo 15 media for transplantation.
Contusion Injuries, Cell Transplantation, and Behavior
For early hCNS-SCns engraftment-dynamics experiments, contusion SCIs followed by subacute hCNS-SCns transplantation into the intact parenchyma were performed as described previously (Cummings et al., 2005; Hooshmand et al., 2009). Briefly, adult female NOD-scid mice (Jackson) were anesthetized with isoflurane, received a T9 laminectomy using a surgical microscope, and either a 50 kD contusion injury using the Infinite Horizon Impactor (Precision Systems and Instrumentation) (n = 40), or no injury (n = 40). Animals were assessed behaviorally and histologically to ensure a lack of injury in the uninjured group. Eight animals were excluded prior to transplantation due to death or spinal cord bruising during laminectomy procedures, one animal was excluded prior to transplantation due to a contusion injury greater than 50 kD, two animals were excluded due to injury during relaminectomy/transplantation, and one animal was excluded mid-study due to the development of kyphosis. Animals were selected for exclusion by staff blinded to treatment groups in an unbiased manner based on exclusion criteria established pre-hoc for all experiments.
Nine days after SCI/laminectomy, the mice were reanesthetized and 250 nl of freshly triturated hCNS-SCns were injected at four sites, two rostral and two caudal to the site of injury (for a total of 1 μl), via a Nanoinjector (WPI Instruments) using pulled glass pipettes with a 70 μm ID and 110 μm OD (Sutter Instruments). A total of 75,000 cells were transplanted. Mice were randomized into the following groups for sacrifice: 1 dpt (inj. = 8, uninj. = 8), 7 dpt (inj. n = 9, uninj. n = 8), 14 dpt (inj. n = 8, uninj. n = 10), and 28 dpt (inj. n = 7, uninj. n = 10). 50 mg/kg BrdU in 0.9% NaCl solution was administered intraperitoneally to all animals 20 hr and 6 hr prior to sacrifice.
For long-term hCNS-SCns engraftment experiments at 98 dpt, the above injury and transplantation paradigm was used (inj. n = 10, uninj. n = 10). 3 animals were excluded prior to transplantation due to death or spinal cord bruising during laminectomy procedures, 1 animal was excluded prior to transplantation due to a contusion injury greater than 50 kD, and 1 animal was excluded due to injury during re-laminectomy/transplantation. Animals were selected for exclusion by staff blinded to treatment groups as above. The final group numbers were inj. = 7 and uninj. = 8. 50 mg/kg BrdU in 0.9% NaCl solution was administered intraperitoneally to all animals 2 dpt and then weekly thereafter until sacrifice, 98 dpt.
Histology
Animals were anesthetized and transcardially perfused 1, 7, 14, 28, and 98 dpt with 4% paraformaldehyde. A T6-T12 segment of the spinal cord was dissected based on dorsal spine root counts and postfixed in 20% sucrose/4% paraformaldehyde overnight. Tissue was frozen in isopentane at −65°C and sectioned at 30 μm coronally in a cryostat using a CryoJane tape transfer system. Tissue was processed for antigen retrieval using Buffer A (pH = 6) in the EMS Retriever 2100 system.
Immunostaining was performed using an anti-mouse human-specific cytoplasmic marker, SC121 (StemCells, 1:1,000), anti-mouse human-specific astrocytic marker SC123 (StemCells, 1:1,000), anti-goat DCX (Santa Cruz, 1:100), anti-rat BrdU (Ab Serotec, 1:250), anti-goat OLIG2 (Abcam, 1:500), anti-goat APC-CC1 (Abcam, 1:500), anti-rabbit KI67 (Novacastra, 1:500), and anti-rabbit cleaved caspase-3 (Cell Signaling, 1:5,000). Biotin-conjugated secondary antibodies were used at a dilution of 1:500 (Jackson) and labeling was visualized using an ABC Kit in conjunction with DAB and SG Vector Blue (Vector Labs). DAB was used for all human-specific labeling and SG Vector Blue was used for fate and proliferative markers. For single-labeled sections, hematoxylin was utilized in conjunction with DAB for proper cell identification.
Immunofluorescent staining was performed as above with Alexa-Fluor 488, 555, and 647 conjugated secondary antibodies at a dilution of 1:500 in conjunction with DAPI (Invitrogen, 1:1,000).
Stereological Quantification
All quantification was performed using the optical fractionator probe in StereoInvestigator (Microbrightfield) by individuals blinded to the groups on an Olympus IX51 microscope with a 60× 1.4NA oil objective. Six animals per group were counted for each marker using parameters empirically determined to achieve low coefficients of error (CE) (Table S1).
Nonlinear Regression—Curve Fit—Analysis
Mean engraftment numbers determined by stereological quantification at 1, 7, 14, 28, and 98 dpt were subjected to a nonlinear regression (curve fit) analysis in Prism (v 5.0a). Each data set was compared with a straight line (linear) or second order polynomial (quadratic) using an extra sum of F-squares test set at a threshold of p = 0.05 to determine the best fit. R2 vales for the best-fit model were reported.
Migration Calculations
Stereological quantification data were used to determine migration distances. The number of markers counted at a given section distance was expressed as a percentage of the total numbers of markers counted. This allowed for an estimate of the percentage of a given marker at set sampling distances throughout the region of spinal cord analyzed (T6–T12). The same six animals used for stereological quantification were used for migration calculations.
Statistical Analyses
All means are expressed ± SEM. For in vivo stereological quantification, a one-way ANOVA was used with Dunnett post hoc analysis. For in vivo migrational analyses, two-way repeated-measures ANOVA with Bonferroni post hoc analysis was used. Prism (version 5.0a) was used for statistical analysis; significance was defined as p < 0.05.
Acknowledgments
The authors thank Rebecca Nishi, Hongli-Liu, Chelsea Pagan, and Lindy Gunawan of the Christopher & Dana Reeve Foundation Animal Injury Core (UCI) for assistance in animal surgeries. We also thank Amir Abuchaei, Ted Zaki, Kevin Huang, and Nicole Midani for assistance in tissue processing and quantification and Dongping He and Robert Tushinski for cell preparation. This work was supported by the National Institutes of Health (NS007444-7 to C.J.S. and NS049885 to A.J.A.) and the Christopher & Dana Reeve Foundation (to A.J.A.). N.U. is an employee of StemCells, Inc.
Footnotes
This is an open access article under the CC BY-NC-ND license (http://creativecommons.org/licenses/by-nc-nd/3.0/).
Supplemental Information
References
- Aguado B.A., Mulyasasmita W., Su J., Lampe K.J., Heilshorn S.C. Improving viability of stem cells during syringe needle flow through the design of hydrogel cell carriers. Tissue Eng. Part A. 2012;18:806–815. doi: 10.1089/ten.tea.2011.0391. [DOI] [PMC free article] [PubMed] [Google Scholar]
- Anderson A.J. Mechanisms and pathways of inflammatory responses in CNS trauma: spinal cord injury. J. Spinal Cord Med. 2002;25:70–79. doi: 10.1080/10790268.2002.11753604. discussion 80. [DOI] [PubMed] [Google Scholar]
- Anderson A.J., Robert S., Huang W., Young W., Cotman C.W. Activation of complement pathways after contusion-induced spinal cord injury. J. Neurotrauma. 2004;21:1831–1846. doi: 10.1089/neu.2004.21.1831. [DOI] [PubMed] [Google Scholar]
- Barnabé-Heider F., Göritz C., Sabelström H., Takebayashi H., Pfrieger F.W., Meletis K., Frisén J. Origin of new glial cells in intact and injured adult spinal cord. Cell Stem Cell. 2010;7:470–482. doi: 10.1016/j.stem.2010.07.014. [DOI] [PubMed] [Google Scholar]
- Beck K.D., Nguyen H.X., Galvan M.D., Salazar D.L., Woodruff T.M., Anderson A.J. Quantitative analysis of cellular inflammation after traumatic spinal cord injury: evidence for a multiphasic inflammatory response in the acute to chronic environment. Brain. 2010;133:433–447. doi: 10.1093/brain/awp322. [DOI] [PMC free article] [PubMed] [Google Scholar]
- Bullwinkel J., Baron-Lühr B., Lüdemann A., Wohlenberg C., Gerdes J., Scholzen T. Ki-67 protein is associated with ribosomal RNA transcription in quiescent and proliferating cells. J. Cell. Physiol. 2006;206:624–635. doi: 10.1002/jcp.20494. [DOI] [PubMed] [Google Scholar]
- Christopher & Dana Reeve Foundation. (2009). Prevalence of paralysis including spinal cord injuries in the United States. http://www.christopherreeve.org/site/c.mtKZKgMWKwG/b.5184255/k.6D74/Prevalence_of_Paralysis.htm.
- Connor B., Gordon R.J., Jones K.S., Maucksch C. Deviating from the well travelled path: precursor cell migration in the pathological adult mammalian brain. J. Cell. Biochem. 2011;112:1467–1474. doi: 10.1002/jcb.23086. [DOI] [PubMed] [Google Scholar]
- Cummings B.J., Uchida N., Tamaki S.J., Salazar D.L., Hooshmand M., Summers R., Gage F.H., Anderson A.J. Human neural stem cells differentiate and promote locomotor recovery in spinal cord-injured mice. Proc. Natl. Acad. Sci. USA. 2005;102:14069–14074. doi: 10.1073/pnas.0507063102. [DOI] [PMC free article] [PubMed] [Google Scholar]
- Cummings B.J., Uchida N., Tamaki S.J., Anderson A.J. Human neural stem cell differentiation following transplantation into spinal cord injured mice: association with recovery of locomotor function. Neurol. Res. 2006;28:474–481. doi: 10.1179/016164106X115116. [DOI] [PubMed] [Google Scholar]
- Cummings B.J., Hooshmand M.J., Salazar D.L., Anderson A.J. Human neural stem cell-mediated repair of the contused spinal cord: Timing the microenvironment. In: Ribak C., editor. From Development to Degneration and Regeneration of the Nervous System. Oxford University Press; New York: 2008. pp. 297–322. [Google Scholar]
- Das S., Basu A. Inflammation: a new candidate in modulating adult neurogenesis. J. Neurosci. Res. 2008;86:1199–1208. doi: 10.1002/jnr.21585. [DOI] [PubMed] [Google Scholar]
- Decimo I., Bifari F., Krampera M., Fumagalli G. Neural stem cell niches in health and diseases. Curr. Pharm. Des. 2012;18:1755–1783. doi: 10.2174/138161212799859611. [DOI] [PMC free article] [PubMed] [Google Scholar]
- Ekdahl C.T., Kokaia Z., Lindvall O. Brain inflammation and adult neurogenesis: the dual role of microglia. Neuroscience. 2009;158:1021–1029. doi: 10.1016/j.neuroscience.2008.06.052. [DOI] [PubMed] [Google Scholar]
- Emery B. Regulation of oligodendrocyte differentiation and myelination. Science. 2010;330:779–782. doi: 10.1126/science.1190927. [DOI] [PubMed] [Google Scholar]
- Emery B. Transcriptional and post-transcriptional control of CNS myelination. Curr. Opin. Neurobiol. 2010;20:601–607. doi: 10.1016/j.conb.2010.05.005. [DOI] [PubMed] [Google Scholar]
- Fernández-Martos C.M., González-Fernández C., González P., Maqueda A., Arenas E., Rodríguez F.J. Differential expression of Wnts after spinal cord contusion injury in adult rats. PLoS ONE. 2011;6:e27000. doi: 10.1371/journal.pone.0027000. [DOI] [PMC free article] [PubMed] [Google Scholar]
- Fleming J.C., Norenberg M.D., Ramsay D.A., Dekaban G.A., Marcillo A.E., Saenz A.D., Pasquale-Styles M., Dietrich W.D., Weaver L.C. The cellular inflammatory response in human spinal cords after injury. Brain. 2006;129:3249–3269. doi: 10.1093/brain/awl296. [DOI] [PubMed] [Google Scholar]
- Gerdes J., Lemke H., Baisch H., Wacker H.H., Schwab U., Stein H. Cell cycle analysis of a cell proliferation-associated human nuclear antigen defined by the monoclonal antibody Ki-67. J. Immunol. 1984;133:1710–1715. [PubMed] [Google Scholar]
- Hooshmand M.J., Sontag C.J., Uchida N., Tamaki S., Anderson A.J., Cummings B.J. Analysis of host-mediated repair mechanisms after human CNS-stem cell transplantation for spinal cord injury: correlation of engraftment with recovery. PLoS ONE. 2009;4:e5871. doi: 10.1371/journal.pone.0005871. [DOI] [PMC free article] [PubMed] [Google Scholar]
- Hurelbrink C.B., Armstrong R.J., Dunnett S.B., Rosser A.E., Barker R.A. Neural cells from primary human striatal xenografts migrate extensively in the adult rat CNS. Eur. J. Neurosci. 2002;15:1255–1266. doi: 10.1046/j.1460-9568.2002.01959.x. [DOI] [PubMed] [Google Scholar]
- Ikegami T., Nakamura M., Yamane J., Katoh H., Okada S., Iwanami A., Watanabe K., Ishii K., Kato F., Fujita H. Chondroitinase ABC combined with neural stem/progenitor cell transplantation enhances graft cell migration and outgrowth of growth-associated protein-43-positive fibers after rat spinal cord injury. Eur. J. Neurosci. 2005;22:3036–3046. doi: 10.1111/j.1460-9568.2005.04492.x. [DOI] [PubMed] [Google Scholar]
- Karimi-Abdolrezaee S., Eftekharpour E., Wang J., Schut D., Fehlings M.G. Synergistic effects of transplanted adult neural stem/progenitor cells, chondroitinase, and growth factors promote functional repair and plasticity of the chronically injured spinal cord. J. Neurosci. 2010;30:1657–1676. doi: 10.1523/JNEUROSCI.3111-09.2010. [DOI] [PMC free article] [PubMed] [Google Scholar]
- Karimi-Abdolrezaee S., Schut D., Wang J., Fehlings M.G. Chondroitinase and growth factors enhance activation and oligodendrocyte differentiation of endogenous neural precursor cells after spinal cord injury. PLoS ONE. 2012;7:e37589. doi: 10.1371/journal.pone.0037589. [DOI] [PMC free article] [PubMed] [Google Scholar]
- Karus M., Samtleben S., Busse C., Tsai T., Dietzel I.D., Faissner A., Wiese S. Normal sulfation levels regulate spinal cord neural precursor cell proliferation and differentiation. Neural Dev. 2012;7:20. doi: 10.1186/1749-8104-7-20. [DOI] [PMC free article] [PubMed] [Google Scholar]
- Kearns S.M., Laywell E.D., Kukekov V.K., Steindler D.A. Extracellular matrix effects on neurosphere cell motility. Exp. Neurol. 2003;182:240–244. doi: 10.1016/s0014-4886(03)00124-9. [DOI] [PubMed] [Google Scholar]
- Kigerl K.A., Popovich P.G. Toll-like receptors in spinal cord injury. Curr. Top. Microbiol. Immunol. 2009;336:121–136. doi: 10.1007/978-3-642-00549-7_7. [DOI] [PubMed] [Google Scholar]
- Kigerl K.A., Lai W., Rivest S., Hart R.P., Satoskar A.R., Popovich P.G. Toll-like receptor (TLR)-2 and TLR-4 regulate inflammation, gliosis, and myelin sparing after spinal cord injury. J. Neurochem. 2007;102:37–50. doi: 10.1111/j.1471-4159.2007.04524.x. [DOI] [PubMed] [Google Scholar]
- Kill I.R. Localisation of the Ki-67 antigen within the nucleolus. Evidence for a fibrillarin-deficient region of the dense fibrillar component. J. Cell Sci. 1996;109:1253–1263. doi: 10.1242/jcs.109.6.1253. [DOI] [PubMed] [Google Scholar]
- Leong S.Y., Turnley A.M. Regulation of adult neural precursor cell migration. Neurochem. Int. 2011;59:382–393. doi: 10.1016/j.neuint.2010.12.024. [DOI] [PubMed] [Google Scholar]
- Li S.C., Tachiki L.M., Luo J., Dethlefs B.A., Chen Z., Loudon W.G. A biological global positioning system: considerations for tracking stem cell behaviors in the whole body. Stem Cell Rev. 2010;6:317–333. doi: 10.1007/s12015-010-9130-9. [DOI] [PMC free article] [PubMed] [Google Scholar]
- McTigue D.M., Wei P., Stokes B.T. Proliferation of NG2-positive cells and altered oligodendrocyte numbers in the contused rat spinal cord. J. Neurosci. 2001;21:3392–3400. doi: 10.1523/JNEUROSCI.21-10-03392.2001. [DOI] [PMC free article] [PubMed] [Google Scholar]
- Nishiyama A., Komitova M., Suzuki R., Zhu X. Polydendrocytes (NG2 cells): multifunctional cells with lineage plasticity. Nat. Rev. Neurosci. 2009;10:9–22. doi: 10.1038/nrn2495. [DOI] [PubMed] [Google Scholar]
- Nori S., Okada Y., Yasuda A., Tsuji O., Takahashi Y., Kobayashi Y., Fujiyoshi K., Koike M., Uchiyama Y., Ikeda E. Grafted human-induced pluripotent stem-cell-derived neurospheres promote motor functional recovery after spinal cord injury in mice. Proc. Natl. Acad. Sci. USA. 2011;108:16825–16830. doi: 10.1073/pnas.1108077108. [DOI] [PMC free article] [PubMed] [Google Scholar]
- Ogawa D., Okada Y., Nakamura M., Kanemura Y., Okano H.J., Matsuzaki Y., Shimazaki T., Ito M., Ikeda E., Tamiya T. Evaluation of human fetal neural stem/progenitor cells as a source for cell replacement therapy for neurological disorders: properties and tumorigenicity after long-term in vitro maintenance. J. Neurosci. Res. 2009;87:307–317. doi: 10.1002/jnr.21843. [DOI] [PubMed] [Google Scholar]
- Okano H., Ogawa Y., Nakamura M., Kaneko S., Iwanami A., Toyama Y. Transplantation of neural stem cells into the spinal cord after injury. Semin. Cell Dev. Biol. 2003;14:191–198. doi: 10.1016/s1084-9521(03)00011-9. [DOI] [PubMed] [Google Scholar]
- Okun E., Griffioen K.J., Son T.G., Lee J.H., Roberts N.J., Mughal M.R., Hutchison E., Cheng A., Arumugam T.V., Lathia J.D. TLR2 activation inhibits embryonic neural progenitor cell proliferation. J. Neurochem. 2010;114:462–474. doi: 10.1111/j.1471-4159.2010.06778.x. [DOI] [PMC free article] [PubMed] [Google Scholar]
- Payne S.C., Bartlett C.A., Savigni D.L., Harvey A.R., Dunlop S.A., Fitzgerald M. Early proliferation does not prevent the loss of oligodendrocyte progenitor cells during the chronic phase of secondary degeneration in a CNS white matter tract. PLoS ONE. 2013;8:e65710. doi: 10.1371/journal.pone.0065710. [DOI] [PMC free article] [PubMed] [Google Scholar]
- Petit A., Sellers D.L., Liebl D.J., Tessier-Lavigne M., Kennedy T.E., Horner P.J. Adult spinal cord progenitor cells are repelled by netrin-1 in the embryonic and injured adult spinal cord. Proc. Natl. Acad. Sci. USA. 2007;104:17837–17842. doi: 10.1073/pnas.0703240104. [DOI] [PMC free article] [PubMed] [Google Scholar]
- Piltti K.M., Salazar D.L., Uchida N., Cummings B.J., Anderson A.J. Safety of epicenter versus intact parenchyma as a transplantation site for human neural stem cells for spinal cord injury therapy. Stem Cells Transl. Med. 2013;2:204–216. doi: 10.5966/sctm.2012-0110. [DOI] [PMC free article] [PubMed] [Google Scholar]
- Piltti K.M., Salazar D.L., Uchida N., Cummings B.J., Anderson A.J. Safety of human neural stem cell transplantation in chronic spinal cord injury. Stem Cells Transl. Med. 2013;2:961–974. doi: 10.5966/sctm.2013-0064. [DOI] [PMC free article] [PubMed] [Google Scholar]
- Popovich P.G., Jones T.B. Manipulating neuroinflammatory reactions in the injured spinal cord: back to basics. Trends Pharmacol. Sci. 2003;24:13–17. doi: 10.1016/s0165-6147(02)00006-8. [DOI] [PubMed] [Google Scholar]
- Sabo J.K., Kilpatrick T.J., Cate H.S. Effects of bone morphogenic proteins on neural precursor cells and regulation during central nervous system injury. Neurosignals. 2009;17:255–264. doi: 10.1159/000231892. [DOI] [PubMed] [Google Scholar]
- Salazar D.L., Uchida N., Hamers F.P., Cummings B.J., Anderson A.J. Human neural stem cells differentiate and promote locomotor recovery in an early chronic spinal cord injury NOD-scid mouse model. PLoS ONE. 2010;5:e12272. doi: 10.1371/journal.pone.0012272. [DOI] [PMC free article] [PubMed] [Google Scholar]
- Sawhney N., Hall P.A. Ki67—structure, function, and new antibodies. J. Pathol. 1992;168:161–162. doi: 10.1002/path.1711680202. [DOI] [PubMed] [Google Scholar]
- Sontag C.J., Nguyen H.X., Kamei N., Uchida N., Anderson A.J., Cummings B.J. Immunosuppressants affect human neural stem cells in vitro but not in an in vivo model of spinal cord injury. Stem Cells Transl Med. 2013;2:731–744. doi: 10.5966/sctm.2012-0175. [DOI] [PMC free article] [PubMed] [Google Scholar]
- Starborg M., Gell K., Brundell E., Höög C. The murine Ki-67 cell proliferation antigen accumulates in the nucleolar and heterochromatic regions of interphase cells and at the periphery of the mitotic chromosomes in a process essential for cell cycle progression. J. Cell Sci. 1996;109:143–153. doi: 10.1242/jcs.109.1.143. [DOI] [PubMed] [Google Scholar]
- Tanaka R., Tainaka M., Ota T., Mizuguchi N., Kato H., Urabe S., Chen Y., Fustin J.M., Yamaguchi Y., Doi M. Accurate determination of S-phase fraction in proliferative cells by dual fluorescence and peroxidase immunohistochemistry with 5-bromo-2′-deoxyuridine (BrdU) and Ki67 antibodies. J. Histochem. Cytochem. 2011;59:791–798. doi: 10.1369/0022155411411090. [DOI] [PMC free article] [PubMed] [Google Scholar]
- Taylor D.L., Pirianov G., Holland S., McGinnity C.J., Norman A.L., Reali C., Diemel L.T., Gveric D., Yeung D., Mehmet H. Attenuation of proliferation in oligodendrocyte precursor cells by activated microglia. J. Neurosci. Res. 2010;88:1632–1644. doi: 10.1002/jnr.22335. [DOI] [PubMed] [Google Scholar]
- Tetzlaff W., Okon E.B., Karimi-Abdolrezaee S., Hill C.E., Sparling J.S., Plemel J.R., Plunet W.T., Tsai E.C., Baptiste D., Smithson L.J. A systematic review of cellular transplantation therapies for spinal cord injury. J. Neurotrauma. 2011;28:1611–1682. doi: 10.1089/neu.2009.1177. [DOI] [PMC free article] [PubMed] [Google Scholar]
- Uchida N., Buck D.W., He D., Reitsma M.J., Masek M., Phan T.V., Tsukamoto A.S., Gage F.H., Weissman I.L. Direct isolation of human central nervous system stem cells. Proc. Natl. Acad. Sci. USA. 2000;97:14720–14725. doi: 10.1073/pnas.97.26.14720. [DOI] [PMC free article] [PubMed] [Google Scholar]
- Ulloa F., Briscoe J. Morphogens and the control of cell proliferation and patterning in the spinal cord. Cell Cycle. 2007;6:2640–2649. doi: 10.4161/cc.6.21.4822. [DOI] [PubMed] [Google Scholar]
- Yan J., Xu L., Welsh A.M., Hatfield G., Hazel T., Johe K., Koliatsos V.E. Extensive neuronal differentiation of human neural stem cell grafts in adult rat spinal cord. PLoS Med. 2007;4:e39. doi: 10.1371/journal.pmed.0040039. [DOI] [PMC free article] [PubMed] [Google Scholar]
- Zai L.J., Wrathall J.R. Cell proliferation and replacement following contusive spinal cord injury. Glia. 2005;50:247–257. doi: 10.1002/glia.20176. [DOI] [PubMed] [Google Scholar]
- Zhao C., Deng W., Gage F.H. Mechanisms and functional implications of adult neurogenesis. Cell. 2008;132:645–660. doi: 10.1016/j.cell.2008.01.033. [DOI] [PubMed] [Google Scholar]
Associated Data
This section collects any data citations, data availability statements, or supplementary materials included in this article.