Abstract
The nuclear factor-κB (NF-κB) family of transcriptional regulators are central mediators of the cellular inflammatory response. Although constitutive NF-κB signaling is present in most human tumours, mutations in pathway members are rare, complicating efforts to understand and block aberrant NF-κB activity in cancer. Here, we show that more than two thirds of supratentorial ependymomas contain oncogenic fusions between RELA, the principal effector of canonical NF-κB signalling, and an uncharacterized gene, C11orf95. In each case, C11orf95-RELA fusions resulted from chromothripsis involving chromosome 11q13.1. C11orf95-RELA fusion proteins translocated spontaneously to the nucleus to activate NF-κB target genes, and rapidly transformed neural stem cells—the cell of origin of ependymoma—to form these tumours in mice. Our data identify the first highly recurrent genetic alteration of RELA in human cancer, and the C11orf95-RELA fusion protein as a potential therapeutic target in supratentorial ependymoma.
Introduction
Ependymomas are tumors of the brain and spinal cord1. Surgery and irradiation remains the mainstay of treatment of this disease since chemotherapy is ineffective in most patients. Consequently, ependymoma is incurable in up to 40% of cases2.
Although ependymomas from the different regions of the central nervous system (CNS) are histological similar, they possess site-specific prognoses, transcriptional profiles and DNA copy number alterations3–7, suggesting they are different diseases that are likely to require different treatments. Recently, we generated the first mouse model of supratentorial ependymoma by amplifying EPHB2 – a common DNA copy number alteration of these tumours – in mouse forebrain NSCs6. Preclinical studies using this model have identified new treatments that are now in clinical trial8. Drugs targeting genetic alterations in the other types of ependymoma could provide new therapies, but the identity of these alterations remains largely unknown.
The C11orf95-RELA translocation
To identify additional genetic alterations that drive ependymoma, we sequenced the whole genomes (WGS) of 41 tumours and matched normal blood, and the transcriptomes (RNAseq) of 77 tumours (Fig. 1; Extended Data Fig. 1; Tables S1–S3).
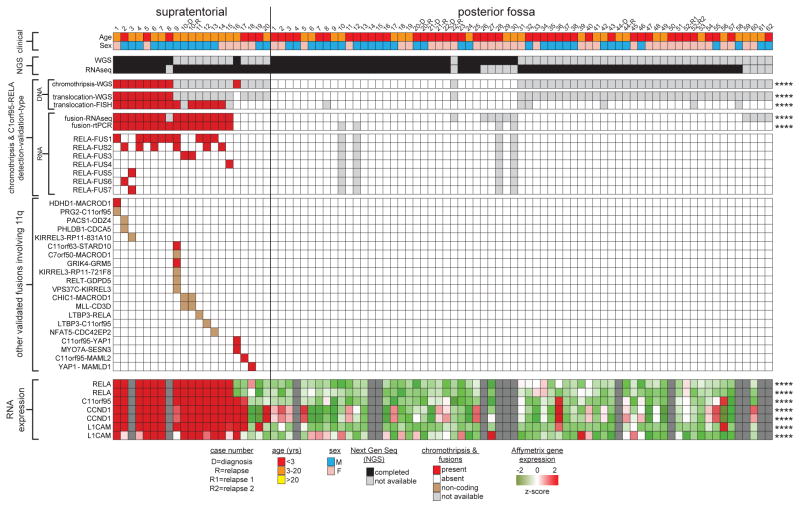
Figure 1. Recurrent C11orf95-RELA translocations in human supratentorial ependymoma.
Summary of results of molecular assays of translocations in tumours from 82 patients with ependymoma (****=P<0.0001 Fisher’s Exact Test for supratentorial vs. posterior fossa tumour). ‘RNA expression’ at bottom reports Affymetrix array data (****=Q<0.0001 for supratentorial vs. posterior fossa tumour).
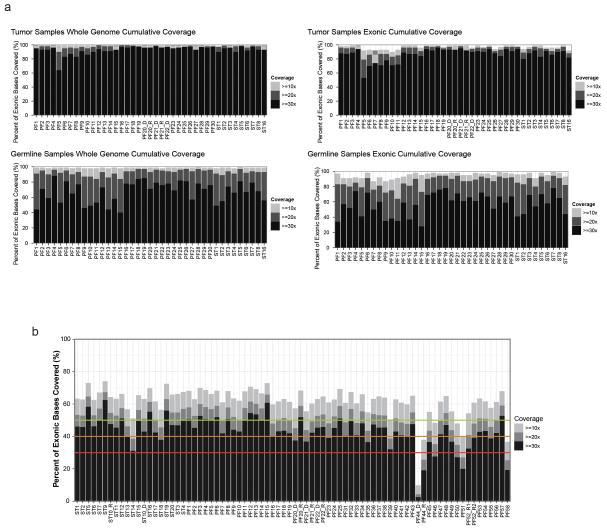
Extended Data Figure 1. Next Generation Sequencing Coverage of Ependymoma Samples.
(a) Coverage for whole-genome sequenced cases. Percent of the genome (left) and exome (right) covered at 10x, 20x, and 30x depth in tumour and germline samples. (b) RNASeq coverage. Coverage below the red line are considered poor quality; those with 20x above the green line are considered excellent.
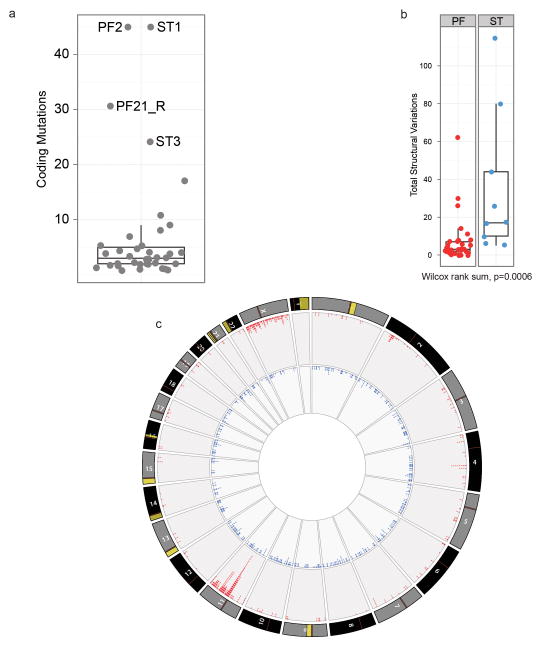
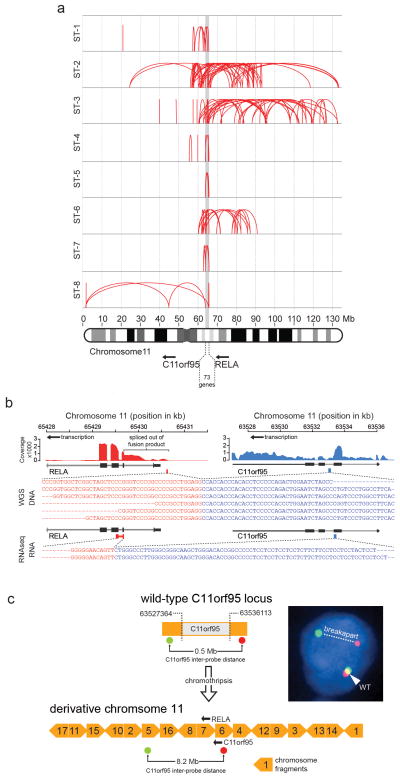
Single nucleotide variations, insertion/deletions, or focal (<5 genes) copy number variations were rare in ependymomas, but structural variations (SVs) were detected relatively frequently9, especially in supratentorial tumours (median SVs, supratentorial tumours=23 vs. posterior fossa tumours=7.5, P=0.0006, Wilcox rank; Extended Data Fig. 2a,b; Supplementary Results; Fig. S1–S7; Tables S4–S11). All nine supratentorial ependymomas analysed by WGS contained SVs that clustered within chromosome 11q12.1-q13.3, producing catastrophic disruption of the locus and an oscillating copy number state compatible with chromothripsis (chr11:50–60 Mb, FWER=9.6e−5 and chr11:60–70 Mb, FWER=7.8e−7, Mann-Whitney Test; Fig. 1; Extended Data Figs. 2c; Supplementary Results; Table S12)10. Although the chromothripsis region differed in each tumour, eight of the nine cases shared a common region (~63 to ~67 Mb) in which the reordered chromosome fragments fused a poorly characterized gene, C11orf95, to RELA, the principal effector of canonical NF-κB signalling11,12 (Extended Data Figs. 3 and 4a,b). These genes are normally separated by 1.9Mb containing 73 genes (Extended Data Fig. 4a; Figs. S8–S10; Table S1, S13). The C11orf95-RELA translocation was validated in all eight cases by independent orthogonal sequencing and interphase fluorescence in situ hybridization (FISH) using ‘break-apart’ probes to C11orf95 and RELA (Fig. 1; Extended Data Fig. 4c; Supplementary Methods; Figs. S8–S9; Table S14–S15). In stark contrast, neither chromothripsis nor C11orf95-RELA translocations were detected in any of the 32 posterior fossa tumours analysed by WGS (P<0.0001 Fisher’s Exact).
Extended Data Figure 2. Comparison of genomic aberrations among ependymomas analysed by Whole Genome Sequencing.
(a) The great majority of ependymomas have <10 coding SNV. Samples with >20 coding SNVs and their corresponding sample number from Fig. 1 are shown. (b) Comparison of total number of SVs in PF and ST samples (Wilcox rank sum, p=0.0006). (c) CIRCOS plot depicting SVs discovered across all supratentorial (red, outer plot) and posterior fossa (blue, inner plot) ependymomas. Each dot represents a validated or putative SV breakpoint detected by CREST in the WGS discovery cohort. Note the highly focal clustering of SVs on Chr11q in supratentorial ependymomas.
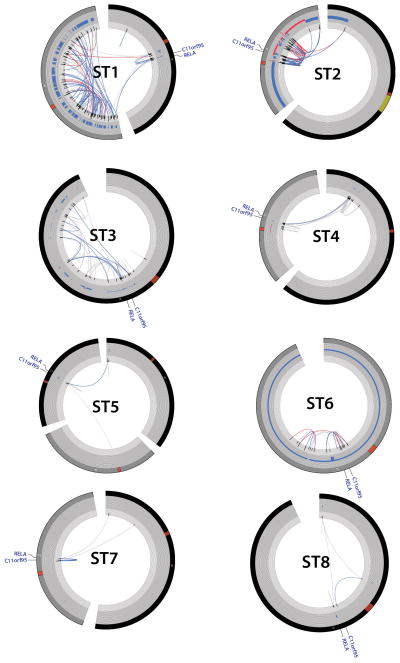
Extended Data Figure 3. Chromothripsis in supratentorial ependymomas resulting in C11orf95-RELA translocations.
CIRCOS plots for supratentorial the eight ST ependymomas analysed using WGS that contained C11orf95-RELA translocations (sample numbers as Fig 1). From the outer ring to the inner ring; chromosome, CNV calls, Softclip count histogram, SVs (red = both sides with >= 10, blue = one side with >10, grey < 10 supporting softclips on either side).
Extended Data Figure 4. C11orf95-RELA translocations.
(a) Breakpoints of structural rearrangements (red loops) at 11q13.1 in tumours ST1 to ST8. (b) Exemplary C11orf95-RELA translocation and fusion transcript in sample ST5. Top, RNAseq coverage; middle, DNA sequence across the fusion breakpoint; bottom, RNA sequence. (c) Derivative chromosome generated by chromothripsis in tumor ST6 highlighting the locations of C11orf95 ‘break-apart’ FISH probes. Yellow block arrows represent chromosome fragments rearranged by chromothripsis. Numbers indicate fragment order on normal chromosome 11. FISH result, right. Arrows=transcription orientation.
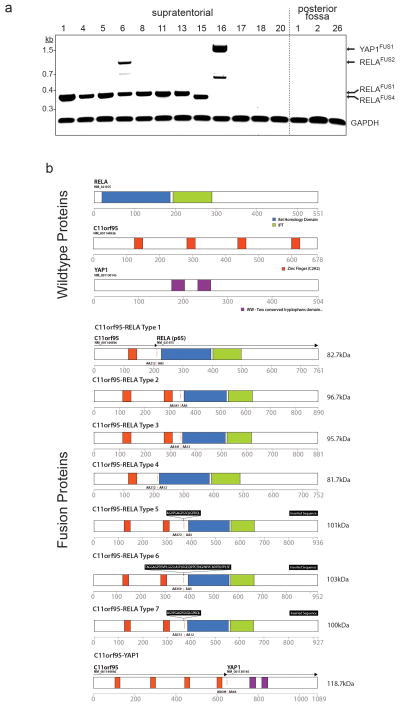
Next, using a novel algorithm, we looked for C11orf95-RELA fusion transcripts in the 77 ependymomas analysed by RNAseq (Fig. 1; Supplementary Methods). Fusion transcripts were validated by reverse transcriptase (rt) PCR and Sanger sequencing (Fig. 2a; Extended Data Fig. 5a). C11orf95-RELA transcripts were detected in all eight supratentorial tumours in which the translocation was detected by WGS (Fig. 1; Table S16a). Fusion transcripts were also detected in an additional seven supratentorial tumours: FISH detected the C11orf95-RELA translocation in six of these with available material (Fig. 1). C11orf95-RELA transcripts were not detected in supratentorial tumours that lacked the translocation or in any posterior fossa ependymomas (Fig. 1; P<0.0001, Fisher’s Exact).
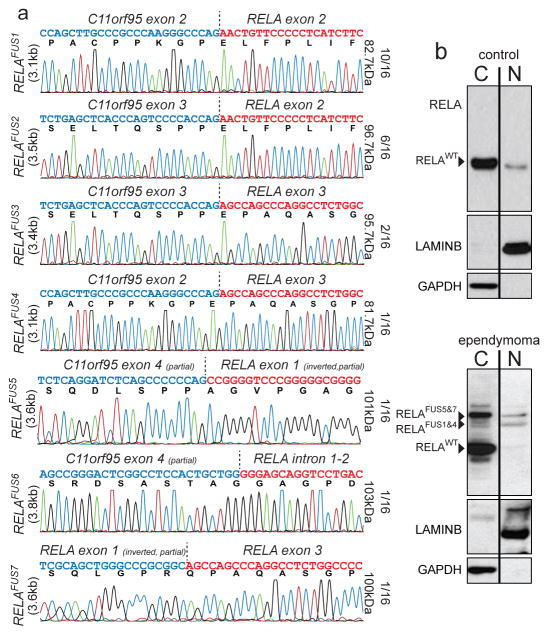
Figure 2. C11orf95-RELA fusion transcripts and proteins.
(a) Electropherograms of seven distinct RELA fusion transcripts detected in ependymoma. The proportion of tumours containing the corresponding fusion transcript, and the predicted protein product size are shown right. (b) Western blotting of RELA proteins in cytoplasmic and nuclear extracts of ‘control’ human 293T cells (top) and supratentorial ependymoma ST3 (bottom).
Extended Data Figure 5. Translocation fusions transcripts and predicted protein products detected in ependymoma.
(a) Reverse-transcriptast PCR products of the indicated transcripts detected in tumour samples (sample numbers as in Fig 1a). (b) Predicted protein products of wild-type translocation partners (top) and fusion products (bottom).
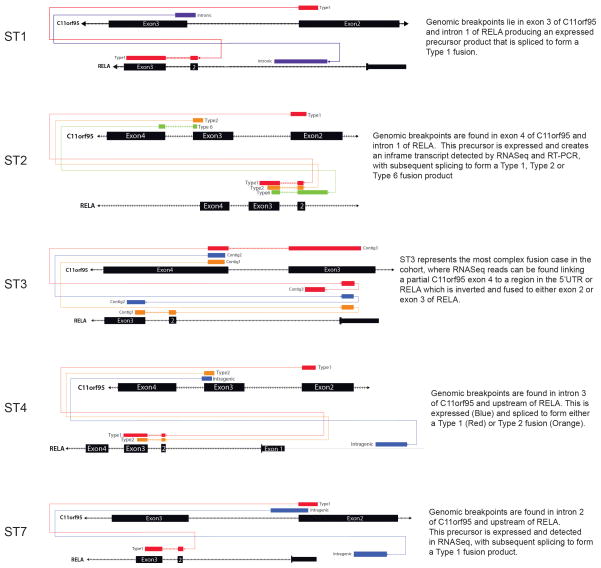
Translocation positive tumours contained mature, spliced, in-frame fusion transcripts together with premature fusion transcripts containing intronic or intergenic DNA breakpoints (Fig. 2a; Extended Data Figs. 4c and 6. See Supplementary Results and Fig. S10 for details of all fusion breakpoints). Thus, splicing is required to generate mature C11orf95-RELA transcripts. Seven distinct, mature C11orf95-RELA fusion transcripts were observed (Fig. 2a; Extended Data Fig. 5b). The most frequent included exons 1–2 of C11orf95 and, except of the first two codons, the entire open reading frame of RELA (hereon, RELAFUS1; Fig. 1 and 2a). Six other fusion transcripts (RELAFUS2-RELAFUS7) were detected less frequently, but each was observed in tumours lacking RELAFUS1, suggesting they may be oncogenic.
Extended Data Figure 6.
RNAseq contig maps demonstrating the various fusion products generated by splicing of the primary C110rf95-RELA translocation transcript.
Western blotting detected wild-type RELA (RELAWT) protein in supratentorial ependymoma ST3 and human control (293T) cells (Fig. 2b). ST3, but not control cells, also expressed at least four RELA-proteins that corresponded to the appropriately sized products of fusion transcripts detected in this tumour by RNAseq and rtPCR (Figs. 1 and 2b; Extended Data Fig. 6). RELA fusion and RELAWT proteins segregated differently in ST3 cells, with fusion products accumulating preferentially in the nucleus relative to the wild-type protein.
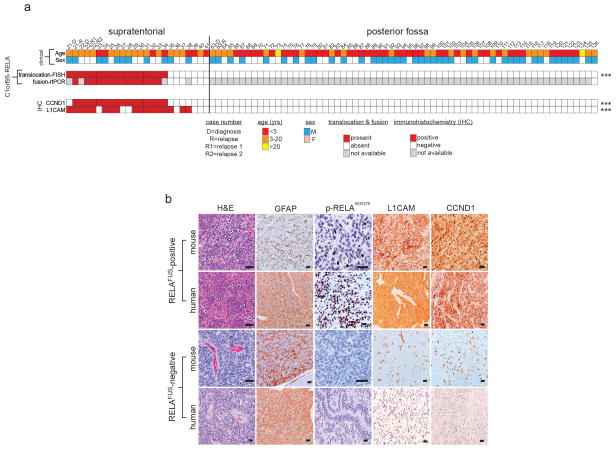
To further validate the C11orf95-RELA translocation we analysed a separate cohort of 89 formalin fixed paraffin embedded (FFPE) ependymomas using FISH and rtPCR (Extended Data Fig. 7; Table S1). FISH detected the C11orf95-RELA translocation in 67% (n=14/21) of primary FFPE supratentorial ependymomas, but in none of 64 posterior fossa tumours, and rtPCR confirmed the presence of fusion transcripts exclusively in translocation positive tumours (p<0.0001 Fishers exact; Extended Data Fig. 7a). These data identify C11orf95-RELA translocations as the most recurrent genetic alteration in ependymoma, affecting around 70% of supratentorial tumours (n=29/41) and occurring preferentially in older patients (mean age translocation-positive, translocation-negative supratentorial tumours=8.3±0.9years, 3.5±1.7years, respectively; P<0.05, Mann Whitney test, Fig. 1). We are currently interrogating a larger cohort of supratentorial ependymomas to assess the prognostic significance of the C11orf95-RELA translocation.
Extended Data Figure 7. Analysis of C11orf95-RELA translocation and expression in formalin fixed paraffin embedded (FFPE) human and mouse ependymoma.
(a) FFPE cohort (top) and results (middle) of break-apart FISH (bFISH) and rtPCR analysis of the C11orf95-RELA translocation and transcript, respectively. Tumors with ‘unavailable’ data had insufficient material for analysis. (b) GFAP, p-S276-RELA, CCND1 and L1CAM immunohistochemistry in human and mouse RELAFUS positive and negative cases. The mouse tumours recapitulate the ‘vascular-variant’ of human supratentorial ependymoma (see H&E). This subtype is characterized a branching network of capillaries (white arrows) and cytoplasmic clearing (black arrows). ***=p<0.0005. Scale bar=50μm
RNAseq identified 20 other fusion transcripts involving 11q (Fig. 1; Fig. S11; Table S16b,c). Thirteen occurred in tumours containing C11orf95-RELA and are predicted to be non-coding, suggesting they are ‘passenger’ events. However, four of seven ‘coding’ fusion transcripts occurred in ependymomas that lacked a C11orf95-RELA translocation. Two of these fused C11orf95 to alternative transcriptional regulators: C11orf95-YAP1 and C11orf95-MAML2 (Fig. 1; Extended Data Fig. 5b). Thus, the zinc finger domains of C11orf95 are likely to be essential oncogenic elements of these fusions, possibly altering the trafficking, degradation or target specificity of partner transcription factors.
C11orf95-RELA drives NF-κB signalling
The NF-κB family of transcriptional regulators are central mediators of the cellular inflammatory response13. Although constitutive NF-κB signaling is present in most human tumours, mutations in pathway members are rare, complicating efforts to understand and block aberrant NF-κB activity in cancer14–16. Therefore we looked to see if C11orf95-RELA fusions drive aberrant NF-κB signaling in ependymoma.
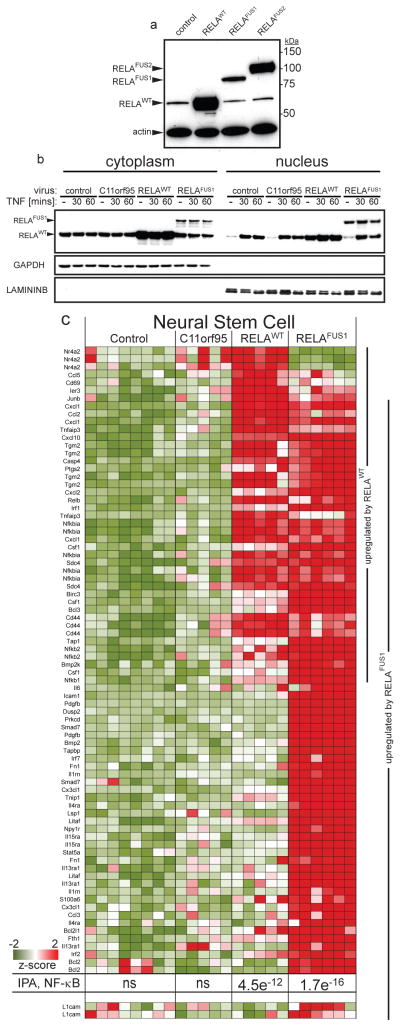
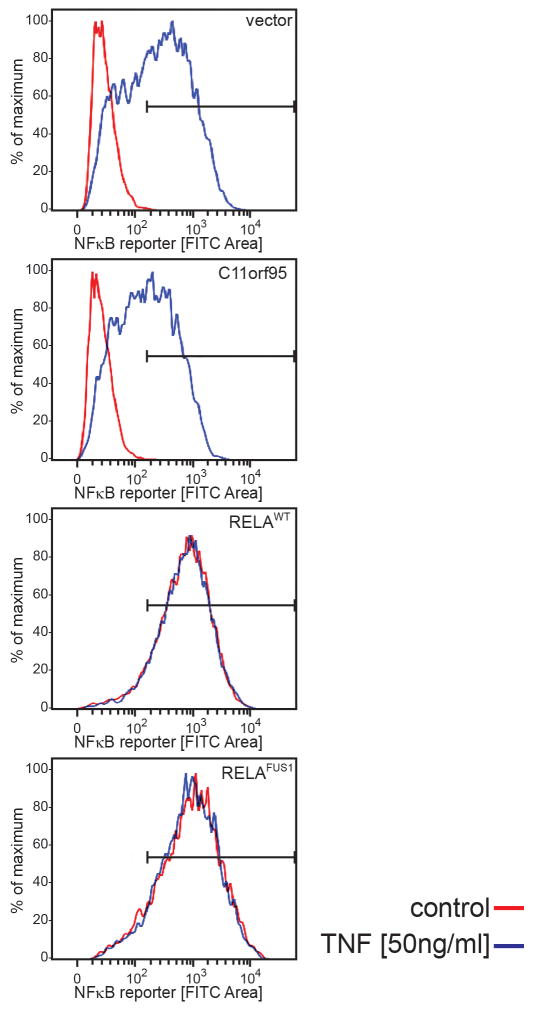
RNAseq and Affymetrix gene expression profiling detected increased expression of C11orf95 and RELA in translocation positive ependymomas, as well as high-levels of CCND1 – a direct transcriptional target of NF-κB signalling17,18 – and L1CAM which is associated with aberrant cell-cell adhesion, invasion, and NF-κB activation in tumours19,20 (Q<0.0001; Fig. 1). CCND1 and L1CAM protein expression were also strongly associated with the C11orf95-RELA translocation in FFPE supratentorial ependymomas (p<0.0001, Fisher’s Exact; Extended Data Fig. 7a,b). Upstream stimuli e.g., Tumor Necrosis Factor (TNF), activate the NF-κB pathway by causing RELA containing heterodimers to translocate to the nucleus and drive gene transcription13. But RELA fusion proteins appear to accumulate preferentially in the nucleus of ependymoma cells relative to RELAWT protein (Fig. 2b). Therefore, we examined RELA protein trafficking in cells engineered to express exogenous C11orf95, RELAWT or RELAFUS1 (Fig. 3a). As expected, endogenous RELAWT was sequestered in the cytoplasm of unstimulated control and C11orf95 transduced cells, but translocated to the nucleus to activate an NF-κB transcriptional reporter following exposure to TNF (Fig. 3b; Extended Data Fig. 8). Conversely, overexpression of RELAWT resulted in spontaneous nuclear translocation and NF-κB transcription, supporting the notion that high levels of wild-type RELA can overwhelm the IκB inhibitory system21. Therefore, we titrated down the expression of the RELAFUS1 fusion to approximate that of endogenous RELAWT. Even at this reduced level, RELAFUS1 translocated spontaneously to the nucleus and activated NF-κB transcription (Fig. 3b; Extended Data Fig. 8).
Figure 3. Cell trafficking and transcriptional activity of wild-type and fusion RELA proteins.
(a) RELA western blotting of 293T cells transduced with the indicated retroviruses. (b) Western blotting of RELA proteins in cytoplasmic and nuclear extracts of 293T cells transduced with the indicated virus, treated with TNF [50ng/ml]. (c) Expression of NF-κB target genes upregulated in mouse NSCs transduced by the indicated retrovirus. P-value of NF-κB pathway activation detected by IPA and expression of L1cam are shown bottom (see Supplementary Methods for source of target genes).
Extended Data Figure 8. C11orf95-RELA fusion protein spontaneously activates an NF-kB transcriptional reporter.
NF-kB-green fluorescence reporter (GFP) activity in 293T cells transduced with the indicated virus, treated for 60 mins with TNF [50ng/ml] or vehicle control.
Next, we looked to see if C11orf95-RELA drives an aberrant NF-κB transcriptional program in mouse NSCs that we have shown previously serve as cells-of-origin of ependymoma6 (Fig. 3c). Neither control nor C11orf95 transduction altered gene expression in NSCs; but exogenous RELAWT upregulated 20% (n=25/129) of a series of validated NF-κB target genes in NSCs, and Ingenuity Pathway Analysis (IPA) confirmed highly-significant activation of NF-κB signaling in these cells (IPA P=4.5e-12; Supplementary Methods & Results; Table S17). Expression of RELAFUS1 produced even greater activation of NF-κB target genes in NSCs, and also upregulated L1cam (IPA, p=1.7e−16, Fig. 3c; Fig. S12; Table S17). Although L1cam has been reported to activate NF-κB signaling in tumours16,17, our NSC and tumour data suggest that it may itself be a target of aberrant C11orf95-RELA signaling (Figs. 1, 3c; Extended Data Fig. 7b). RELAFUS1 had a profound impact on the expression of several other genes that regulate focal adhesion, compatible with the notion that aberrant NF-κB signaling disrupts cell-cell adhesion in cancer13,19 (Q=1.5e−10, Table S18b).
C11orf95-RELA drives ependymoma
To test the transforming capacity of RELA fusion proteins, we isolated NSCs from Ink4a/Arfnull Blbp-eGFP transgenic mice as described6, and transduced these with either C11orf95-Red Fluorescence Protein (C11orf95RFP), RELAWT-RFP, RELAFUS1-RFP or RELAFUS2-RFP retroviruses. To begin to understand the relevance of the other fusions detected in ependymoma we also implanted NSCs transduced with C11orf95-YAP1 (YAP1FUS-RFP), or wild-type YAP1 (YAPWT-RFP). 1.5x10⁶ RFP+ NSCs transduced with each virus were implanted separately into the cerebrum of 15 female, 6 week old, CD1-nude mice each. C11orf95RFP, RELAWT-RFP, or YAP1WT-RFP NSCs formed very few or no brain tumours in mice (median follow up 155 days; Fig. 4a). In stark contrast, all mice implanted with RELAFUS1-RFP NSCs succumbed within 20 days to brain tumors that recapitulated the ‘clear cell’ and finely branched vasculature characteristic of ‘vascular-variant” human supratentorial ependymoma22 (P<0.0001 Log-Rank; Fig. 4a; Extended Data Fig. 7b). Similar to their human counterpart, mouse RELAFUS1 ependymomas expressed nuclear phospho-S276-RELA that is indicative of, and required for, RELA transcriptional activity23–25, as well as CCND1 and L1CAM (Extended Data Fig. 7a,b). Consistent with the human disease, nuclei of mouse RELAFUS1 ependymomas also accumulated RELAFUS1 protein relative to the wild-type protein (Figs. 2b, 4b Extended Data Fig. 7b). RELAFUS2-RFP NSCs also generated tumors, albeit with a lower penetrance (n=10/15 mice) and longer latency (median survival 68 days) than RELAFUS1-RFP NSCs, potentially explaining the biased selection of RELAFUS1 vs. RELAFUS2 in human ependymomas. YAP1FUS-RFP NSCs formed brain tumours with high efficiency, indicating that other ependymoma translocations are oncogenic (Fig. 4a).
Figure 4. C11orf95-RELA and C11orf95-YAP1 fusions drive brain tumourigenesis.
(a) Survival curves of mice implanted with the indicated NSCs. (***=p<0.0001, Log Rank relative to control NSCs). (b) Western blotting of RELA proteins in cytoplasmic and nuclear extracts of nine independent mouse RELAFUS1-RFP brain tumours. (c) Expression of NF-κB target genes significantly upregulated in RELAFUS1-RFP relative to EPHB2WT-RFP brain tumours. Bottom, p-value of NF-κB activation detected by IPA.
Finally, to determine if C11orf95-RELA drives a specific, oncogenic NF-κB transcription program, we compared the transcriptomes of mouse RELAFUS1-RFP brain tumours with those of our supratentorial ependymoma mouse model driven by EPHB2 (ref.6). RELAFUS1-RFP mouse brain tumours displayed marked upregulation of NF-κB target genes (IPA, P=1.6e-17; Fig. 4c; Fig. S13). Conversely, EPHB2WT-RFP mouse ependymomas expressed much lower levels of phospho-SER276-RELA, L1CAM, and CCND1 proteins and lacked NF-κB signal activation. Thus C11orf95-RELA translocations are potent oncogenes that most likely transform NSCs by driving an aberrant NF-κB transcription program.
Aberrant NF-κB signalling is an established driver of solid tumours, but genetic evidence of pathway involvement has been lacking. We identify the first, highly-recurrent genetic alteration to activate RELA, the principal effector of canonical NF-κB signalling, in human cancer. We further show that C11orf95 is likely to be an essential partner in these translocations, possibly disrupting the cell trafficking of RELA and other partner transcription factors. We are currently investigating the mechanism by which RELA fusion proteins transform NSCs, and their potential to serve as a therapeutic target.
Methods summary
Human tumour and matched blood samples were obtained with informed consent through an institutional review board approved protocol at St Jude Children’s Research Hospital. Whole genome sequencing (WGS), RNA sequencing, and analysis of all sequence data were performed as previously described26. Details of sequence coverage, custom capture and other validation procedures are provided in Supplementary Information (Supplementary Tables S2–S6). Sequence and array data were deposited in European Bioinformatics Institute (EBI accession EGAS00001000254). Interphase FISH, immunohistochemistry of human and mouse tissues, western blotting, and RT-PCR were performed using standard techniques as described (Supplementary Methods). Human and mouse mRNA profiles were generated using Affymetrix U133Plus and 430v2 arrays, respectively (Supplementary Methods). NSCs were isolated and transduced with indicated retro- and lentiviruses in stem cell cultures as described (Supplementary Information)4,6,27. All mouse studies were conducted according to institution approved Animal Care and Usage Committee protocols. NSCs were implanted under stereotactic control into the forebrain of immunocompromised mice and tumour growth monitored clinically and by bioluminescence8. All mouse brains were inspected by macroscopic dissection post-mortem. Fresh tumour cells were recovered from mouse brains as described6.
Methods
Patient samples
Ependymomas collected under informed consent were obtained from the St. Jude Children’s Research Hospital (SJCRH) tissue resource core facility and the Children’s Oncology Group (COG) through SJCRH and COG Institutional Review Board approved protocols. Tissue samples were snap-frozen and / or formalin fixed and paraffin embedded (FFPE) at the time of resection. DNA and RNA were extracted from frozen tissue and peripheral blood leukocytes. Forty-one samples were submitted for whole genome sequencing (WGS), and 77 samples underwent transcriptome sequencing (RNASeq; Table S1). An additional 89 FFPE ependymomas were screened for structural variations (Table S1). Criteria for submission of a tumour sample for WGS were a minimum of 5μg of tumour DNA and a minimum of 5μg of matching peripheral white blood cell DNA. Quant-iT PicoGreen (Invitrogen) assay was used to quantify double stranded genomic DNA for sequencing. Basic clinical data for all patients providing tumour samples is summarized in Supplementary Table S1.
Next Generation Sequencing
Whole genome sequencing
All methods employed for library construction and WGS have been described previously (see Supplementary Information). Methods employed for WGS mapping, coverage and quality assessment, single nucleotide variations (SNV) / indel detection, tier annotation for sequence mutations, prediction of deleterious effects of missense mutations, structural variations and identification of loss-of-heterozygosity have been described (see Supplementary Information; Fig. S1–S2).
Copy number variations (CNVs) were identified by evaluating the difference of read depth for each tumour and its matching normal DNA using the novel algorithm CONSERTING (COpy Number SEgmentation by Regression Tree In Next-Gen sequencing, see Supplementary Information; Fig. S3). Confidence for a CNV segment boundary was determined using a series of criteria, including: length of flanking segments, difference of CNV between neighboring segments, presence of sequence gaps on the reference genome, presence of structural variation (SV) breakpoints, and any CNV in the matching germline sample. CNV were also detected using SNP 6.0 arrays that were used as an additional quality control step for WGS (Fig. S4).
Chromothripsis
Korbel and Campbell (Supplementary Information) recently proposed four criteria that define chromothripsis: (1) clustering of breakpoints; (2) randomness of DNA fragment joins; (3) randomness of DNA fragment order; and (4) ability to walk the derivative chromosome. Since randomness of DNA fragment order (Criteria 3) was not entirely valid based on Korbel and Campbell’s own analysis, we decided not to evaluate this feature. For all structural variations (SVs) with at least 1 breakpoint on chromosome 11, we performed Bartlett’s goodness-of-fit test for exponential distribution to assess whether the distribution of SV breakpoints in each tumor departs from the null hypothesis of random distribution. A significant departure from random distribution supports clustering of SV breakpoints. To evaluate whether there is any bias in the DNA fragment joints categorized by the SV types (i.e. deletion, tandem duplication, head-to-head re-arrangements and tail-to-tail re-arrangements), we applied goodness-of-fit tests separately for inter- and intra- chromosomal events with a minimum of 5 SVs. A significant p value suggests biased fragment joins, which would not support chromothripsis. When both inter- and intra- chromosomal data are available, we reported the lower p value to represent a more conservative assessment of the random distribution for DNA fragment joints.
RNA sequencing
Paired-end sequencing was performed using the Illumina Genome Analyzer IIx or HighSeq platform with 100-bp read length. The resulting paired-end reads were aligned to four databases using Burrows-Wheeler Aligner (BWA 0.5.5): (i) human NCBI Build 37 reference sequence, (ii) RefSeq, (iii) a sequence file that represents all possible combinations of non-sequential pairs in RefSeq exons, and (iv) AceView flat file (UCSC), representing transcripts constructed from human expressed sequence tags (ESTs). After this initial mapping, final BAM files were produced by selecting the best alignment in the four databases. Structural variation detection was carried out using CREST. Additionally, to identify fusion transcripts from RNA-Seq we created an application called “CICERO” (Cicero Is Crest Extended for RNA Optimizations), a local assembly-based method that utilizes unmapped and soft-clipped reads. CICERO assembles reads around breakpoints and maps the contig to the genome to find structural variations at the transcription level. CICERO is able to find fusions with low expression, fusions within repetitive regions, fusions with a short first exon, and complex fusions involving more than two genes.
Validation of genetic alterations
A custom capture array was designed to enrich for the 18,826 high quality SNVs (tiers1-3) and indels and 947 SVs discovered by WGS. This array was used to validate the presence of the non-reference allele in tumour DNA and its absence from the matched normal sample. After enrichment, samples were sequenced using Illumina technology, and resulting reads were mapped to the reference genome.
For sequences that remained uncovered we performed independent polymerase chain reaction (PCR) amplification followed by sequencing on the MiSeq platform (Illumina). Reads were mapped as before, and 10889 alterations were validated as somatic mutations.
RNAseq was also used to confirm the presence of aberrant SV transcripts detected by DNA sequencing. Reverse-transcriptase (RT)-PCR was also used to validate the presence of fusion transcripts (see below).
Calculation of background mutation rate
The background mutation rate was calculated using validated and high quality tier 3 mutations (i.e. mutations in non-coding, non-regulatory and non-repetitive regions) normalized against all tier3 regions with effective coverage (i.e. covered by >10x in both tumour and matching normal samples).
Calculation of significance of SV position
The genome was divided into bins of 10 Mb. Breakpoint frequencies in each bin were calculated for individual samples. The enrichment of SV breakpoint frequency in cerebral samples was measured by the Mann-Whitney test and raw p values were adjusted using the Holm method implemented in the p.adjust function in R (version 2.11.1).
Fluorescence in situ Hybridization (FISH)
FISH probes were derived from BAC clones (BACPAC Resources, Oakland, CA), labeled with either AlexaFluor-488 or Rhodamine fluorochromes, and validated on normal control metaphase spreads (Table S15).
Immunohistochemistry
Immunohistochemistry was performed on both human and mouse tumours using sections (5μm) of FFPE tissue. For detection of p-RELA, sections were treated to heat-induced antigen retrieval for 40 minutes, followed by overnight incubation with p-NF-κB p65 antibody (Ser276, bs-3543R, Bioss, Woburn, MA, 1:500 dilution). Signal detection used the Ultravision Plus detection system (Thermo Scientific, Waltham, MA). Immunohistochemistry for L1CAM was carried out using the Leica BOND-III platform (Leica Microsystems, Buffalo Grove, IL). The protocol consisted of heat-induced antigen-retrieval for 20 min followed by a 15 minute incubation with anti-LICAM antibody (L4543, Sigma-Aldrich, St. Louis, MO, 1:100 dilution). Signal detection used the Novocastra Bond Polymer Refine Detection kit (Leica Microsystems, Buffalo Grove, IL). Immunohistochemistry for CCND1 was undertaken on the BenchMark ULTRA system (Ventana, Tucson AZ). Following heat-induced antigen-retrieval for 36 min, tissues were incubated for 32 min with anti-CCND1 antibody (241R-18, Cell Marque, Rocklin CA, prediluted). The ultraView Universal DAB detection kit (Ventana, Tucson AZ) was used for signal detection.
Western Blot Analysis
Western Blot analysis was performed using standard techniques. Antibodies employed included NF-κB p65 (ab32536; Rb monoclonal and Cell Signaling #4282), GAPDH (Millipore #374), Lamin B1 (Abcam #ab16048), and β-Actin (CST 4967; Rb polyclonal).
RT-PCR
Transcription of fusion produces from SVs was confirmed by RT-PCR. RNA was extracted from either snap-frozen or FFPE tumour samples, and reverse-transcribed using SuperScript® VILO™ (Life Technologies, Grand Island, NY) and iScript cDNA Synthesis System (Bio-Rad, Hercules, CA) respectively. PCR was carried out using GoTaq® Long PCR Master Mix (Promega, Madison, WI), using specific primers (Supplementary Table S14). Fusions were confirmed by direct sequencing.
Cloning and Retroviral Production
Human cDNA clones of C11ORF95, RELA and YAP1 were cloned into the pCX4-IRES-Red Fluorescence (cRFP) vector. The Clontech In-Fusion HD EcoDry Cloning Plus system was used to generate fusion constructs. All constructs were verified by sequencing and used to make retroviruses as described7. Retrovirus-containing medium was collected, centrifuged, filtered and concentrated using Centricon plus 70-Millipore. The viral titer was determined by flow cytometric analysis of neural stem cells transduced with different dilutions of cDNA encoding retroviruses.
Fractionation of Nuclear and Cytoplasmic extracts
Mycoplasma negative, human 293T cells (ATCC, CRL-11268™) were lysed directly on plate using 500uL Buffer A (10mM HEPES, pH 7.9, 10mM KCl; 0.1mM EDTA, 1mM EDTA, 4% IGEPAL and 10ug/mL of aprotinin, leupeptin, and pepstatin A) for 10min at room temperature. After high speed centrifugation, lysates corresponding to the cytoplasmic fraction were transferred to a new tube. The pellet was resuspended by vigorous shaking at 4°C in 150uL buffer B (20mM HEPES, pH 7.9, 0.4M NaCl, 1mM EDTA, 10% Glycerol and 10ug/mL of aprotinin, leupeptin, and pepstatin A). Following top speed centrifugation, lysates corresponding to the nuclear fraction were transferred to a new tube. Total protein concentration was assessed by Bradford analysis and samples were prepared for western blot using equal volumes of 2x RIPA Buffer.
Promoter transactivation Reporter assays
Cells were co-transfected with 6μg of NF-κB reporter plasmid 5xkB.eGFP. Forty-eight hours later cells were stimulated, or not, for 6–8 hours with 5–50ng/mL human TNF. Reporter fluorescence was quantified by flow cytometry using a LSR II device (BD Biosciences).
Mouse RNA Samples
Total RNA was extracted with TRIzol reagent (Invitrogen) and cDNA was synthesized using the SuperScript® VILO™ cDNA Synthesis Kit (Invitrogen), according to the manufacturer’s instructions. Quantitative real-time PCR was performed by using iQ SYBR Green Supermix on iCycler Real-Time Detection System (BioRad). The primer set used for C11ORF95 was 5′ GCGCTACTACCACGACCACT 3′ and 5′ CTCCAATGCAAGGAGTAGGG 3′.
Ingenuity Pathway Analysis (IPA)
To investigate the effect of the C11orf95-RELA fusion products on cell transcriptomes, we used Ingenuity Pathway Analysis (IPA) software (http://www.ingenuity.com/products/ipa) to compare gene expression profiles among cells and tumours harboring various C11orf95-RELA fusions. In each analysis, only genes demonstrating a ≥4-fold expression difference between datasets were included for network and transcription regulator analysis. Differential expression profiles were generated for the following 4 datasets using HT MG-430 PM Affymetrix array:
Mouse embryonic E14.5 NSC derived RELAFUS1 tumours vs parental mouse embryonic E14.5 NSCs (1,470 genes; 2,016 probe sets).
Mouse embryonic E14.5 NSCs transduced with RELAFUS1 vs control-transduced NSC (946 genes; 1320 probe sets).
Mouse embryonic E14.5 NSCs transduced with RELAWT vs control-transduced NSCs (134 genes; 178 probe sets).
Mouse embryonic E14.5 NSCs transduced with C11orf95 vs control-transduced NSCs (15 genes; 18 probe sets).
Ingenuity networks were constructed by comparing differentially expressed genes from each dataset to the curated Ingenuity database, which includes physical interactions and associations between genes and microRNAs derived from multiple public databases and the literature. Networks of fixed size that maximize connectivity to our gene list were constructed and ranked by inclusivity of differentially expressed genes and the number of multiply connected or ‘focus genes’ in the Ingenuity database. Statistical significance of networks was determined by Fishers exact test. Log ratio data were introduced into network visualization, but were not part of the statistical model. The top 10 significant networks in each dataset are presented in Table S17.
Affymetrix microarray analysis
mRNA expression profiles were generated using total RNA isolated from human and mouse tissues and the U133 Plus 2.0 and 430 v 2 microarrays, respectively (Affymetrix, Santa Clara, CA). Gene expression data were normalized using the MAS 5.0 algorithm. The data were then transformed and variance stabilized by addition of small factor of 20 that shrinks the effects of small numbers and then taking the natural logarithm. The median absolute difference (MAD) of these transformed signals was calculated for each probe set across all samples on each array separately within species. The data was then imported into Spotfire Decision Site (Palo Alto CA, USA) and for each probe set and subject z-scores were calculated by computing the mean and standard deviation across subjects within each probeset. Differences in gene expression between defined groups (e.g., control transduced vs. RELAFUS1 transduced NSCs) were defined using a series of Welch t-tests as described (main manuscript Ref. 7). The resultant lists of p-values were used to define probesets that passed the Bonferroni threshold at 0.05 percent. Targets of NF-κB signaling were identified from a compilation of Rel/NF-κB target genes that is derived from the survey paper Activators and target genes of Rel/NF-kappaB transcription factors (Pahl, Oncogene 1999), the Rel/NF-kappaB transcription factors website of TD Gilmore, and additional search with PubMed available at http://www.bu.edu/nf-kb/gene-resources/target-genes/.
Additional statistical considerations
We previously demonstrated that mock transduced NSCs do not form tumours in mice, and that a cohort size of 15 mice is adequately powered to detect a tumor incidence of 10% in mice implanted with oncogene transduced NSCs6. Therefore, 15 mice each were transplanted with NSCs harboring the indicated fusion construct, or single partner gene. Since no intervention was applied to animals following cell implantation, no randomization of animals or blinding of investigators was performed.
Supplementary Material
Acknowledgments
This research was supported as part of the St. Jude Children’s Research Hospital, Washington University Pediatric Cancer Genome Project. This work was supported by grants from the National Institutes of Health (R01CA129541, P01CA96832 and P30CA021765, R.J.G), the Collaborative Ependymoma Research Network (CERN), and by the American Lebanese Syrian Associated Charities (ALSAC). We are grateful to Sally Temple for the generous gift of reagents and the staff of the Hartwell Center for Bioinformatics and Biotechnology, Animal Imaging Center, and Flow Cytometry & Cell Sorting Shared Resource at St Jude Children’s Research Hospital for technical assistance.
Footnotes
Author contributions.
M.P., K.M.M., C.P., R.W., J.D.D., R.L., R.G.T., T.N.P., R.T., Y.L., E.W., B.T., W.O., K.G., M.R., X.C., P.N., E.H., D.F., G.W., S.S., J.E., K.B., D.Y., B.V., H.L.M., J.B., P.G., R.H., J.M., G.S., L.D., C.L., K.O., D.Z., R.S.F., L.L.F. Y.L., Y.L., A.G., A.S., F.B., T.M., contributed to the design and conduct of experiments and to the writing E.R.M., R.K.W, J.R.D., D.R.G., contributed to experimental design and to the writing. J.Z., D.W.E., and R.J.G., conceived the research and designed, directed and reported the study.
Competing interests.
None.
Supplementary Information is available online.
References
- 1.Kleihues P, et al. The WHO classification of tumors of the nervous system. J Neuropathol Exp Neurol. 2002;61:215–225. doi: 10.1093/jnen/61.3.215. discussion 226–219. [DOI] [PubMed] [Google Scholar]
- 2.Merchant TE, et al. Conformal radiotherapy after surgery for paediatric ependymoma: a prospective study. Lancet Oncol. 2009;10:258–266. doi: 10.1016/S1470-2045(08)70342-5. [DOI] [PMC free article] [PubMed] [Google Scholar]
- 3.Modena P, et al. Identification of tumor-specific molecular signatures in intracranial ependymoma and association with clinical characteristics. J Clin Oncol. 2006;24:5223–5233. doi: 10.1200/JCO.2006.06.3701. [DOI] [PubMed] [Google Scholar]
- 4.Taylor MD, et al. Radial glia cells are candidate stem cells of ependymoma. Cancer Cell. 2005;8:323–335. doi: 10.1016/j.ccr.2005.09.001. [DOI] [PubMed] [Google Scholar]
- 5.Puget S, et al. Candidate genes on chromosome 9q33–34 involved in the progression of childhood ependymomas. J Clin Oncol. 2009;27:1884–1892. doi: 10.1200/JCO.2007.15.4195. [DOI] [PubMed] [Google Scholar]
- 6.Johnson RA, et al. Cross-species genomics matches driver mutations and cell compartments to model ependymoma. Nature. 2010;466:632–636. doi: 10.1038/nature09173. [DOI] [PMC free article] [PubMed] [Google Scholar]
- 7.Witt H, et al. Delineation of Two Clinically and Molecularly Distinct Subgroups of Posterior Fossa Ependymoma. Cancer Cell. 2011;20:143–157. doi: 10.1016/j.ccr.2011.07.007. [DOI] [PMC free article] [PubMed] [Google Scholar]
- 8.Atkinson Jennifer M, et al. An Integrated In Vitro and In Vivo High-Throughput Screen Identifies Treatment Leads for Ependymoma. Cancer Cell. 2011;20:384–399. doi: 10.1016/j.ccr.2011.08.013. [DOI] [PMC free article] [PubMed] [Google Scholar]
- 9.Wang J, et al. CREST maps somatic structural variation in cancer genomes with base-pair resolution. Nat Meth. 2011;8:652–654. doi: 10.1038/nmeth.1628. [DOI] [PMC free article] [PubMed] [Google Scholar]
- 10.Stephens PJ, et al. Massive Genomic Rearrangement Acquired in a Single Catastrophic Event during Cancer Development. Cell. 2011;144:27–40. doi: 10.1016/j.cell.2010.11.055. [DOI] [PMC free article] [PubMed] [Google Scholar]
- 11.Nolan GP, Ghosh S, Liou HC, Tempst P, Baltimore D. DNA binding and I kappa B inhibition of the cloned p65 subunit of NF-kappa B, a rel-related polypeptide. Cell. 1991;64:961–969. doi: 10.1016/0092-8674(91)90320-x. [DOI] [PubMed] [Google Scholar]
- 12.Hansen SK, Baeuerle PA, Blasi F. Purification, reconstitution, and I kappa B association of the c-Rel-p65 (RelA) complex, a strong activator of transcription. Mol Cell Biol. 1994;14:2593–2603. doi: 10.1128/mcb.14.4.2593. [DOI] [PMC free article] [PubMed] [Google Scholar]
- 13.DiDonato JA, Mercurio F, Karin M. NF-κB and the link between inflammation and cancer. Immunological Reviews. 2012;246:379–400. doi: 10.1111/j.1600-065X.2012.01099.x. [DOI] [PubMed] [Google Scholar]
- 14.Perkins ND. The diverse and complex roles of NF-kappaB subunits in cancer. Nat Rev Cancer. 2012;12 doi: 10.1038/nrc3204. [DOI] [PubMed] [Google Scholar]
- 15.Baud V, Karin M. Is NF-kappaB a good target for cancer therapy? Hopes and pitfalls. Nat Rev Drug Discov. 2009;8 doi: 10.1038/nrd2781. [DOI] [PMC free article] [PubMed] [Google Scholar]
- 16.Chaturvedi MM, Sung B, Yadav VR, Kannappan R, Aggarwal BB. NF-kappaB addiction and its role in cancer: ‘one size does not fit all’. Oncogene. 2011;30:1615–1630. doi: 10.1038/onc.2010.566. [DOI] [PMC free article] [PubMed] [Google Scholar]
- 17.Guttridge DC, Albanese C, Reuther JY, Pestell RG, Baldwin AS. NF-κB Controls Cell Growth and Differentiation through Transcriptional Regulation of Cyclin D1. Molecular and Cellular Biology. 1999;19:5785–5799. doi: 10.1128/mcb.19.8.5785. [DOI] [PMC free article] [PubMed] [Google Scholar]
- 18.Hinz M, et al. NF-κB Function in Growth Control: Regulation of Cyclin D1 Expression and G0/G1-to-S-Phase Transition. Molecular and Cellular Biology. 1999;19:2690–2698. doi: 10.1128/mcb.19.4.2690. [DOI] [PMC free article] [PubMed] [Google Scholar]
- 19.Kiefel H, Pfeifer M, Bondong S, Hazin J, Altevogt P. Linking L1CAM-mediated signaling to NF-κB activation. Trends in Molecular Medicine. 2011;17:178–187. doi: 10.1016/j.molmed.2010.11.005. [DOI] [PubMed] [Google Scholar]
- 20.Kiefel H, et al. EMT-associated up-regulation of L1CAM provides insights into L1CAM-mediated integrin signalling and NF-κB activation. Carcinogenesis. 2012;33:1919–1929. doi: 10.1093/carcin/bgs220. [DOI] [PubMed] [Google Scholar]
- 21.Courtois G, Gilmore TD. Mutations in the NF-[kappa]B signaling pathway: implications for human disease. Oncogene. 2006;25:6831–6843. doi: 10.1038/sj.onc.1209939. [DOI] [PubMed] [Google Scholar]
- 22.Godfraind C, et al. Distinct disease-risk groups in pediatric supratentorial and posterior fossa ependymomas. Acta Neuropathologica. 2012;124:247–257. doi: 10.1007/s00401-012-0981-9. [DOI] [PMC free article] [PubMed] [Google Scholar]
- 23.Chen LF, Greene WC. Shaping the nuclear action of NF-[kappa]B. Nat Rev Mol Cell Biol. 2004;5:392–401. doi: 10.1038/nrm1368. [DOI] [PubMed] [Google Scholar]
- 24.Zhong H, Voll RE, Ghosh S. Phosphorylation of NF-κB p65 by PKA Stimulates Transcriptional Activity by Promoting a Novel Bivalent Interaction with the Coactivator CBP/p300. Molecular Cell. 1998;1:661–671. doi: 10.1016/s1097-2765(00)80066-0. http://dx.doi.org/10.1016/S1097-2765(00)80066-0. [DOI] [PubMed] [Google Scholar]
- 25.Okazaki T, et al. Phosphorylation of serine 276 is essential for p65 NF-κB subunit-dependent cellular responses. Biochemical and Biophysical Research Communications. 2003;300:807–812. doi: 10.1016/s0006-291x(02)02932-7. http://dx.doi.org/10.1016/S0006-291X(02)02932-7. [DOI] [PubMed] [Google Scholar]
- 26.Zhang J, et al. The genetic basis of early T-cell precursor acute lymphoblastic leukaemia. Nature. 2012;481:157–163. doi: 10.1038/nature10725. [DOI] [PMC free article] [PubMed] [Google Scholar]
- 27.Robinson G, et al. Novel mutations target distinct subgroups of medulloblastoma. Nature. 2012;488:43–48. doi: 10.1038/nature11213. [DOI] [PMC free article] [PubMed] [Google Scholar]
Associated Data
This section collects any data citations, data availability statements, or supplementary materials included in this article.


