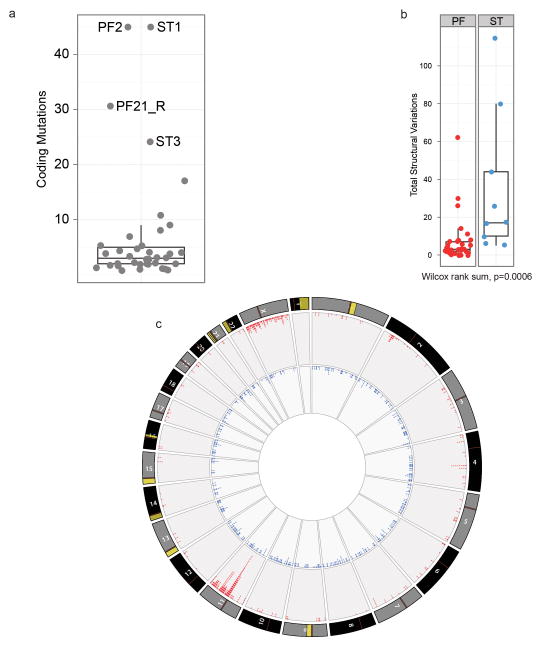
Extended Data Figure 2. Comparison of genomic aberrations among ependymomas analysed by Whole Genome Sequencing.
(a) The great majority of ependymomas have <10 coding SNV. Samples with >20 coding SNVs and their corresponding sample number from Fig. 1 are shown. (b) Comparison of total number of SVs in PF and ST samples (Wilcox rank sum, p=0.0006). (c) CIRCOS plot depicting SVs discovered across all supratentorial (red, outer plot) and posterior fossa (blue, inner plot) ependymomas. Each dot represents a validated or putative SV breakpoint detected by CREST in the WGS discovery cohort. Note the highly focal clustering of SVs on Chr11q in supratentorial ependymomas.

