Abstract
Background:
Anthropometric indices are widely used to assess the health and nutritional status of children The aim of the present study was determination of malnutrition and compare estimates of under nutrition among young children under 2 years of age from Birjand city of Iran using WHO growth standard and the National Center for Health Statistics (NCHS) references.
Methods:
The cross-sectional descriptive study conducted on 822 children under 2 years of age mean z scores for weight-for-age and height-for-age and prevalence underweight, stunting and wasting were calculated using the new WHO growth standards and compared with NCHS references.
Results:
Compared with NCHS reference, the mean height for age were lower and mean weight for age scores were almost similar using the WHO standards. Prevalence underweight, stunting, and wasting using WHO standards were 5.2-8.2% and 1.9%, respectively, compared to 6.5-37.3% and 1% based on the NCHS references.
Conclusions:
Using WHO standards resulted differences in mean z score for height for age and changes in prevalence of stunting compared with NCHS references in Birjand city children.
Keywords: Birjand, children, stunting, underweight, wasting, WHO growth standards
INTRODUCTION
Anthropometric indices are widely used to assess the health and nutritional status of children.[1] Growth in the first 2 years of life is considered an expression of health, nutritional status, and well-being. Together with the developmental milestones; growth forms the basis of most assessments of both individual children and populations. Growth monitoring programs are part of the preventive primary health services of most countries. The measurement of length and weight compared with the growth standards is used to diagnose underweight, wasting, stunting and overweight in children. Monitoring growth on charts generated from the growth standards is used to recognize growth retardation or growth failure and prompt interventions.[2]
The National Center for Health Statistics (NCHS) reference for child growth has been widely used since 1979 to compare the nutritional status of infants and children throughout the world. The NCHS reference, however, may not adequately reflect the growth of breastfed infants and children.[3,4,5,6,7,8] In addition, there is a potential for misclassification of infants in developing countries as abnormal gainers in weight and length at both ends of nutritional status if the NCHS reference data are used.[9] In particular, the NCHS child growth reference may not be appropriate for making judgments about growth faltering in the population of developing countries, where most infants and young children are breastfed for a long period.[10]
In 1993, the World Health Organization (WHO) provided a comprehensive review of the applications and current criteria changes and found that NCHS curves were not suitable indicators for growth of children and new curves were required.[11] Hence, another study was held in 1997-2003 in 6 countries with different social and economic conditions and new WHO standards (MGRS).[1] were formed.[12] In new WHO standards, the infant fostered by mother's milk, was presented as the normal growth pattern. We report here the use of the new WHO child growth standards as well as the NCHS reference in the breastfed under 2 years of age children in Birjand city.
We conducted this study to determine nutritional status of children less than two years of age using both the WHO standards and the NCHS reference guide. A comparison is also made to determine whether prevalence estimates of under nutrition across the first 2 years according to the WHO standards differs from the pattern based on the NCHS reference guide.
METHODS
This was an analytical-descriptive study conducted on 822 children under 2 years of age, with no chronic diseases, with no corticosteroids consumption, all breast-fed, selected from 9 health centers of Birjand from September 2009 to September 2010. Sampling method was multi-phase random (first phase, classified random; second phase, systematic random). The sample size was estimated to be 800 individuals, on the basis of prevalence formulae N = Z2pq/d2 with P = 0/4, d = 0.048, α = 0/05 on the basis Namakin study.[13] Before inclusion in the study, conscious written agreement of mothers who participate in the research was gotten and necessary advice about anthropometric indexes of children was given to them. All the children's weight and length were measured by the project executor, in that, weight was measured shoe-less, with light clothing on using the Seca German balance with accuracy of 50 grams; and length was measured in lied position on the bed with the accuracy of 0.1 cm. Following the measurement, the mothers were interviewed, the children documents were checked, and all the necessary information were filled in the questionnaires. Weight and length measurements were converted to Z-scores for weight-for-age (WAZ) length-for-age (LAZ), and weight-for-length (WLZ) based on NCHS references and WHO MGRS standards. A cut off of –2 Z scores for these indices was used for classifying children as undernourished. (<–2 Z scores) or well nourished (≥ –2 Z – scores) underweight and stunting were defined as <–2 Z – scores ≥ of WAZ and LAZ.
Wasting was defined as < –2 Z – scores of WLZ. Moderate and severe malnutrition were defined as Z-scores <–2 and <–3, respectively. Prevalence of malnutrition estimates means and confidence intervals and to calculate whether the prevalence estimate were significantly different for NCHS and WHO references. All statistical analyses were performer with SPSS 14.0 for windows. Analyses was done by X2 test and exact F-test with a = 0.005.
RESULTS
Among 822 studied children, with mean age 7/64 ± 6/7 month, 422 (51.3%) were girls and 400 (48.7%) were boys. Most of mothers were with moderate educational level (35.4%) and less than 35 years old (88%). Most of fathers were businessmen (61.3%) with moderate educational level (38.1%).
According to the data, the overall prevalence estimates for underweight (WAZ < –2 Z – score) was 5.2% using WHO compared to 6.5% based NCHS. This difference was not significant (P = 0.1) [Table 1].
Table 1.
The comparison of incidence of underweight, stunting and wasting based on new WHO standards and NCHS standards

Prevalence estimate for stunting (HAZ < –2 Z-SCORE) was 8.2% using WHO standard compared to 37.3% based NCHS. This difference was statically significantly (P < 0.001) [Table 1].
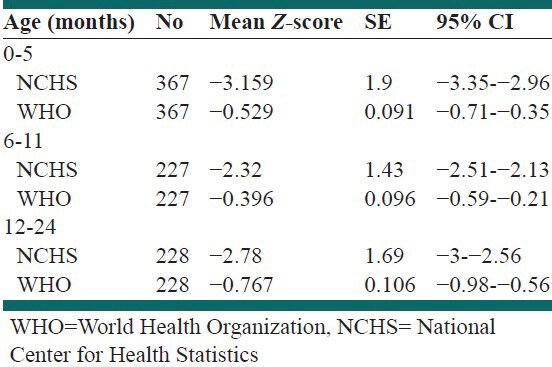
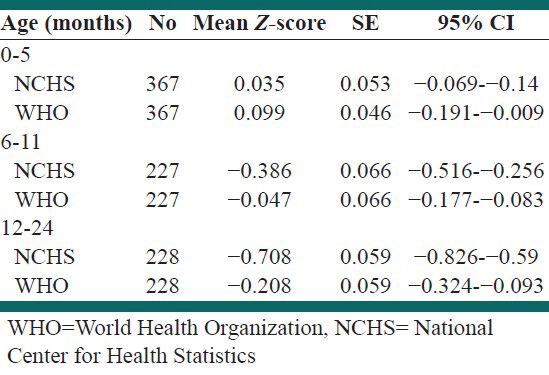
Prevalence estimate for wasting (LAZ <–2 Z-Score) was 1.9% using WHO standard compared to 1% [Table 1] based NCHS references (P = 6%). Mean Z-score for WAS, HAZ, in three groups of children under 2 years old showed in Tables 2 and 3.
Table 2.
Mean Z-scores of height for age calculated according to the WHO/NCHS for a sample children age of 0-24 months

Table 3.
Mean Z-scores of weight for age calculated according to the WHO/NCHS for a sample children age of 0-24 months

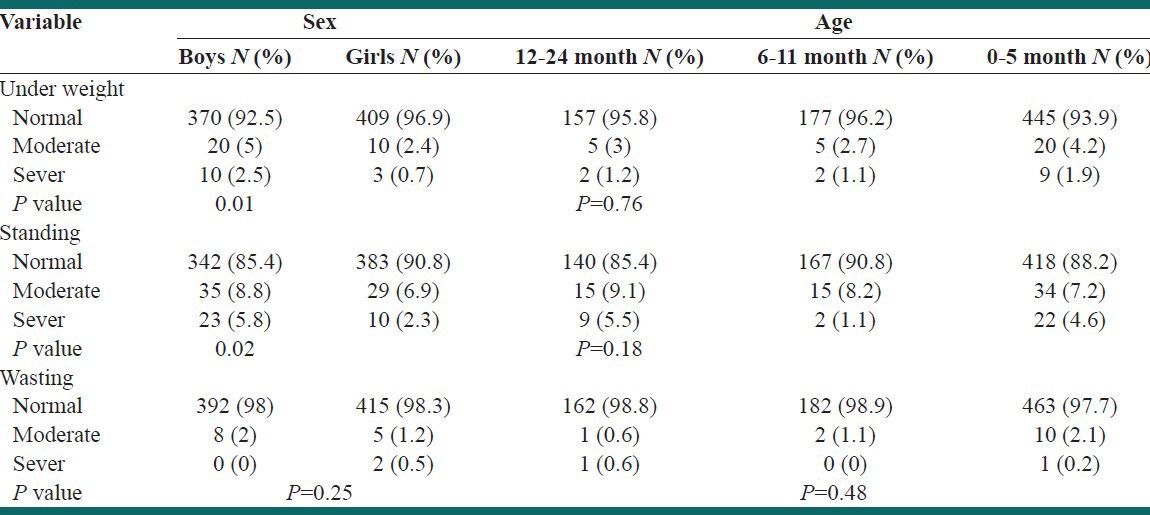
The prevalence of underweight and stunting in girls for WHO standard was significantly higher than boys but the difference was not significant in the wasting, as well as no significant differences in prevalence of malnutrition using WHO standard in age [Table 4].
Table 4.
The comparison of incidence of underweight, stunting and wasting based on new WHO in sex and age

DISCUSSION
Poor growth in children is associated with child morbidity and mortality as well as chronic disease in adulthood. Malnutrition, indicated by poor growth during infancy, is associated with increased risk of ischemic heart disease; this relationship is corroborated with findings from developing countries.[14,15,16] It is therefore important to monitor the nutrition situation of children on both sides of the growth curve.
The findings of the present study showed prevalence of stunting based on WHO standards were less than NCHS and no significant different for underweight and wasting.
The most common method used to describe the using new WHO standards in the published literature was to compare. The portion of children classified as moderately or severely malnourished (corresponding to Z score categories of –2 to –3, respectively).
In others studies, lower proportion of underweight were reported when using new WHO standards[2,17,18] but in most studies stunting when using WHO standards compared with NCHS reference was higher, in contrast to the results of the present study.[2,16,17,19,20,21]
Although in some of the studies that were performed in children aged 0-60 months, overall stunting was higher in using WHO standards but in children 12-24 month stunting in using of NCHS reference compare WHO standards was higher.[16] Prinja in India was found that WHO standards showed lower prevalence of malnutrition totally.[22]
The WHO emphasizes that the magnitude of the change observed in the anthropometric estimates between the NCHS reference and WHO standards varies depending on the indicator used the gender and age of child and the overall nutritional status of population observed.[11,23]
Comparing with the results of other studies,[24,25] it can be said that the nutritional state in Birjand city is acceptable. Although based on WHO standards it was not possible to compare the results with other regions of Iran, using NCHS references, nutritional state has been improved in the recent 8 years.[13] Similar to this study, in previous studies also the prevalence of malnutrition was higher in boys based on NCHS references,[13,24,25] so it seems that gender can affect the prevalence of malnutrition as a cultural factor.
Our results was observed that there are significant differences in the estimates of stunting but no difference in underweight and wasting, counter to results in low-income countries.
That significant difference is observed in underweight, stunting and wasting.[23] Other studied with more samples need in multiple areas of Iran for better discussion.
CONCLUSIONS
Using WHO standards resulted differences in mean z score for height for age and changes in prevalence of stunting compared with NCHS references in Birjand city children.
Footnotes
Source of Support: Nil
Conflict of Interest: None declared.
REFERENCES
- 1.Waterlow JC, Buzina R, Keller W, Lane JM, Nichaman MZ, Tanner JM. The presentation and use of height and weight data for comparing the nutritional status of groups of children under the age of 10 years. Bull World Health Organ. 1977;55:489–98. [PMC free article] [PubMed] [Google Scholar]
- 2.Saha KK, Frongillo EA, Alam DS, Arifeen SE, Persson L, Rasmussen K. Use of the new World Health Organization child growth standards to describe longitudinal growth of breastfed rural Bangladeshi infants and young children. Food Nutr Bull. 2009;30:137–44. doi: 10.1177/156482650903000205. [DOI] [PMC free article] [PubMed] [Google Scholar]
- 3.Dewey KG, Heinig MJ, Nommsen LA, Peerson JM, Lonnerdal B. Growth of breast-fed and formula-fed infants from 0 to 18 months: DARLING study. Pediatrics. 1992;89:1035–41. [PubMed] [Google Scholar]
- 4.Salmenpera L, Perheentupa J, Siimes M. Exclusive breast-fed healthy infants grow slower than reference infants. Pediatr Res. 1985;19:307–12. doi: 10.1203/00006450-198503000-00011. [DOI] [PubMed] [Google Scholar]
- 5.Nelson SE, Rogers RR, Ziegler EE, Fomon SJ. Gain in weight and length during early infancy. Early Hum Dev. 1989;19:223–39. doi: 10.1016/0378-3782(89)90057-1. [DOI] [PubMed] [Google Scholar]
- 6.Victora CG, Morris SS, Barros FC, de Onis M, Yip R. The NCHS reference and the growth of breast- and bottle-fed infants. J Nutr. 1998;128:1134–8. doi: 10.1093/jn/128.7.1134. [DOI] [PubMed] [Google Scholar]
- 7.Piwoz EG, Peerson JM, Brown KH. Potential for misclassification of infant's growth increments by using existing reference data. Am J Clin Nutr. 1992;56:58–64. doi: 10.1093/ajcn/56.1.58. [DOI] [PubMed] [Google Scholar]
- 8.WHO Working Group on Growth Reference Protocol and WHO Task Force on Methods for the Natural Regulation of Fertility. Growth patterns of breastfed infants in seven countries. Acta Paediatr. 2000;89:215–22. doi: 10.1080/080352500750028861. [DOI] [PubMed] [Google Scholar]
- 9.de Onis M, Garza C, Bhan MK, Norum KR. The WHO Multicenter Growth Reference Study (MGRS): Rationale, planning, and implementation. Food Nutr Bull. 2004;25(Suppl 1):S3–84. [Google Scholar]
- 10.Garza C, de Onis M. A new international growth reference for young children. Am J Clin Nutr. 1999;70(Suppl):169S–72. doi: 10.1093/ajcn/70.1.169s. [DOI] [PubMed] [Google Scholar]
- 11.de Onis M, Garza C, Victora CG, Onyango AW, Frongillo EA, Martines J. The WHO Multicenter growth reference study: Lanning, study design, and methodology. Food Nutr Bull. 2004;25:S15–26. doi: 10.1177/15648265040251S103. [DOI] [PubMed] [Google Scholar]
- 12.de Onis M, Garza C, Victora CG, Onyango AW, Frongillo EA, Martines J. The WHO Multicenter Growth Reference Study: Planning, study design and methodology. Acta Pediat Supp. 2006;447:12–24. doi: 10.1177/15648265040251S103. [DOI] [PubMed] [Google Scholar]
- 13.Namakin K, Saadat Joo SA. The comparison of growth charts in 1-24 months old children of Birjand with NCHS reference nomograms. J Birjand Univ Med Sci. 1381;9:26–32. [Google Scholar]
- 14.de Onis M, Frongillo EA, Blossner M. Is malnutrition declining? An analysis of changes in the levels of child malnutrition since 1980. Bull World Health Organ. 2000;78:1222–3. [PMC free article] [PubMed] [Google Scholar]
- 15.de Onis M, Blössner M, Borghi E, Frongillo EA, Morris R. Estimates of global prevalence of childhood underweight in 1990 and 2015. JAMA. 2004;291:2600–6. doi: 10.1001/jama.291.21.2600. [DOI] [PubMed] [Google Scholar]
- 16.Alasfoor D, Mohammed DJ. Implications of the use of the new WHO growth charts on the interpretation of malnutrition and obesity in infants and young children in Oman. East Mediterr Health J. 2009;15:890–8. [PubMed] [Google Scholar]
- 17.de Onis M, Onyango AW, Borghi E, Garza C, Yang H. Comparison of the World Health Organization (WHO) Child Growth Standards and the National Center for Health Statistics/WHO international growth reference: Implications for child health programs. Public Health Nutr. 2006;9:942–7. doi: 10.1017/phn20062005. [DOI] [PubMed] [Google Scholar]
- 18.de Onis M, Garza C, Onyango AW, Borghi E. Comparison of the WHO child growth standards and the CDC 2000 growth charts. J Nutr. 2007;137:144–8. doi: 10.1093/jn/137.1.144. [DOI] [PubMed] [Google Scholar]
- 19.Fenn B, Penny ME. Using the New World Health Organisation Growth Standards: Differences From 3 Countries. J Pediatr Gastroenterol Nutr. 2008;46:316–21. doi: 10.1097/MPG.0b013e31815d6968. [DOI] [PubMed] [Google Scholar]
- 20.Bosman L, Herselman MG, Kruger HS, Labadarios D. Seccendary analysis of anthropometric data from a South Africa national food consumption survey, using different growth reference standards. Mater Child Health J. 2010;21:130–6. doi: 10.1007/s10995-010-0685-5. [DOI] [PubMed] [Google Scholar]
- 21.Nuruddin R, Lim MK, Hadden WC, Azam I. Comparison of estimates of under-nutrition for pre-school rural Pakistani children based on the WHO standard and The National Center for Health Statistics (NCHS) reference. Public Health Nutr. 2009;12:716–22. doi: 10.1017/S1368980008002383. [DOI] [PubMed] [Google Scholar]
- 22.Prinja S, Thakur JS, Bhatia SS. Pilot testing of WHO growth standards in chandigraph: Implication for Indians child health programs. Bull World Health Organ. 2009;87:116–22. doi: 10.2471/BLT.08.051789. [DOI] [PMC free article] [PubMed] [Google Scholar]
- 23.Nichols EK, Nichols JS, Selwyn BJ, Coello-Gomez C, Parkerson GR, Brown ER, et al. Implications of the WHO Child Growth Standards in rural Honduras. Accepted in Public Health Nutr. doi: 10.1017/S1368980011003570. doi: 10.1017/S1368980011003570. [DOI] [PubMed] [Google Scholar]
- 24.El Mouzan MI, Foster PJ, Al Hebrish AS, Al Salloum AA, Al Omar AA, Qurachi MM. Prevalence of nutrition in Saudi children: A community-based study. Ann Saudi Med. 2010;30:381–5. doi: 10.4103/0256-4947.67076. [DOI] [PMC free article] [PubMed] [Google Scholar]
- 25.Yang H, Fang Z, Zhao L, Qin Q, Wei Y, Xu J, et al. Analysis on the prevalence of malnutrition and affected factors of rural poor infants under 2 years old in Guangxi province in 2008. Wei Sheng Yan Jiu. 2010;34:469–77. [PubMed] [Google Scholar]


