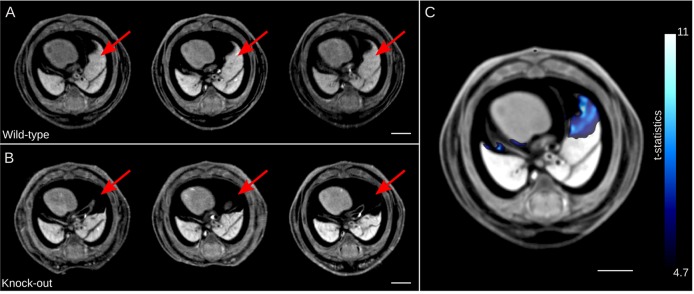
Fig. 3.

Analysis of image intensity differences in the Tcf21-hypo embryo images. (A,B) Three representative individual transverse sections of wild type (A) and hypomorphic Tcf21-hypo mutant (B) through the thoracic cavity post image registration are shown. The wild-type embryos (A) exhibit a normal middle lobe of the right lung morphology (red arrows). The Tcf21-hypo mouse embryos (B) are missing lung tissue at the corresponding locations (red arrows). (C) Highlighted in blue are significant intensity differences in the mutant. The color bar presents the t-statistic of which the minimum corresponds to a FDR threshold of 5%. Scale bars: 2 mm.
