

Abstract
Clinical imaging methods are highly effective in the diagnosis of vascular pathologies, but they do not currently provide enough detail to shed light on the cause or progression of such diseases, and would be hard pressed to foresee the outcome of surgical interventions. Greater detail of and prediction capabilities for vascular hemodynamics and arterial mechanics are obtained here through the coupling of clinical imaging methods with computational techniques. Three-dimensional, patient-specific geometric reconstructions of the pediatric proximal pulmonary vasculature were obtained from x-ray angiogram images and meshed for use with commercial computational software. Two such models from hypertensive patients, one with multiple septal defects, the other who underwent vascular reactivity testing, were each completed with two sets of suitable fluid and structural initial and boundary conditions and used to obtain detailed transient simulations of artery wall motion and hemodynamics in both clinically measured and predicted configurations. The simulation of septal defect closure, in which input flow and proximal vascular stiffness were decreased, exhibited substantial decreases in proximal velocity, wall shear stress (WSS), and pressure in the post-op state. The simulation of vascular reactivity, in which distal vascular resistance and proximal vascular stiffness were decreased, displayed negligible changes in velocity and WSS but a significant drop in proximal pressure in the reactive state. This new patient-specific technique provides much greater detail regarding the function of the pulmonary circuit than can be obtained with current medical imaging methods alone, and holds promise for enabling surgical planning.
Keywords: pulmonary hypertension, arterial biomechanics, hemodynamics, computational fluid mechanics, fluid-structure interaction
Introduction
The active maintenance of physiologically suitable pressures and flows in the human circulatory system is known as vascular homeostasis. Large departures from homeostasis are typically caused by problems such as hypertension, atherosclerosis, or congenital heart defects. Clinical diagnostics, for instance, catheter-based reactivity challenges, seek to quantify such departures to determine disease severity, while clinical procedures such as surgical intervention or drug therapy attempt to restore homeostasis by affecting corrective changes in flow geometry or alter artery biochemical response, respectively. These clinical practices are effective in the discovery and treatment of pathologies, but cannot yet provide detailed cause-and-effect descriptions of disease progression or insight into their underlying pathological hemodynamics.
Of interest to clinicians are relationships between flow conditions and vascular response, and the impact of both on disease development. For instance, steady flow in the pulmonary circulation may be responsible for the in vivo release of vasoactive substances by the vascular endothelial layer, which is a sophisticated detector of hemodynamics [1,2]. In vitro studies of endothelial cells (ECs) have found they release natural vasodilators under the action of steady and positive-mean pulsatile fluid wall shear stress (WSS), but not in the presence of zero-mean pulsatile or turbulent shear [3,4]. Thus, disease states that reduce steady WSS could reduce distal dilation response and in turn increase proximal pressure, i.e., yield pulmonary arterial hypertension (PAH). This is a potential feedback mechanism for the worsening of the disease; such a process cannot currently be confirmed clinically. A second example of interest is found in congenital heart problems such as septal defects (SD). Septal defects cause increased flow through the pulmonary vasculature, which further yields higher upstream (proximal) pulmonary pressures. Interestingly, the coupled increase in both pressure and flow that occurs in this pathology makes the patient’s status difficult to quantify with clinical diagnostics. Detailed study of the SD-associated hemodynamics and WSS, however, may enable better diagnosis and could also determine if the PAH feedback mechanism mentioned above exists in such patients.
Our hypothesis is that proximal compliance strongly affects both the proximal and distal flow fields, and is thus significant in the diagnosis and treatment of PAH. However, such relationships between vascular pathologies and their hemodynamics and artery mechanics are difficult to establish clinically, although emerging diagnostics [5,6] have highlighted the importance of proximal compliance in clinical assessments of PAH. We believe that fundamental studies of arterial and blood flow dynamics can provide insight into normal and pathological function of the vasculature, and may be determined through the merging of patient-specific three-dimensional (3D) imaging techniques and computational solvers. The coupling of these two techniques offers potentially non-invasive, if indirect, methods to obtain detailed data on the dynamics of the blood and artery walls, which can then be used to gain further insight into overall functional relationships and specific flow features, provide guidance regarding the most appropriate windows for imaging diagnostics, and examine hemodynamic consequences due to surgical and/or pharmacological treatment.
Computational fluid dynamics (CFD)-based studies of the cardiovascular circulation have proliferated over the last decade. Fluid-structure interaction (FSI), which requires the coupling of CFD and structural solvers (usually done through finite element (FE) techniques), has appeared more recently, and is an important requirement for accurate physiologic models because flow pulsatility can cause large variations in arterial dimensions during the cardiac cycle. FSI analyses can incorporate bidirectional coupling, in which each domain is affected by the dynamics of the other, or unidirectional coupling, in which only one domain is so influenced; in the latter case, the motion of the non-interacting domain is specified a priori. With fluid-to-structure coupling, the structural domain is perturbed by the fluid pressure and wall shear; its edges (at inlets and outlets) are typically constrained. With structure-to-fluid coupling, structural motion changes the flow domain geometry; arbitrary-Lagrangian-Eulerian and mesh-remapping methods are applied for this purpose, depending on the fluid discretization method employed.
There are now a number of FSI analyses in the literature. For example, the impact of a stenosis on flow and downstream structural response has been studied with models featuring transient flow and bidirectional FSI in two-dimensional axisymmetric [7,8] or cylindrical 3D geometries [9–12]. Research utilizing 3D patient-specific geometry has examined predetermined, patient-measured structural motion—that is, structure-to-fluid coupling only—on flow dynamics of the coronary arteries [13], and has considered unique, hyperelastic structural properties for the various components of plaque in the carotid artery—such as calcified and necrotic regions—in order to investigate their impact on plaque rupture [14,15]. These studies have sought to link hemodynamic or mechanical features, particularly WSS and arterial strain, to disease progression, or obtain insight into catastrophic events such as plaque rupture; however, links between hemodynamic changes and prediction of plaque rupture remain tenuous. Predicted structural displacements are significant (up to 20% strain) even in the peripheral (systemic) sites studied, and have been repeatedly shown to have a strong impact on hemodyamic features. For instance, decreases in diastolic flow through an aortic coarctation due to reductions in compliance [16] have been found in an FSI-based study by our group.
Constitutive models considered in these FSI models for the arteries include linear elasticity [12,13,16], viscoelasticity [17], and hyperelasticity [7–11,14,15]. The hyperelastic model may be further divided into strain-energy potential formulations; the Ogden [7], Fung’s pseudoelastic [8], and the Mooney-Rivlin [9–12,14,15] have all been used in simulations. However, the different impacts of these on vascular function have not been comprehensively examined.
This Study
To the best of the authors’ knowledge, no work has yet combined clinically obtained 3D geometry, transient flow, and bidirectional FSI into a single hemodynamics simulation of the proximal pulmonary vasculature. In addition, the pulmonary circuit, and in particular the pediatric pulmonary circuit, has only infrequently been modeled with CFD. In this paper, we present (1) a method to obtain pediatric pulmonary arterial geometry from clinical measurements and produce patient-specific two-domain (fluid/structure) computational meshes; (2) structural and patient-specific fluidic initial and boundary conditions for the transient, coupled simulation of blood and arterial dynamics; (3) a solution procedure for these simulations utilizing the CFDRC multiphysics package (ESI Group, San Diego, CA); (4) particle velocity, pressure, and WSS fields from two models with simulated acquired and congenital pulmonary pathologies. This represents a first step towards quantifying the effects of proximal compliance on structural and flow dynamics of the entire pulmonary arterial vasculature.
Methods
All institutional policies (HIPPA/COMIRB) were followed during data collection and analysis, and the institutional board approved all studies.
Image Acquisition and Geometry Reconstruction
Two orthonormal images are first obtained from bi-plane x-ray angiograms performed during routine catheterization. These were acquired with a 9 in. image intensifier (9 in. II) at the cardiac catheterization lab in The Children’s Hospital. The angiogram pixel resolution is about 0.33 mm based on the 9 in. II; however, the ratio of patient-to-intensifier distance to x-ray-source-to-intensifier distance produces a magnification factor of about 1.5, which yields an image spatial resolution as fine as 0.22 mm (i.e., 0.33 mm/1.5).
Images are obtained in digital (DICOM) format and input into a customized reconstruction program adapted for the pediatric pulmonary vasculature, which has been extensively validated with over 1000 reconstructions performed for the adult cardiovascular system [18]. Images can be obtained at any point during the cardiac cycle; in our studies, we obtained the images at mid-diastole. The program computes local vessel centerline position (in Cartesian coordinates) and lumen (internal) diameter for the main and branch pulmonary arteries. The accuracy of reconstructed 3D length was validated to be within an average root-mean-square 3.5% error using eight different pairs of angiograms of an intracoronary guide wire of 105 mm length with eight radiopaque markers of 15 mm inter distance. Representative vessel centerline data from one patient overlain on an anterior to posterior angiogram image, and centerline and lumen diameter data overlain on a sagittal image, are shown in Figs. 1(a) and 1(b), respectively.
Fig. 1.
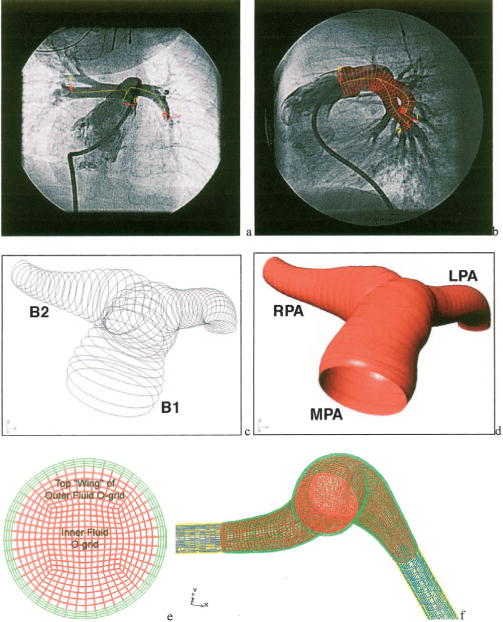
Steps in the production of patient-specific computational meshes: (a) Example AP (a) and lateral (b) pulmonary bi-plane angiogram images with centerline data overlaid on the AP view and centerline and diameter overlaid on the lateral view. The skeleton data viewed in the solid modeling environment (c) and resulting surfaces (d) note that the MPA and LPA are represented by one surface (B1) and the RPA by another surface (B2). (e) The complete base line mesh; fluid domains are shown in red (normal) and blue (porous), and structure domains are shown in green (normal compliance) and yellow (stiff). (f) A typical cross section of the base line mesh.
Solid Modeling
A three-dimensional artery “skeleton” is created by assuming a circular vessel cross section at each centerline position point in the reconstruction data, as seen in Fig. 1(c). The centerline position points are then minimally down sampled in order to remove overlapping cross sections. From this filtered skeleton, a non-uniform rational B-spline (NURBS)-based multiple surface model of the artery lumen is then readily constructed within the commercial software RHINOCEROS (Robert McNeel and Associates, Seattle, Washington); an unprocessed, two-surface model is shown in Fig. 1(d). At bifurcation points, retrimming (i.e., redefining surface edges) joins the surfaces, and sharp joint edges are smoothed with fillets; this process consolidates many individual branch surfaces into a single lumen surface. This unified surface is then smoothed by NURBS surface control point reduction to reduce spurious surface fluctuations and remove surface overlap at vessel bends. Both smoothing operations retain the salient features of the geometry, since any point on the final smoothed surface does not deviate by more than 5% from the raw surfaces generated by skeleton data. This surface forms the outer boundary of the fluid domain (i.e., the inner diameter of the vessel lumen).
The structural (arterial wall) domain is created between the lumen surface and an additional, outer wall surface constructed from scaled skeleton data. Because angiogram images provide only inner wall position, scaling is used to estimate local wall thickness. Prior studies have shown that PA wall thickness is approximately 10% of local diameter [19]; this was used as the thickness dimension of the local wall for the structural domain. After the outer wall is created, retrimmed, and smoothed, the two (inner and outer) surfaces are closed with the addition of additional circular surfaces at the skeleton edge points to create inlet and outlet surfaces and exported to the ACIS format (Spatial Technology, Boulder, CO) for use with meshing software.
Mesh Construction
The commercial software ICEM-CFD (Ansys Inc., Cannonsberg, PA) is used to create block-structured hexahedral meshes from the NURBS surfaces. First, a single mesh block is mapped onto the entire outer surface of the primary (MPA-LPA) branch, and is divided axially along the branch to sufficiently capture wall curvature. At the bifurcation, a new block is extruded and similarly divided for the RPA, until the entire surface model is contained within blocks. Next, two o-grid sets—groups of blocks that surround a given block or block set—are created over the entire model to improve mesh quality and to create unique material domains. Figure 1(e) shows a typical cross section of the mesh at the base refinement level; in the figure, the outermost of these o-grid sets appears in green and is mapped to the structure domain, while the inner o-grid set and innermost block set appear in red and correspond to the fluid domain. Finally, the branch outlets are extended by the addition of rigid tubes with controllable porosity, referred to hereafter as exit sections. These sections are added to include the effects of pulmonary vascular resistance (PVR); during model setup, their porosity can be adjusted based on hemodynamic measurements for each patient (See section below for details). These sections appear as blue (fluid) and yellow (structure) in Fig. 1(f). Quality metrics for the resultant hexahedral meshes are very good, considering the complex “organic nature” of the surfaces, with all minimum element angles greater than 30 deg and a minimum normalized 2 × 2 × 2-stencil determinant (Jacobian) of 0.5.
Figure 2 shows anterior and inferior views of each model obtained from the two patients. In the figure, dark gray denotes the fluid inlet, light gray denotes the structural mesh, and thick black lines indicate cross sections of interest examined in the results section. Relevant patient and diagnostic information are given in Table 1. Patient 1 had multiple septal defects (ASD/VSD, pre-op) resulting in a high (2.5 L/min) flow and a mean PA pressure of 28 mm Hg (3730 Pa); the patient’s post-op status is unknown. Patient 2 had a mean PA pressure of 45 mm Hg (6000 Pa); during reactivity testing, the patient’s mean PA pressure dropped by half. Both patients were infants (ages 18 and 4 months, respectively), with similar inlet, MPA, RPA, and LPA diameters. We note that the simulations are meant to represent closed-chest functioning of the vasculature, not conditions during open-heart surgery.
Fig. 2.
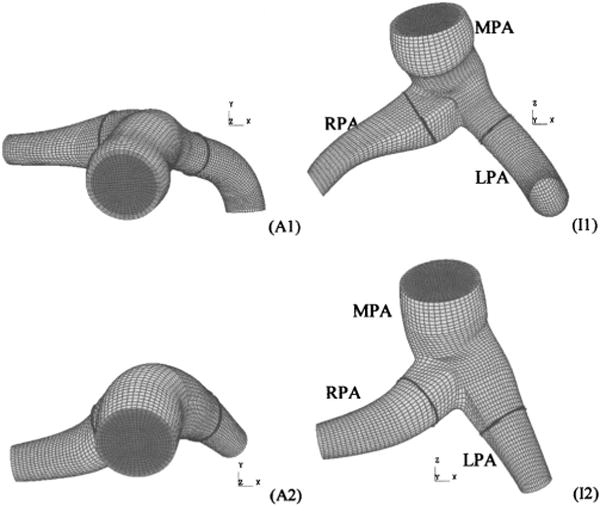
Anterior (Ax) and inferior (Ix) views of four computational meshes derived from patient-specific geometry (exit sections not shown). Light and dark gray surfaces denote the structural domain and fluid inlet, respectively. Thick black lines denote cross-sectional cut locations at which secondary flows and wall shear stress are examined in the results section.
Table 1.
Patient information and diagnosis
| Patient (internal mesh code) | Age/sex, mass, height | Diagnosis/pathology |
|---|---|---|
| 1 (0009) | 4 mo M, 5.4 kg, 58 cm | Atrial septal defect, ventricular septaldefect, (hypertensive) |
| 2 (0008) | 18 mo M, 9.2 kg, 77 cm | Hypertensive |
Fluid and Structural Properties/Boundary Conditions
Blood is modeled as an incompressible Newtonian fluid with constant dynamic viscosity 3.5 mPa s and density 1060 kg/m3. Constant uniform atmospheric pressure (101,325 Pa) acts externally on the model, and is considered the base line pressure; no additional external fluid loading is considered. The stress vector (i.e., σ · n, where σ is the stress tensor and n is the surface normal) is continuous across the fluid-structure boundary, where the no-slip condition is applied to the fluid velocity vector. The flow is assumed to be laminar.
The inlet flow velocity is transient (pulsatile), with peak velocity and pulse shape obtained from clinical measurements using pulsed wave Doppler on the main pulmonary artery. A parasternal short axis view was used to obtain the Doppler velocity data within the midpoint of the main pulmonary artery. Two-dimensional echo and color Doppler was used to align the ultrasound beamline parallel to the main flow direction within the PA. We estimate minimal errors due to ultrasound beam angulation (<5 deg). The outlet pressures are individually set with a combination of Bernoulli and mass conservation conditions to insure approximately the same flow through each outlet at the mean inlet flow condition. Such comparable flow is usually found clinically in the absence of preferential lung dysplasia or other developmental lung problems, i.e., each lung presents nearly equal PVR to the heart. These pressures are estimated by first determining the (lossless) pressure drop along streamlines from the inlet to the center of each outlet with the Bernoulli equation, which may be written for the spatially constant upstream conditions that exist at the inlet (i.e., pulmonary valve) as
| (1) |
where P and V are the spatially uniform interface pressure and velocity, respectively, ρ is the fluid density, and the subscripts i, o1, and o2 refer to the inlet and two outlets, respectively. Next, conservation of mass between the inlet and outlets and equal flow at the outlets are expressed as
| (2) |
respectively, in which A is the outlet cross-sectional area. Combining Eqs. (1) and (2) we obtain
| (3) |
which is the required pressure difference for equal flow. The smaller outlet is set to 533 Pa (mean left atrium pressure) and the other to 533 Pa+ΔPo.
Exit sections have properties that simulate clinically measured pulmonary vascular resistance values. Each is composed of a rigid diameter tube filled with porous media; this allows PVR to be set for each patient-specific model based on hemodynamic measurements since porosity and permeability of this fluid domain are directly related to the pressure drop. Values for the porosity and permeability of the porous media are obtained a priori by solving the Brinkman-Forchheimer equation [20] for one dimensional (1D) steady flow in a circular tube with a constant pressure gradient to obtain
| (4) |
where Qm is the mean flow rate (cardiac output), R is the average artery radius in the branch region of interest, dP/dx is the desired pressure gradient in the direction of flow, In is the nth modified Bessel function of the first kind, and , in which ε is the porosity and K is the permeability, both of which are taken as floating parameters. With clinically known values of PVR (consisting of pressure difference, ΔP, between the MPA and left ventricle and the cardiac output) and model exit section length le and radius re, we find suitable values for the porosity parameters by approximating dP/dx as ΔP/le and R as re. We then insert these approximations, along with Qm and porosity ε = 1 into Eq. (4) to find K, which is the required permeability. This provides a simple-to-implement connection between actual physiologic measurements and computational boundary conditions, and may be adjusted to match patient-measured PVR and/or capillary wedge pressures. We note that pressure drop in the 3D porous sections at the mean flow condition compared favorably (within 20%) of those predicted by the 1D model given by Eq. (4). The exit conditions, then, consist of the outlet pressures, which approximate terminal pressure and allow for equal mean flow, and the exit sections, which account for lung PVR. Use of the “Windkessel” model to determine exit conditions [21,22] was avoided due to the difficulty of relating its parameters to real clinical values for the pediatric pulmonary vasculature.
The artery wall is treated as a nearly incompressible (Poisson’s ratio, ν=0.48) isotropic linear elastic solid. Biomechanical studies of the stress-strain properties of normotensive and hypertensive pulmonary arteries from a rat model [23] showed that a Young’s modulus (E) of 1.0 MPa was a reasonable demarcation of normo-and hypertensive conditions. For these studies the Young’s modulus for normotensive conditions were set in the range of 600–800 kPa, while the models in hypertensive states have values falling between 1.5 and 1.6 MPa. Residual stress, which is typically included in order to understand physiological remodeling and/or adaptation to mechanical loading [24,25], is not considered here due to the difficulty of incorporating such effects in clinical models where direct measurements of residual stresses within the artery cannot be obtained. The structural boundaries at the exit section outlets are fixed in space, and the exit section structures have higher stiffness (E=100 MPa) to replicate the anchoring effects of the distal vasculature. A consistent mass matrix is employed in the structural equations. Also, no numerical or Rayleigh damping is applied; thus the structural motion is not an energy loss mechanism. Pertinent inlet and outlet conditions and material properties are summarized in Table 2.
Table 2.
Artery model fluid and structural parameter data
| Model number/conditions | Mean inlet flow rate, liters/min | Peak/mean inlet velocities, cm/s | Mean inlet pressure, Pa (mmHg) | RPA/LPA/total exit section resistances, wood units × m2 | Heart Rate, BPM | Young’s modulus, KPa |
|---|---|---|---|---|---|---|
| 1/pre-op | 2.290 | 183/71.1 | 3480 (26.1) | 5.5/2.3/4.2 | 120 | 1500 |
| 1/post-op | 1.240 | 98.1/38.5 | 1320 (9.9) | 2.9/1.1/2.1 | 120 | 600 |
| 2/pre-reactive | 1.250 | 131/51.1 | 6760 (50.8) | 28.1/25.5/13.4 | 100 | 1600 |
| 2/reactive | 1.250 | 131/51.1 | 3310 (24.8) | 9.9/11.9/5.4 | 100 | 800 |
Solver Details
The CFD-ACE multiphysics package solves the governing equations for fluid flow with the finite volume method [26] and solves the equations of motion for the structure with the finite element (FE) method [27]. Greater detail regarding the fluid equations and solver, as well as validation of CFD-ACE against in vitro laser particle image velocimetry results, may be found in previous works from our group [16,28–31]. Coupling is achieved through passing fluid stress at the fluid-structure boundary to the structural solver, where it is used as an applied load. After finding the structural solution, the structural solver returns the resulting boundary displacements to the fluid solver, providing the latter with updated flow geometry. Finally, flow geometry is updated through transfinite interpolation and specialized point (nodal) constraints. This spatial iterative process continues at each time step until the solutions at the fluid-structure boundary are sufficiently compatible. In the solution procedure, we use the CFD-ACE algebraic multigrid solver for the fluid equations and their direct solver for the structural equations. During spatial convergence within each time step, fluid-structure coupling occurs once every five fluid iterations. After spatial convergence, a second-order unconditionally stable Crank-Nicolson step is taken to advance to the next time.
Mesh Validation
We rely on h-type refinement for assurance of fluid mesh convergence, where a first-order upwind differencing scheme is always used, while p-type refinement and varying element formulation are used for this purpose in the structure domain. Comparisons of pressure and particle velocity results obtained with the first patient geometry from the Steady/Rigid run at select cells in the base line mesh (107,809 nodes, 78,192 total cells) and 1.5× refined mesh (222,632 nodes, 172,864 total cells) show at most a 2% difference in pressures and a 7% difference in velocities, with the vast majority of cells displaying differences of 2% or less. Second-order upwind differencing was examined for the fluid but yielded a negligible change in the solution. Selected structural displacements from the Steady/Compliant run, obtained from the base line mesh with linear continuum shell elements, from the base line mesh with quadratic volume elements, and from the 1.5× refined mesh with linear continuum shell elements all compare favorably (max 2% difference). Thus, the base line mesh refinement with first-order fluid differencing and structural continuum shell elements was deemed to be of sufficient accuracy. Spatial refinement levels used for each base line mesh are given in Table 3.
Table 3.
Discretization data for base line meshes
| Patient | Total nodes | Fluid elements | Structure elements |
|---|---|---|---|
| 1 | 107,809 | 58,752 | 19,440 |
| 2 | 110,773 | 60,048 | 19,872 |
Time convergence is verified by time step doubling. Comparisons of structural velocities from the first mesh integrated at the base line time step (10 ms, ≈ 1 /50 of period) and refined time step (5 ms, ≈1/100 of period) are nearly identical (all <1% difference) during forced response (systole). High-frequency low-amplitude free response of the structure, which occurs during diastole, is not as well represented by the larger time step; however, this response has a negligible impact on the presented results. Comparisons of select fluid velocity vectors and WSS at select times during systole from the first mesh integrated at the two time steps mentioned above also show virtually no difference (<1% throughout); thus, the 10 ms time step was deemed sufficient for these simulations. Solution times for a base line mesh at the base line time step are on the order of 20 h/cardiac cycle on a serial 1.53 GHz Athlon-class Linux workstation, and require 100 MB of memory.
Results
We examine hemodynamic changes as the result of an operative closure of multiple septal defects and due to a catheter-based reactivity challenge in two distinct patient models, each with two sets of material properties and boundary conditions.
Case 1: Pre/Post Operative Septal Defect
Congenital septal defects allow flow communication between the left (systemic) and right (pulmonary) sides of the heart. Because the pulmonary side operates at a lower mean pressure, septal defects usually yield increased pulmonary flow and pressure. Below, we examine model 1 of Fig. 2 under clinically measured high-flow, hypertensive (pre-op) and normal flow, reduced-pressure (post-op) cases. The inlet mass flow rate in the pre-op case is 1.85 times that in the post-op case, which is a typical ratio seen clinically. Model stiffness is decreased greatly from pre-op to post-op cases, from 1.5 MPa to 600 KPa, representing a reduction in incremental modulus and lack of permanent physiological remodeling of the vascular structure [23]. Exit section porosities are unchanged from pre-op to post-op model. Parameters of interest for these two cases appear in Table 2.
Figure 3 displays eight velocity oriented-vector/magnitude-contour plots for model 1, pre-op case, viewed from the superior direction and extracted from the complete dataset over the cardiac cycle. The velocity surfaces shown lie at the center of the vessels in approximately the transverse (anterior-posterior) plane, change in size through the sequence due to computed artery wall deformation, and are viewed from the posterior direction. Warm (red) and cool (bluish) shades denote large and small velocity magnitudes, respectively. During systole, a flow stagnation point occurs past the junction against the far wall of the RPA; the peak pressure also occurs at this point. The axial velocity profiles are clearly distinguished throughout the vasculature; in the LPA they are nearly constant across the radius, indicative of undeveloped flow, while the RPA flow has a nearly constant core flow with lower velocities near the walls. Substantial slowing of the flow occurs on the proximal side of the RPA, but it does not experience recirculation. Although the peak velocity (4.03 m/s) occurs in the LPA, it receives approximately 46% of the flow over the cycle.
Fig. 3.
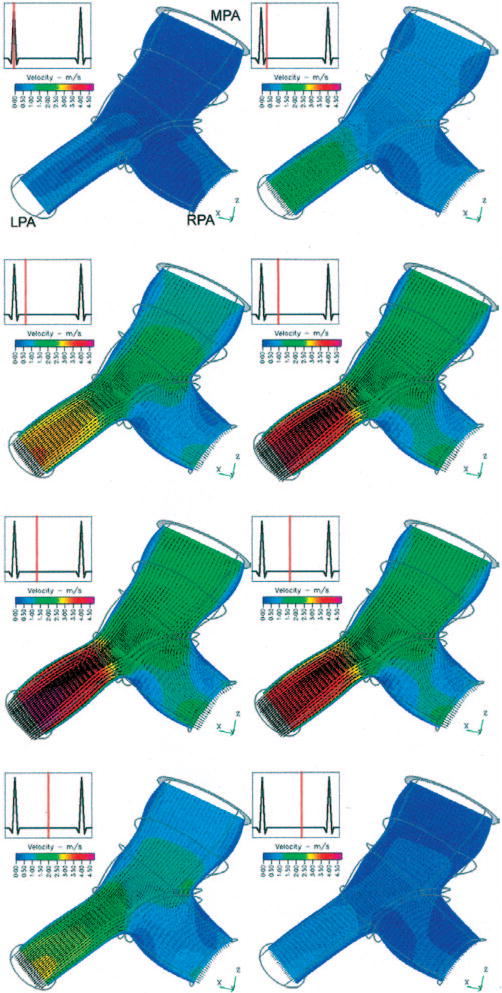
Oblique superior view of velocity vectors and velocity magnitude contours within a transverse mid-vessel slice of the MPA and proximal PA branches of model 1 at eight time points within the cardiac cycle. The thick gray circle at the top of the figure is the MPA inlet slice; thin gray lines outline the artery shape distal to the inlet. The change in domain shape is due to arterial wall motion, and the velocity contour color mapping is consistent through the series.
Differences in the primary velocity fields, pressures on the superior wall, and WSS on the superior wall between the pre-op and post-op model are displayed in Fig. 4. In each subfigure, the variable of interest is normalized to the maximum post-op value of that variable in order to most clearly display changes between model configurations. Comparing Figs. 4(a), 4(c), 4(d), and 4(f) respectively, we see that the 85% larger mean mass flow in the pre-op case yields increases in the maximum mean velocities and maximum mean WSS throughout the model of 65% and 120%, respectively. Regions of peak flow and WSS qualitatively appear in the same region, near the exit of the LPA branch. Flow splits over the cycle are similar: 49.7%/50.3% (RPA/LPA) in the pre-op case and 48.8%/51.2% in the post-op case. Differences in pressure, shown between Fig. 4(b) and 4(e) are substantial: pre-op inlet pressure is 160% greater, and a much greater pressure drop is seen in the pre-op LPA due to the exceptionally high flow rate there. The drop in mean pressure due to this “intervention,” from 3480 Pa (26.1 mmHg) to 1320 Pa (9.9 mmHg), represents a “full recovery”—that is, the return of the vasculature to healthy inlet pressures. Additionally, despite no changes in the exit section porosities, total PVR decreases as a consequence of reduced flow and drops from 4.2 Units × m2(pre) to 2.1 Units ×m2(post).
Fig. 4.
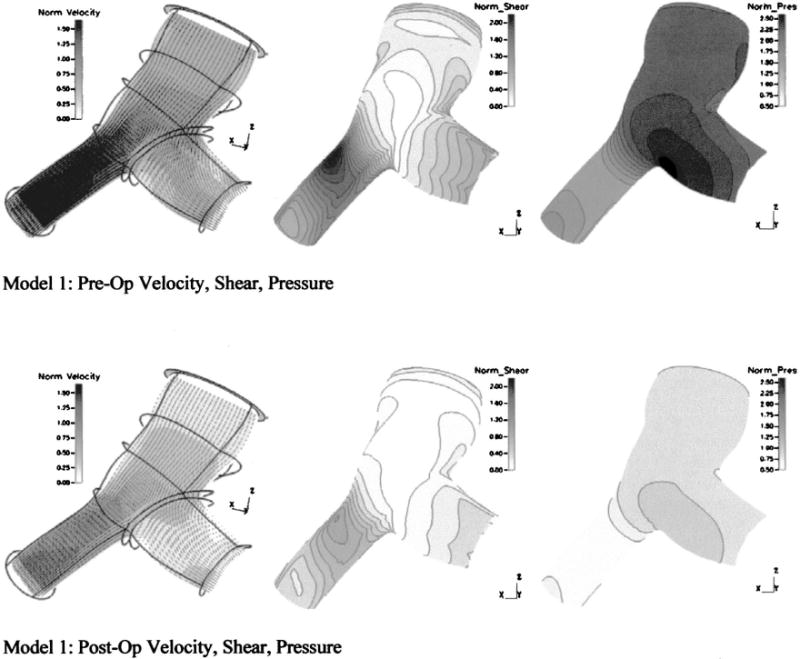
Primary velocity fields, pressures, and WSS from model 1 under pre-op and post-op conditions
Case 2: Reactivity Challenge
Reactivity to vasodilators such as oxygen or nitric oxide (NOx) is measured clinically in order to assess hypertension severity. Response in the form proximal pressure drop is indicative of moderate hypertension, while the lack thereof indicates a more severe disease state [32]. Here we examine changes in pressure and WSS due the occurrence of substantial distal vascular response with model 2 of Fig. 2. Model stiffness was reduced from 1.6 MPa to 800 kPa, to represent changes in incremental modulus from hypertensive to normotensive conditions [23]. Exit section permeability was also reduced in the reactive model to simulate the effect of the vasodilator therapy, resulting in an overall PVR drop from 13.4 Units ×m2 to 5.4 Units ×m2; this represents a typical clinical condition. Relevant parameters are again listed in Table 2.
Figure 5 shows differences in the primary velocity fields, pressures on the superior wall, and WSS and displacements at a cross-sectional slice of the RPA due to the reactivity response. Here too, the variable of interest in each subfigure is normalized to the maximum reactive value of that variable. Of significance here is the relative similarity of the primary velocity field throughout the model seen in Figs. 5(a) and 5(d), and the consequential similarities of WSS seen at a cross-sectional slice of the RPA in Figs. 5(b) and 5(d). The reactive decrease in distal resistance, coupled with an attendant decrease in model stiffness, yields approximately the same flow conditions. Wall displacements, as seen in Figs. 5(b) and 5(d), were smaller in the hypertensive case as was the change in cross-sectional area, with a 25.5% systolic increase in the reactive case compared to 19.8% in the hypertensive. Flow splits between the two cases change only slightly, with the pre-reactive 49.1%/50.9% (RPA/LPA) values changing to 49.4%/50.6% in the reactive case. The mean pressure in the pre-reactive model, seen in Fig. 5(d) is approximately twice that of the pressure in the reactive model of Fig. 5(b). Quantitatively, the drop is 3450 Pa, and brings the mean pressure at the reactive case—3310 Pa (24.8 mm Hg)—closer to a normotensive state.
Fig. 5.
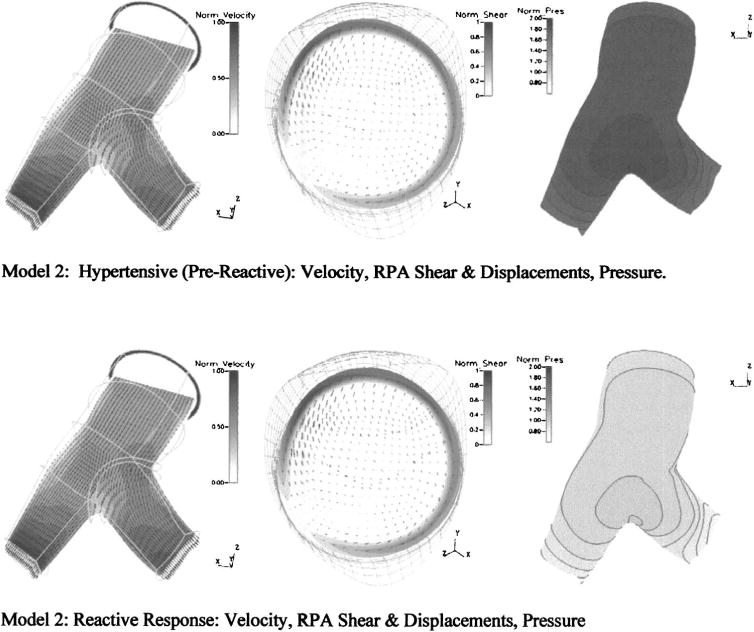
Primary velocity fields, pressures, and WSS at a cross section of the RPA from model 2 under hypertensive and reactive conditions
Discussion
Although the literature contains several examples of single-case patient-specific CFD modeling—typically from images obtained from magnetic resonance imaging (MRI) or from ex-vivo specimens—to our knowledge no published studies have examined an interventional simulation approach on multiple patient-specific models with fluid-structure interaction; these two items are most novel in this approach. First, through a single catheter imaging session as is routinely performed for these patients, the clinician may obtain, in addition to overall hemodynamics (mean pressure, cardiac output, etc.) detailed information on a spectrum of vascular parameters including velocity fields, pressure fields, shear stress topology, and arterial deformation. The simplicity of the reconstruction method allows for the rapid production of the patient-specific meshes required for large studies. Although we deliberately limited our presentation to only two such models here, we have recently performed simulations on four such models. A complete construction for multiple branches of the PA requires less than 1 h. Hence, the method can easily handle generation of 10–15 patient-specific models per week, corresponding to our institution’s weekly caseload; recently, we completed ten new models in a single week in preparation for our next efforts at patient-specific simulation. Second, the inclusion of bidirectional fluid structure interaction maintains the inherently coupled dynamics of proximal arterial motion and blood flow, which in turn allows the model to be as functionally realistic as possible. Recent studies have shown that changes in pulmonary arterial compliance can alter overall ventricular workload [5]; here, we see coupled changes in PA stiffness and PVR affecting mean pressure, an indicator of workload. Bidirectional FSI also eliminates the need to perform lengthy time-specific (“four-dimensional”) imaging.
In the context of interventions, simulations can provide the clinician diagnostic information and a measure of vascular hemodynamic efficacy, both of which can be critical in determining whether a particular surgery should proceed. Patients with septal defects (SD) frequently also have by secondary pulmonary hypertension, which has seen shown to be a significant predictor of post-operative mortality and morbidity [33]. Thus, reducing the negative hemodynamic effects due to pulmonary hypertension should help post-operative recovery. This method should therefore assist the cardiologist by providing detailed information on postoperative hemodynamic status prior to surgery, and in this manner should help determine whether the patient is ready for surgery at that point or whether drug therapy should continue. Analysis of the WSS field, in addition to pulmonary vascular pressures, PVR and input impedance, all of which may be obtained using this technique, should provide a comprehensive means of evaluating the progression of the pulmonary hypertension. For example, although model 1 had only small changes in arterial displacement and strain from pre-op to post-op, the substantial drop in WSS between the cases has enormous implications for proximal arterial remodeling [32,35] which could increase RV afterload. WSS is one of the primary modulators of endothelial cell expression [3,4]; therefore, changes in wall shear can have profound consequences for downstream vascular tone, smooth muscle function, and in the chronic time scale, progression of pulmonary vascular disease. Note that the current clinical standard for evaluating pulmonary hypertension, i.e., measuring PVR, would not have provided useful data for this patient since both pre- and post-op conditions display low PVR.
When applied to reactivity testing and PAH diagnosis, the computational results not only provide a greater wealth of data regarding local hemodynamics and pressure, but also an avenue by which the clinician may pursue fundamental studies of vascular function. Because measurements of secondary flows and WSS in the distal vasculature cannot currently be measured during reactivity testing, only this method allows for the comparison of these two quantities, in addition to pressure, between normal and reactive states. Through such comparison, the effectiveness of therapeutic vasodilator delivery could be better assessed. Further, the degree of arterial remodeling may be discerned from simulations of the reactive condition optimized to predict global conditions such as pressure and flow by varying linear incremental modulus. As the models increase in size to include multiple branches, differences in distal diastolic runoff and WSS from such models obtained while serially tracking a patient may be used to examine the existence of the PAH “feedback” mechanism mentioned in the introduction. Finally, such calculations, when coupled with noninvasive imaging methods, provide a likely path to non-invasively assess vascular pressures.
Limitations
While we believe this study represents a significant advance in patient-specific hemodynamic modeling, several limitations remain. Meshes obtained from bi-plane angiogram images rely on the assumption of a circular cross-sectional profile, at the time of measurement; however, FSI allows the geometry to deform as a function of wall compliance and trans-mural pressure. MRI structural measurements occasionally reveal more ellipsoidal cross-sections in both the MPA and its branches; such ellipsoidal sections could produce more complex secondary flows. To examine this prospect, we are developing 3D MRI imaging methods as the basis for the structural model to more accurately reproduce vascular cross-sectional geometry, in addition to the bi-plane angiography method. Further, the reconstruction method [18] is currently undergoing improvements that allow for diameter measurements in both image planes, which would allow for ellipsoidal cross sections.
An additional flow assumption is the use of constant pressure fluid outlet conditions as derived in Eq. (3), which simplifies the complex flow impedance presented by the distal vasculature to merely a resistance condition and precludes the existence of diastolic flow. Such simplification appears possible for these single branch models, but becomes ungainly with greater than two fluid exits, as would be found in multi-branch models. We plan to improve this exit condition through the incorporation of a fractal tree exit model into our PVR outlet calculation, examples of which exist in the literature [36,37]; such a model provides specification of the flow impedance at the exit. The addition of subsequent branches downstream is an additional area of ongoing work.
Our linear elastic model of the structure is a reasonable first approximation to artery behavior given that larger pulmonary arteries (>1 mm) exhibit essentially linear mechanical properties (radius-versus-distending pressure) over the range of physiological pressures [38–40]. Maximum strain in both models at peak systole is on the order of 50%, and occurs at each junction; this value is seen in only a very small region in each model. Average strain for each was approximately 5%. To account for these large strains and arterial hyperelastic behavior, we plan to employ a microstructurally based orthotropic hyperelastic model [23] that simulates pulmonary artery mechanics under normotensive and hypertensive conditions, i.e. handles wall constitutive changes due to pressure reactivity and arterial remodeling. The effects of pre-stress on the vasculature [24,25] will also be investigated in future FSI models.
In conclusion, we have presented a novel method for the reconstruction of artery 3D geometry from bi-plane angiogram images; a new computational approach toward modeling coupled hemodynamics and artery motion in the pulmonary circuit; and velocity, wall shear, and pressure fields resulting from two two-case “virtual intervention” models. This new technique provides richer detail of pulmonary hemodynamics and mechanics than can be obtained from current imaging techniques, should allow maximum characterization of vascular function in the clinical situation, and holds promise for enabling surgical planning.
Acknowledgments
This project was supported in part by grants from the NIH (HL 067397, HL 072738). We would also like to thank S. Y. James Chen, Ph.D., and John D. Carroll, M. D., of the Division of Cardiology at UCHSC, whose work on geometric reconstruction was critical to this effort, and Dennis Chang, M. D., and Kak-Chen Chan, M. D., of the Department of Pediatric Cardiology at UCHSC, who provided clinical data.
Contributor Information
Kendall S. Hunter, Email: hunterk@colorado.edu, Department of Pediatric Cardiology, University of Colorado Health Sciences Center, 1056 E. 19th Ave., Denver CO, 80218 and Applied Mechanics Department, Anteon Inc., 210 Oral School Road St 105, Mystic CT 06355
Craig J. Lanning, Department of Pediatric Cardiology, University of Colorado Health Sciences Center, 1056 E. 19th Ave., Denver CO 80218
Shiuh-Yung J. Chen, Division of Cardiology, University of Colorado Health Sciences Center, 4200 E. 9th Ave., Denver, CO 80262
Yanhang Zhang, Department of Mechanical Engineering, University of Colorado at Boulder, Boulder CO 80309.
Ruchira Garg, Department of Pediatric Cardiology, University of Colorado Health Sciences Center, 1056 E. 19th Ave., Denver CO 80218.
D. Dunbar Ivy, Department of Pediatric Cardiology, University of Colorado Health Sciences Center, 1056 E. 19th Ave., Denver CO 80218.
Robin Shandas, Department of Pediatric Cardiology, University of Colorado Health Sciences Center, 1056 E. 19th Ave., Denver CO, 80218 and Department of Mechanical Engineering, University of Colorado at Boulder, Boulder CO 80309.
References
- 1.Davies PF. Flow Mediated Endothelial Mechanotransduction. Physiol Rev. 1995;75:519–560. doi: 10.1152/physrev.1995.75.3.519. [DOI] [PMC free article] [PubMed] [Google Scholar]
- 2.Malek AM, Alper SL, Izumo S. Hemodynamic Shear Stress and Its Role in Artherosclerosis. JAMA, J Am Med Assoc. 1999;282:2035–2042. doi: 10.1001/jama.282.21.2035. [DOI] [PubMed] [Google Scholar]
- 3.Topper JN, Cai J, Falb D, Gimbrone MA. Identification of Vascular Endothelial Genes Differentially Responsive to Fluid Mechanical Stimuli: Cycoloxgenase-2, Manganese Superoxide Dismutase, and Endothelial Cell Nitric Oxide Synthase are Selectively Up-Regulated by Steady Laminar Shear Stress. Proc Natl Acad Sci USA. 1996;93:10417–10422. doi: 10.1073/pnas.93.19.10417. [DOI] [PMC free article] [PubMed] [Google Scholar]
- 4.Ziegler T, Bouzourène K, Harrison VJ, Brunner HR, Hayoz D. Influence of Oscillatory and Unidirectional Flow Environments on the Expression of Endothelin and Nitric Oxide Synthase in Cultured Endothelial Cells. Arterioscler, Thromb, Vasc Biol. 1998;18:686–692. doi: 10.1161/01.atv.18.5.686. [DOI] [PubMed] [Google Scholar]
- 5.Weinberg CE, Hertzberg JR, Ivy DD, Kirby KS, Chan KC, Valdes-Cruz L, Shandas R. Extraction of Pulmonary Vascular Compliance, Pulmonary Vascular Resistance, and Right Ventricular Work From Single-Pressure and Doppler Flow Measurements in Children With Pulmonary Hypertension: A New Method for Evaluating Reactivity—In Vitro and Clinical Studies. Circulation. 2005;110(17):2609–2617. doi: 10.1161/01.CIR.0000146818.60588.40. [DOI] [PubMed] [Google Scholar]
- 6.Dyer KL, Das B, Lanning CL, Ivy DD, Valdes-Cruz L, Shandas R. Noninvasive Tissue Doppler Measurement of Pulmonary Artery Compliance in Children With Pulmonary Hypertension. Pediatr Res. 2004;55(4):39A. doi: 10.1016/j.echo.2005.11.012. [DOI] [PMC free article] [PubMed] [Google Scholar]
- 7.Bathe M, Kamm RD. A Fluid-Structure Interaction Finite Element Analysis of Pulsatile Blood Flow Through a Compliant Stenotic Artery. ASME J Biomech Eng. 1998;121(4):361–396. doi: 10.1115/1.2798332. [DOI] [PubMed] [Google Scholar]
- 8.Zhang W, Herrera C, Atluri SN, Kassab GS. Effect of Surrounding Tissue on Vessel Fluid and Solid Mechanics. ASME J Biomech Eng. 2004;126(6):760–769. doi: 10.1115/1.1824128. [DOI] [PubMed] [Google Scholar]
- 9.Tang D, Yang C, Kobayashi S, Ku DN. Steady Flow and Wall Compression in Stenotic Arteries: A Three Dimensional Thick-Wall Model With Fluid-Wall Interactions. ASME J Biomech Eng. 2001;123(6):548–557. doi: 10.1115/1.1406036. [DOI] [PubMed] [Google Scholar]
- 10.Tang D, Yang C, Walker H, Kobayachi S, Ku DN. Simulating Cyclic Artery Compression Using a 3D Unsteady Model With Fluid-Structure Interactions. Comput Struct. 2002;80(20):1651–1665. [Google Scholar]
- 11.Tang D, Yang C, Kobayashi S, Zheng J, Vito RP. Effect of Steosis Asymmetry on Blood Flow and Artery Compression: A Three-Dimensional Fluid-Structure Interaction Model. Ann Biomed Eng. 2003;31(10):1182–1193. doi: 10.1114/1.1615577. [DOI] [PubMed] [Google Scholar]
- 12.Lee KW, Wood NB, Xu XY. Ultrasound Image-Based Computer Model of a Common Carotid Artery With a Plaque. Med Eng Phys. 2004;26(10):823–840. doi: 10.1016/j.medengphy.2004.08.013. [DOI] [PubMed] [Google Scholar]
- 13.Ramaswamy SD, Vigmostad SC, Wahle A, Lai YG, Olszewski ME, Braddy KC, Brennan TMH, Rossen JD, Sonka M, Chandran KB. Fluid Dynamic Analysis in a Human Left Anterior Descending Coronary Artery With Arterial Motion. Ann Biomed Eng. 2004;32(12):1628–1642. doi: 10.1007/s10439-004-7816-3. [DOI] [PubMed] [Google Scholar]
- 14.Tang D, Yang C, Kobayashi S, Ku DN. Effects of a Lipid Pool on Stress/Strain Distributions in Stenotic Arteries: 3-D Fluid-Structure (FSI) Models. ASME J Biomech Eng. 2004;126(3):363–370. doi: 10.1115/1.1762898. [DOI] [PubMed] [Google Scholar]
- 15.Tang D, Yang C, Zheng J, Woodard PK, Sicard GA, Saffitz JE, Yuan C. 3D MRI-Based Multicomponent FSI Models for Athersclerotic Plaques. Ann Biomed Eng. 2004;32(7):947–960. doi: 10.1023/b:abme.0000032457.10191.e0. [DOI] [PubMed] [Google Scholar]
- 16.DeGroff CG, Orlando WW, Shandas R. Insights Into the Effect of Aortic Compliance on Doppler Diastolic Flow Patterns Seen in Coarctation of the Aorta: A Numeric Study. J Am Soc Echocardiogr. 2003;16(2):162–169. doi: 10.1067/mje.2003.20. [DOI] [PubMed] [Google Scholar]
- 17.Formaggia L, Gerbeau JF, Nobile F, Quateroni A. On the Coupling of 3D and 1D Navier-Stokes equations for Flow Problems in Compliant Vessels. Comput Methods Appl Mech Eng. 2001;191(6–7):561–582. [Google Scholar]
- 18.Chen SYJ, Carroll JD. 3-D Reconstruction of Coronary Arterial Tree to Optimize Angiographic Visualization. IEEE Trans Med Imaging. 2000;19(4):318–336. doi: 10.1109/42.848183. [DOI] [PubMed] [Google Scholar]
- 19.Rodes-Cabau J, Domingo E, Roman A, Majo J, Lara B, Padilla F, Anivarro I, Angel J, Tardif JC, Soler-Soler J. Intravascular Ultrasound of the Elastic Pulmonary Arteries: A New Approach for the Evaluation of Primary Pulmonary Hypertension. Heart. 2003;89(3):311–316. doi: 10.1136/heart.89.3.311. [DOI] [PMC free article] [PubMed] [Google Scholar]
- 20.Nield DA, Bejan A. Convection in Porous Media. 2. Springer; New York: 1999. [Google Scholar]
- 21.Milnor WR. Hemodynamics. Williams and Wilkins; Baltimore: 1989. [Google Scholar]
- 22.Pannati G, Migliavacca F, Dubini G, Pietrabissa R, deLeval MR. A Mathematical Model of Circulation in the Presence of Bidirectional Cavopulmonary Anastomosis in Children With an Univentricular Heart. Med Eng Phys. 1997;19(3):223–234. doi: 10.1016/s1350-4533(96)00071-9. [DOI] [PubMed] [Google Scholar]
- 23.Zhang Y, Dunn ML, Drexler ES, McCowan CN, Slifka AJ, Ivy DD, Shandas R. A Microstructural Hyperelastic Model of Pulmonary Arteries Under Normo- and Hypertensive Conditions. Ann Biomed Eng. 2005;33(8):1042–1052. doi: 10.1007/s10439-005-5771-2. [DOI] [PubMed] [Google Scholar]
- 24.Fung YC, Liu SO. Strain Distribution in Small Blood Vessels With Zero-Stress State Taken Into Consideration. Am J Physiol. 1992;262(2):H544–H552. doi: 10.1152/ajpheart.1992.262.2.H544. [DOI] [PubMed] [Google Scholar]
- 25.Delfino A, Stergiopulos N, Moore JE, Meister JJ. Residual Strain Effects on the Stress Field in a Thick Wall Finite Element Model of the Human Carotid Bifurcation. J Biomech. 1997;30(8):777–786. doi: 10.1016/s0021-9290(97)00025-0. [DOI] [PubMed] [Google Scholar]
- 26.Patankar SV. Numerical Heat Transfer and Fluid Flow. McGraw-Hill; New York: 1980. [Google Scholar]
- 27.Cook RD. Concepts and Applications of Finite Element Analysis. Wiley; New York: 2002. [Google Scholar]
- 28.Khunatorn Y, Shandas R, DeGroff CG, Mahalingam S. Comparison of In Vitro Velocity Measurements in a Scaled Total Cavopulmonary Connection With Computational Predictions. Ann Biomed Eng. 2003;31(7):810–822. doi: 10.1114/1.1584684. [DOI] [PubMed] [Google Scholar]
- 29.Khunatorn Y, Mahalingam S, DeGroff CG, Shandas R. Influence of Connection Geometry and SVC-IVC Flow Rate Ratio on Flow Structures Within the Total Cavopulmonary Connection: A Numerical Study. ASME J Biomech Eng. 2002;124(4):364–377. doi: 10.1115/1.1487880. [DOI] [PubMed] [Google Scholar]
- 30.DeGroff CG, Orlando W, Hertzberg J, Shandas R, Valdes-Cruz L. Effect of Reverse Flow on the Fluid Dynamics of the Total Cavo-Pulmonary Connection: A Potential Cause of Progressive Heart Failure. J Am Coll Cardiol. 2002;39(5):407A–407A. [Google Scholar]
- 31.Birnbaum B, Orlando W, Shandas R, Hertzberg J, Degroff C. Oscillatory Events With Steady Flow Boundary Conditions in Numerical Simulations of the Fontan Operation. J Investig Med. 2004;52(1):S170–S170. [Google Scholar]
- 32.Kawut SM, Horn EM, Berekasvili KK, Garofono RP, Goldsmith RL, Widlitz AC, Rosenzweig EB, Kerstein D, Basrt RJ. New Predictors of Outcome in Idiopathic Pulmonary Arterial Hypertension. Am J Cardiol. 2005;95(2):199–203. doi: 10.1016/j.amjcard.2004.09.006. [DOI] [PubMed] [Google Scholar]
- 33.Rashid A, Ivy D. Severe Pediatric Pulmonary Hypertension: New Management Strategies. Arch Dis Child. 2005;90:92–98. doi: 10.1136/adc.2003.048744. [DOI] [PMC free article] [PubMed] [Google Scholar]
- 34.Sho E, Komatsu M, Sho M, Nanjo H, Singh TM, Xu CP, Masuda H, Zarins CK. High Flow Drives Vascular Endothelial Cell Proliferation During Flow-Induced Arterial Remodeling Associated With the Expression of Vascular Endothelial Growth Factor. Exp Mol Pathol. 2003;75(1):1–11. doi: 10.1016/s0014-4800(03)00032-7. [DOI] [PubMed] [Google Scholar]
- 35.Sho E, Nanjo H, Sho M, Kobayashi M, Komatsu M, Kawamura K, Xu CP, Zarins CK, Masuda H. Arterial Enlargement, Tortuosity, and Intimal Thickening in Response to Sequential Exposure to High and Low Wall Shear Stress. J Vasc Surg. 2004;39(3):601–612. doi: 10.1016/j.jvs.2003.10.058. [DOI] [PubMed] [Google Scholar]
- 36.Brown DJ. Input Impedance and Reflection Coefficient in Fractal-Like Models of Asymmetrically Branching Compliant d\Tubes. IEEE Trans Biomed Eng. 1996;43(7):715–722. doi: 10.1109/10.503179. [DOI] [PubMed] [Google Scholar]
- 37.Olufsen MS. Structured Tree Outflow Conditions for Blood Flow in Larger Systemic Arteries. Am J Physiol. 1999;276(1):H257–H268. doi: 10.1152/ajpheart.1999.276.1.H257. [DOI] [PubMed] [Google Scholar]
- 38.Greenfield JC, Griggs DM. Relations Between Pressure and Diameter in Main Pulmonary Artery of Man. J Appl Physiol. 1963;18(3):557–559. doi: 10.1152/jappl.1963.18.3.557. [DOI] [PubMed] [Google Scholar]
- 39.Gurtner HP, Walser P, Fassler B. Normal Values for Pulmonary Hemodynamics at Rest and During Exercise in Man. Prog Resp Res. 1975;9:295–315. [Google Scholar]
- 40.Slife DM, Latham RD, Sipkema P, Westerhof N. Pulmonary Arterial Compliance at Rest and Exercise in Normal Humans. Am J Physiol. 1990;258:H1823–H1828. doi: 10.1152/ajpheart.1990.258.6.H1823. [DOI] [PubMed] [Google Scholar]