

Abstract
Activation of the human embryonic stem cell (hESC)-signature genes has been observed in various epithelial cancers. In this study, we found that the hESC signature is selectively induced in the airway basal stem/progenitor cell population of healthy smokers (BC-S), with a pattern similar to that activated in all major types of human lung cancer. We further identified a subset of 6 BC-S hESC genes, whose coherent overexpression in lung AdCa was associated with reduced lung function, poorer differentiation grade, more advanced tumor stage, remarkably shorter survival and higher frequency of TP53 mutations. BC-S shared with hESC and a considerable subset of lung carcinomas a common TP53 inactivation molecular pattern which strongly correlated with the BC-S hESC gene expression. These data provide transcriptome-based evidence that smoking-induced reprogramming of airway BC towards the hESC-like phenotype might represent a common early molecular event in the development of aggressive lung carcinomas in humans.
Keywords: Airway epithelium, basal cells, gene expression, lung cancer, stem cells
Introduction
Embryonic stem cells (ESC) express a unique transcriptional program that determines their continuous self-renewal and pluripotency [1, 2]. A comprehensive meta-analysis of the hESC transcriptome [3] identified 40 genes that are specifically expressed in hESC but rarely, if ever, detectable in the normal adult tissues. The exception, however, is cancer, where a number of these “hESC-signature” genes are overexpressed [4-6].
Although current data indicate that expression of a hESC-like transcriptional program is a molecular feature of advanced cancers, it is possible that elements of this program are acquired by adult healthy tissues chronically exposed to carcinogens prior to clinical manifestations of cancer. Specifically, we hypothesized that the earliest features of transition towards the hESC-like molecular phenotype are already present in the stem/progenitor cells of healthy individuals that, under the influence of chronic oncogenic stress, acquire this program to evolve into cancer-propagating cells.
Cigarette smoking is the dominant environmental carcinogenic stressor for airway epithelial cells, capable of evoking dramatic changes in the epithelial gene expression program [7, 8] and inducing oncogenic mutations and epigenetic modifications relevant to lung cancer [9, 10]. In susceptible individuals, smoking is responsible for inducing airway epithelial cells to change their normal differentiation pattern, undergo increased proliferation and eventually become malignant [10, 11]. The normal human airway epithelium is comprised of 4 major cell types: ciliated, secretory, intermediate/undifferentiated and basal cells (BC) [12]. The BC population constitutes the stem/progenitor cell pool, capable of self-renewing and differentiating into the specialized cellular elements of the mucociliary airway epithelium [13-16]. BC hyperplasia and squamous metaplasia are the earliest airway epithelial lesions associated with smoking-induced carcinogenesis [10, 11]. However, the role of airway BC as a potential cellular origin of early molecular changes in the airway epithelium relevant to the development of lung cancer in smokers remains unknown. We hypothesized that cigarette smoking reprograms airway BC of healthy individuals toward a hESC-like molecular phenotype relevant to lung cancer.
Methods
Study Population and Datasets
Large airway epithelium (LAE) was obtained from 21 healthy nonsmokers and 31 healthy smokers (Supplementary Material). All individuals were evaluated at the Weill Cornell NIH Clinical and Translational Science Center and Department of Genetic Medicine Clinical Research Facility, under protocols approved by the Weill Cornell Medical College Institutional Review Board. Before enrollment, written informed consent was obtained from each individual. Previously published gene expression data from 193 of 199 primary lung AdCa of individuals undergoing surgery at Memorial Sloan-Kettering Cancer Center (MSKCC) was used for analysis [17]. Independent publically available lung cancer datasets included Landi et al (AdCa, n=58) [18], Kuner et al (AdCa, n=42; SCC, n=18) [19], Garber et al (AdCa, n=40; SCC, n=13; SCLC, n=4; LCLC; n=4), Bild et al (AdCa, n=58; SCC, n=53) [20]. The hESC datasets included Avery et al (n=3) [21] and Denis et al (GSE8590; n=2).
Human LAE and Airway BC
LAE was collected via flexible bronchoscopy as previously described [22]. For purification of airway BC, LAE cells were cultured on type IV collagen using previously described methodology [23] (Supplementary Material). At day 7 to 8 of culture, when the cells were 70% confluent, cytospin preparations were made for immunohistochemical characterization, and RNA was extracted (Supplementary Material). The resulting cells were >95% positive for cytokeratin 5 (K5), a BC marker [16], and negative for the mesenchymal cell marker N-cadherin, secretory cell marker mucin 5AC, ciliated cell marker β-tubulin IV (Figure 1A), and neuroendocrine cell markers chromogranin A and calcitonin gene-related peptide (data not shown). The capacity of obtained BC to generate differentiated progenies was confirmed by culturing them using the air-liquid interface (ALI) model of airway epithelial differentiation [13] (Supplementary Material).
Figure 1.
Enrichment of hESC-signature genes in airway basal cells (BC). A. Immunocytochemical verification of the BC phenotype. After 7 days of culture of freshly isolated large airway epithelium (LAE), the cells were analyzed for expression of cytokeratin 5 (BC-specific marker), N-cahedrin (mesenchymal marker), mucin 5AC (secretory cell marker), and β-tubulin IV (ciliated cell marker). Scale bar = 10 μm. B. BC differentiation into ciliated airway epithelium on air-liquid interface (ALI). Appearance of ciliated cells was monitored by expression of β-tubulin IV weekly by immunofluorescence. Scale bar = 10 μm. C. Volcano plot comparing expression of hESC-signature gene probe sets in BC of nonsmokers (BC-NS; n=4) vs LAE-NS (n=21). D. Heat-map of the hESC-signature gene expression changes during BC differentiation on ALI. Genes detected in at least 1 group were mapped and color coded according to their mean normalized expression at each time point (n=3 in each group). E. Principal component analysis of LAE-NS (green circles; n=21), BC-NS (blue circles; n=3), BC differentiated in ALI cultures during 7 days (ALI d7, orange circles; n=3), BC differentiated in ALI cultures during 14 days (ALI d14, purple circles; n=3), and hESC (black circles; from datasets of Avery et al. [21], n=3; and Denis et al. [GSE8590], n=2) based on the expression of the 40 hESC-signature genes (see Supplemental Table I). The samples within each group were placed in a 3 dimensional space based on the expression pattern using mean centering and scaling function; each circle represents an individual sample. The % contributions of the first 3 principal components (PC) to the observed variability are indicated.
Xenograft-based Propagation of Human Lung Adenocarcinomas
Tumor cells isolated from 4 patients with human lung AdCa were passaged at least twice in non-obese diabetic severe combined immunodeficiency (NOD.CB17-Prkdcscid/J; NOD/SCID) interleukin 2 receptor (IL2R) gamma null immunocompromised mice (Jackson Laboratory; Bar Harbor, ME; Supplementary Material). After the final passage, tumor cells were processed for RNA isolation.
Preparation, Microarray Processing and Data Analysis
Transcriptome analysis of LAE, BC and mouse-propagated AdCa samples was performed using HG-U133 Plus 2.0 array (Affymetrix, Santa Clara, CA) and MAS5-processed data was normalized and analyzed using GeneSpring version 7.3.1 (Agilent Technologies, Palo Alto, CA) (Supplementary Material). To provide a cumulative measure of an individual signature expression in AdCa samples, signature-specific indices were calculated for each individual AdCa sample as a number of signature genes with the expression level above the median in AdCa subjects. The raw data are all publically available at the Gene Expression Omnibus (GEO) site (http://www.ncbi.nlm.nih.gov/geo/), accession number is GSE19722. The expression data for 193 primary human AdCa samples have been published previously [17]. Independent lung cancer datasets were analyzed using ONCOMINE database [24] or using GeneSpring software (for databases imported from the GEO).
Massively Parallel mRNA Sequencing
The RNA sequencing (RNA-Seq) methodology is provided in Supplementary Material.
Gene Expression Analysis of Cell Lines
NCI-H522, NCI-HI299, NCI-H338, and A549 lung carcinoma cell lines were purchased from ATCC (Rockville, MD) and cultured according to the ATCC protocols. Expression of selected hESC genes was analyzed using specific TaqMan assays (Applied Biosystems, Foster City, CA) as described [25]. Selection of cell lines for the analysis was based on the UMD p53 mutation database (http://p53.free.fr).
Survival Analysis and Comparison of Clinical Characteristics
Survival analysis was performed by Kaplan-Meier method and multivariate Cox proportional-hazard regression model using MedCalc version 11.3.3 (http://www.medcalc.be/). To analyze the effect of the 6-gene BC-S hESC-signature, AdCa patients were arbitrarily divided into “high expressors” (all 6 genes expressed above the median level in AdCa cohort) and “low expressors” (none of these genes expressed above the median level in AdCa cohort). To analyze the effect of the 25-gene non-BC-S hESC-signature, AdCa patients were arbitrarily divided into “high expressors” (≥10 genes expressed above the median level in AdCa cohort) and “low expressors” (≤4 genes expressed above the median level in AdCa cohort). In Kaplan-Meyer analysis, difference in survival between the groups was analyzed with the log-rank test. In the multivariate Cox analysis, covariates included age, gender, pathologic tumor stage, COPD, and BC-S hESC-signature expression (low, high). Clinical characteristics were compared using Chi-square test (for categorical variables) and Kolmogorov-Smirnov test (for continuous variables).
Results
hESC-signature Genes are Expressed in Adult Human Airway Epithelium
Based on the knowledge that BC, due to their unique pattern of integrin expression [26], exhibit superior capabilities of adhesion and migration and, as stem/progenitor cells, can self-renew and proliferate [16, 27], and previous observations of the BC-like phenotype of airway epithelial cells grown in vitro [28], we developed a method to obtain pure populations of airway BC by culturing freshly isolated LAE cells on type IV collagen (Methods; [23]). The BC pheno-type of derived cells was confirmed by staining for BC-specific marker cytokeratin 5 [16, 27] (>95% positive cells), but negative staining for mesenchymal (N-cadherin), secretory (MUC5AC) and ciliated cell (β-tubulin IV) markers (Figure 1A). The isolated BC were capable of generating differentiated ciliated airway epithelium in an air-liquid interface (ALI) culture (Figure 1B).
We first analyzed expression of the 40-gene hESC-signature expression in the LAE and LAE-derived BC of healthy nonsmokers (LAE-NS and BC-NS, respectively). Remarkably, 25% of hESC-signature genes were detected in at least 50% of samples in both groups (Supplementary Table I). Some of the hESC-signature genes were expressed in the LAE, but not in BC (e.g., ABHD9, CYP26A1, HESX1, and NANOG), i.e., were cell differentiation-associated. Others (e.g., CDC25A, DTYMK, EPHA1, ISG20L1, and ORC2L) were expressed more abundantly in the BC population (Supplementary Figure 1).
Among 27 hESC-signature genes detected in either LAE-NS or BC-NS, 15 were differentially expressed, with the majority (12 of 15) significantly up-regulated in BC (Figure 1C). Microarray analysis of BC differentiation in vitro in ALI revealed that while expression of a minor subset of hESC-signature genes increased with cell differentiation, including ABHD9 and CYP26A1, the majority of hESC genes down-regulated during airway epithelial differentiation (Figure 1D). The major changes occurred within the first 2 wk of differentiation (Figure 1D), a time necessary for the appearance of ciliated cells in the ALI differentiation model (Figure 1B). Consistently, principal component analysis (PCA) revealed a significant difference between complete LAE and BC based on the expression of hESC-signature genes, with BC clustered closer to hESCs but shifted toward completely differentiated in vivo LAE during the first 2 wk of differentiation in ALI (Figure 1E).
Smoking Induces hESC-signature in Airway BC
Next, we asked whether smoking induces expression of hESC-signature elements in the airway epithelium. Whereas hESC-signature expression by the complete LAE of healthy smokers (LAE-S) did not differ significantly from LAE-NS (Figure 2A, left panel), BC of healthy smokers (BC-S) exhibited a broad up-regulation of hESC-signature genes compared to BC-NS (Figure 2A; right panel). Of 35 hESC-signature gene probes expressed in BC-NS and/or BC-S, 18 (51%) probes corresponding to 13 (33%) genes were differentially expressed between these 2 groups, with all significantly up-regulated in BC-S (Supplementary Table I). Notably, 10 of these 13 genes were not detected in BC-NS, indicative of their de novo expression in BC-S (Supplementary Table I).
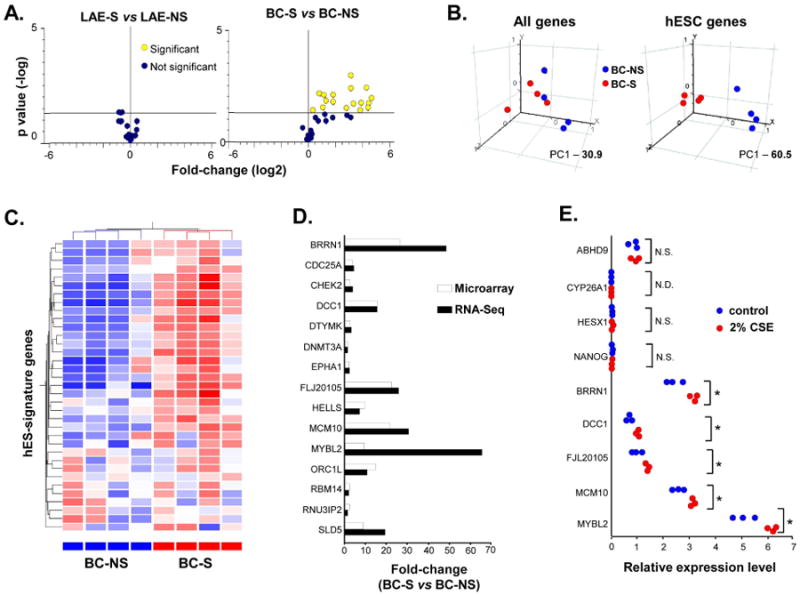
Figure 2.

Induction of hESC-signature in basal cells of healthy smokers (BC-S). A. Left panel -volcano plot comparing expression of hESC-signature gene probe sets in large airway epithelium (LAE) of healthy smokers (LAE-S; n=31) vs LAE of healthy nonsmokers (LAE-NS; n=21). Right panel - volcano plot comparing expression of hESC-signature gene probe sets in BC-S (n=4) vs BC of healthy nonsmokers (BC-NS; n=4). B. Principal component analysis of BC-NS (blue dots; n=4) and BC-S (red dots; n=4) on all expressed gene probe sets (left panel) and hESC-signature gene probe sets (right panel). The percentage contributions of the first principal component (PC1) to the observed variabilities are indicated. C. Unsupervised hierarchical cluster analysis of BC-NS and BC-S based on expression of detected hESC-signature genes. Genes expressed above the average are represented in red, below average in blue, and average in white. D. Fold-changes for differentially expressed hESC-signature genes in BC-S vs BC-NS determined by microarray analysis (white bars; n=4 in each group) and RNA-Seq (black bars; n=2 in each group). E. Expression of selected hESC-signature genes in BC-NS stimulated with 2% cigarette smoke extract (CSE) for 48 h (red dots; n=3) compared to unstimulated cells (blue dots; n=3) determined by TaqMan PCR; * p <0.05; N.S. - nonsignificant: N.D. - not detected.
These differences were not due to the nonspecific BC transcriptome activation by smoking, as expression of housekeeping genes was unchanged (Supplementary Figure 2). Moreover, PCA revealed that, whereas smoking-induced transcriptome-wide changes had only limited contribution to variability between different groups for both LAE (Supplementary Figure 3A; left panel) and BC (Figure 2B, left panel), healthy smokers and nonsmokers were completely segregated from each other based on the hESC-signature expression in BC (Figure 2B, right panel), but not in the complete LAE (Supplementary Figure 3B, left panel). Consistently, unsupervised hierarchical cluster analysis completely separated BC-S from BC-NS based on the hESC-signature expression (Figure 2C).
We used RNA-Sequencing (RNA-Seq) to validate differential expression of hESC-signature genes in BC-S vs BC-NS. This analysis revealed overlap between differentially expressed hESC-signature genes identified by RNA-Seq and microarray (Supplementary Figure 4A). Consistently, all 13 hESC-signature genes identified by microarray as up-regulated in BC-S displayed similar direction of expression differences in the RNA-Seq analysis (Figures 2D, Supplementary Figure 4B). RNA-Seq revealed 2 additional hESC-signature genes up-regulated in BC-S (Supplementary Table II). Thus, using both methods, a total of 15 hESC-signature genes were found up-regulated in BC-S compared to BC-NS. This set of genes was referred to as smoking-induced BC hESC-signature (“BC-S hESC-signature”).
To determine whether up-regulation of the hESC-signature genes in BC-S was a result of the direct effect of cigarette smoke on BC, BC-NS were stimulated in vitro with cigarette smoke extract (CSE) as previously described [25]. Indeed, CSE significantly up-regulated expression of the hESC-signature genes found induced in BC-S in vivo, but not those whose expression was unchanged in BC-S in vivo nor those associated with airway epithelial differentiation (Figure 2E). As additional evidence that up-regulation of the hESC-signature genes in BC after stimulation with CSE was smoke-dependent and not due to the nonspecific activation of the BC transcriptome, BC exposed to 2% CSE in vitro showed up-regulation of CYP1A1, CYP1B1 and NQO1, well-known smoking-responsive genes in the airway epithelium [7, 22], whereas expression of the BC-signature genes KRT5, KRT6B, and ITGA6 [23] remained unchanged (Supplementary Figure 5).
BC-S hESC-signature Contributes to the hESC-like Phenotype of Human Lung Adenocarcinoma
Based on observations that lung adenocarcinomas (AdCa) exhibit a hESC-like molecular profile [5], we asked whether there is a commonality between hESC signatures induced in AdCa and BC-S. We first assessed the hESC-signature expression in primary human lung AdCa cells that had been passaged serially in NOD/SCID/IL2Rgamma-null immunodeficient mice, a strategy that permits evaluation of a pure epithelial compartment of carcinoma cells without the complicating contamination of non-cancer cellular elements contributing to tumor microenvironment that might exhibit hESC-like features [29]. Twenty of 40 hESC-signature genes were significantly up-regulated in AdCa xenografts as compared to both LAE-NS and LAE-S (Figure 3A, upper panels). Whereas AdCa-xenografts displayed a considerable number of up-regulated hESC-signature genes compared to BC-NS (Figure 3A, left lower panel), the hESC-signature induced in BC-S was similar to that of AdCa-xenografts (Figure 3A, right lower panel). Both unsupervised hierarchical clustering (Figure 3B) and PCA (Figure 3C) demonstrated that, based on the hESC-signature expression, BC-S were completely segregated from the LAE and BC-NS and distributed close to AdCa-xenografts. Consistently, comparative analysis of the hESC index, a cumulative measure of overexpression of hESC-signature genes (see Supplementary Methods), revealed significantly increased average expression of hESC-signature genes in AdCa vs BC-NS, whereas there was no significant difference between AdCa and BC-S (Figure 3D). Of 15 BC-S hESC-signature genes, 12 (80%) were among those overexpressed in AdCa-xenografts (Supplementary Table I).
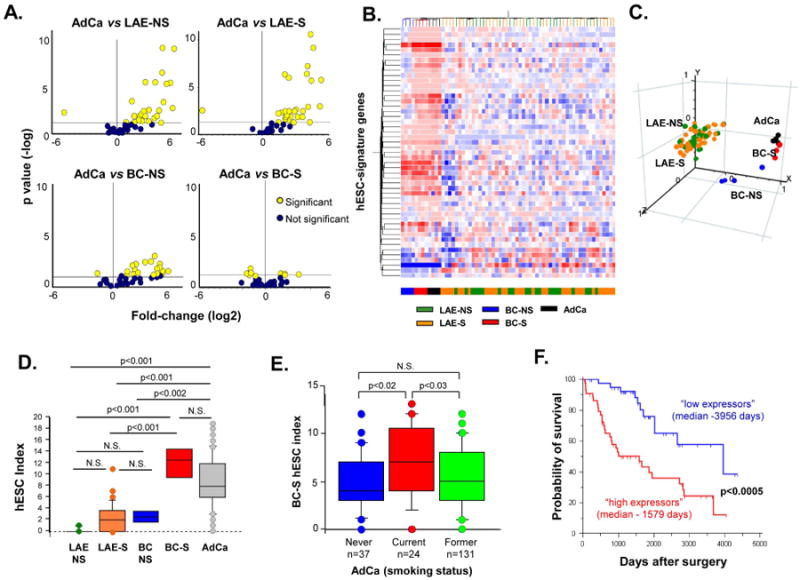
Figure 3.
Relevance of basal cell-smoker (BC-S) hESC-signature to lung adenocarcinoma (AdCa). A. Volcano plots comparing the expression of hESC-signature gene probe sets in human lung AdCa cells following passage in immunocompromised mice (n=4) vs each of the following groups: Large airway epithelium of healthy nonsmokers (LAE-NS) (n=21; upper left panel), LAE of healthy smokers (S) (n=31; upper right panel), BC-NS (n=4; lower left panel), and BC-S (n=4; lower right panel). B. Unsupervised hierarchical clustering analysis of all individual samples belonging to indicted groups based on expression of hESC-signature genes. Genes expressed above the average are represented in red, below average in blue, and average in white. C. Principal component analysis of all individual samples belonging to indicated groups using the list of hESC-specific genes expressed in these study groups as an input dataset. D. Box-plot showing hESC index distribution in LAE-NS (n=21), LAE-S (n=31), BC-NS (n=4), BC-S (n=4), and primary lung AdCa (n=193). See Supplementary Methods for details regarding the index; p values indicated were determined by ANOVA post-hoc with Bonferroni/Dunn correction. E. Box-plot showing BCS hESC index distribution in adenocarcinoma patients categorized based on the smoking status into never-smokers (n=37), current smokers (n=24), and former smokers (n=131). See Methods for index details; p values indicated were determined by ANOVA post-hoc analysis. F. Kaplan-Meier analysis-based estimates of overall survival of lung AdCa patients highly expressing a BC-S hESC-signature gene cluster (high expressors, red curve; n=44,) vs low expressors of these genes (blue curve; n=42); p values indicated were determined by the log-rank test.
Next, the hESC-signature gene expression was assessed in primary tumors obtained from 193 lung AdCa patients [17]. Consistent with the xenograft data, 68% of hESC-signature genes were up-regulated in primary lung AdCa (Supplementary Table I), showing an 89% overlap with the hESC-signature overexpressed in lung AdCa-xenografts. Twelve of 15 (80%) BC-S hESC-signature genes, but only 6 of 25 (24%) remaining hESC-signature genes were up-regulated in primary human lung AdCa (Supplementary Table I), indicating that it is the BC-S hESC-signature genes that predominantly contribute to the hESC-like phenotype in lung AdCa.
BC-S hESC-Signature Predicts Aggressive Lung Adenocarcinoma Phenotype
We next determined the overall BC-S hESC-signature gene expression in 192 adenocarcinoma patients with known clinical information using the BC-S hESC index, a cumulative measure of overexpression of 15 BC-S hESC-signature genes (a number of these genes whose expression was above the median in AdCa subjects). Six hESC-signature genes were identified (BRRN/NCAPH, DCC1/DSCC1, DTYMK, FLJ20105/ERCC6L, MCM10, MYBL2), whose up-regulation in BC-S vs BC-NS was detected by both microarray and RNA-Seq and whose expression in AdCa correlated with the BC-S hESC index (rho>0.6, p<0.0001), representing, therefore, a cluster of co-expressed BC-S hESC-signature genes.
Based on the expression of these 6 BC-S hESC-signature genes, AdCa patients were categorized into “high expressors” (all 6 genes expressed above the median; n=44), and “low expressors” (all 6 genes expressed below the median; n=42). These 2 AdCa groups displayed strikingly opposite clinical and pathologic features (Table I). Consistent with the smoking-dependent nature of the BC-S hESC-signature genes, 91% of high expressors were smokers vs 71% in the low expressor group. BC-S hESC-signature expression was significantly lower in AdCa patients who quit smoking compared to actively smoking AdCa patients (Figure 3E). The high expressors exhibited higher comorbidity with chronic obstructive pulmonary disease (p<0.03), lower lung function parameters such as forced expiratory volume in 1 sec (FEV1; p<0.05) and diffusing capacity of the lungs for carbon monoxide (DLCO; p<0.05). High expressors had more advanced tumors (p<0.04) with larger tumor size (p<0.04), markedly poorer differentiation grade (p<0.0001) and lower frequency of the prognostically favourable bronchoalveolar carcinoma features (p<0.0001) than low expressors. Further, AdCa recurrence was observed in 50% of high expressors compared to 19% of low expressors. Strikingly, high expressors had markedly shorter overall median survival than the low expressors (1,579 days vs 3,956 days; p<0.0005 by log-rank test; Figure 3E). Only 34% of high expressors vs 74% of low expressors were alive at the time of analysis (Table I). By contrast to the BC-S hESC-signature genes, high expression of the non-BC-S hESC-signature genes was not associated with shorter survival of AdCa patients (Supplementary Figure 6). A multivariate survival analysis including various clinical covariates, which may also affect lung cancer survival, such as age, gender, pathologic tumor stage, smoking, and COPD, revealed that high BC-S hESC-signature expression is an independent prognostic factor negatively correlating with AdCa patient survival (p<0.02, hazard ratio 2.62; 0.95% confidence interval 1.23-5.56; Table II).
Table. I. Clinical Characteristics of Lung Adenocarcinoma Phenotypes Identified Based on Expression of the 6-gene Basal Cell Smoking-induced (BC-S) hESC Signature.
| Characteristics | Phenotype | p value3 | ||
|---|---|---|---|---|
|
| ||||
| High expressors1 | Low expressors2 | |||
| Number of subjects | 44 | 42 | ||
| Gender | Male | 20 (45%) | 19 (45%) | N.S5 |
| Female | 24 (55%) | 23 (55%) | ||
| Age (yr) | 69 ± 104 | 64 ± 12 | N.S. | |
| Ever smoking | No | 4 (9%) | 12 (29%) | <0.05 |
| Yes | 40 (91%) | 30 (71%) | ||
| COPD comorbidity | No | 31 (70%) | 39 (93%) | <0.03 |
| Yes | 13 (30%) | 3 (7%) | ||
| FEV1 (% predicted)6 | 61 ± 7 | 83 ± 11 | <0.05 | |
| DLCO (% predicted)7 | 69 ± 24 | 76 ± 7 | <0.05 | |
| Pathologic tumor stage | IA | 7 (16%) | 18 (44%) | <0.01 |
| IB-IV | 37 (84%) | 23 (56%) | ||
| IA | 7 (16%) | 18 (44%) | <0.04 | |
| IB | 14 (32%) | 14 (34%) | ||
| IIA | 1 (2%) | 0 (0%) | ||
| IIB | 9 (20%) | 2 (5%) | ||
| IIIA | 11 (25%) | 5 (12%) | ||
| IIIB | 2 (4%) | 1 (2.5%) | ||
| IV | 0 (0%) | 1 (2.5%) | ||
| Tumor size (cm) | 4.2 ± 2.9 | 3.2 ± 2.1 | <0.04 | |
| Tumor differentiation grade | Well | 1 (2%) | 20 (51%) | <0.0001 |
| Moderate | 15 (37%) | 17 (44%) | ||
| Poor | 25 (61%) | 2 (5%) | ||
| Pathology | BAC+8 | 5 (11%) | 16 (38%) | <0.0001 |
| BAC– | 39 (89%) | 26 (62%) | ||
| Recurrence | Yes | 22 (50%) | 8 (19%) | <0.006 |
| No | 22 (50%) | 34 (81%) | ||
| Alive | Yes | 15 (34%) | 31 (74%) | <0.0006 |
| No | 29 (66%) | 11 (26%) | ||
| Median overall survival (days) | 1579 | 3956 | <0.0005 | |
| EGFR mutations | Yes | 8 (18%) | 7 (17%) | N.S. |
| No | 36 (82%) | 35 (83%) | ||
| KRAS mutations | Yes | 7 (20%) | 11 (26%) | N.S. |
| No | 37 (80%) | 31 (74%) | ||
| TP53 mutations | Yes | 24 (55%) | 6 (14%) | <0.0003 |
| No | 20 (45%) | 36 (86%) | ||
High expressors – lung adenocarcinoma subjects with all 6 BC-S hESC signature genes expressed above the median.
Low expressors – lung adenocarcinoma subjects with no BC-S hESC signature genes expressed above the median.
p values were determined by Chi-square test (for categorical variables), Kolmogorov-Smirnov test (for continuous values), or log-rank test (for survival analysis).
Plus-minus values are means ± standard deviation.
N.S. – nonsignificant.
FEV1 – forced expiratory volume in 1 sec.
DLCO – diffusing capacity of the lungs for carbon monoxide.
Presence of the bronchoalveolar carcinoma (BAC) morphologic component.
Table II. Multivariate Cox Regression Analysis of Lung Adenocarcinoma Patient Survival1.
| HR | 95% C.I. | p | |
|---|---|---|---|
| Age | 1.02 | 1.03-1.11 | >0.3 |
| Gender | 1.32 | 0.58-2.22 | >0.4 |
| Smoking status | 1.75 | 0.46-3.51 | >0.3 |
| Pathological stage | 2.00 | 2.01-7.22 | <0.001 |
| COPD | 1.17 | 0.25-6.09 | >0.7 |
| BC-S hESC-signature | 2.62 | 1.14-2.22 | <0.02 |
Abbreviations: HR, hazard ratio for overall survival; CI, confidence interval; COPD, chronic obstructive pulmonary disease; BC-S hESC-signature, a cluster of 6 co-expressed human embryonic stem cell signature genes up-regulated in airway basal cells of healthy smokers compared to those from healthy nonsmokers.
BC-S hESC-signature is Associated with the TP53-inactivation Molecular Phenotype
We then asked whether AdCa subjects overexpressing BC-S hESC genes exhibit distinct patterns of mutations. Although there was no significant difference in the frequency of mutations of EGFR or KRAS (Table I), or STK11, BRAF, and PTEN (not shown) between high- and lowexpressors, AdCa subjects with high BC-S hESC-signature expression exhibited significantly higher frequency of mutations of the tumor suppressor gene TP53 (p<0.0002; Table I).
Consistently, the presence of TP53 mutations in AdCa was associated with higher overall expression of BC-S hESC-signature genes (Figure 4A). In AdCa-smokers with TP53 mutations, expression of these genes was strongly positively correlated with the expression of a subset of genes known to be up-regulated after TP53 mRNA silencing [30] (“TP53-inactivation signature”; Figure 4B). Consistently, the NCI-H522 and NCI-HI299 lung carcinoma cell lines with TP53-inactivating mutations exhibited significantly higher expression of the BC-S hESC-signature genes than TP53-wild-type lung cancer cell lines A549 and NCI-H838 (Figure 4C).
Figure 4.
Association between basal cell-smoker (BC-S) hESC-signature and TP53-inactivation molecular phenotype. A. Box-plot showing BC-S hESC index distribution in primary lung adenocarcinoma (AdCa) divided based on smoking status (NS - nonsmokers; S - smokers) and TP53 status (WT - wild-type; * - mutation): AdCa-NS-TP53WT (n=29), AdCa-NS-TP53* (n=7), AdCa-S-TP53WT (n=95), AdCa-S-TP53* (n=36). See Supplementary Methods for details regarding index; p values indicated were determined by ANOVA post-hoc with Bonferroni/Dunn correction. B. Spearman correlation analysis of relationship between BC-S hESC index and TP53-inactivation (TP53i) index in AdCa-S-TP53* (n=36); See Supplementary Methods for details regarding index. Spearman rank correlation coefficient (Rho) and p value indicated. C. Expression of selected BC-S hESC-signature genes in indicated TP53WT and TP53* lung cancer cell lines (n=4 for each cell line) determined by TaqMan PCR. D. Principal component analysis of indicated groups based on expression of BC-S hESC-signature genes (upper panel) and TP53i gene signature (lower panel). E. Volcano plots comparing expression of TP53i-signature gene probe sets in large airway epithelium of healthy smokers (LAE-S; n=31) vs LAE-NS (n=21) - upper panel; and in BC-S (n=4) vs BC-NS (n=4). F. Normalized expression of BC-S hESC-signature genes (upper panel) and TP53-inactivation signature genes (lower panel) in BC-NS (n=4) and BC-S (n=4). G. Spearman correlation analysis of relationship between BC-S hESC index and TP53-inactivation index in BC-NS (blue dots; n=4) and BC-S (red dots; n=4); Spearman rank correlation coefficient (Rho) and p value are indicated.
We next analyzed whether the TP53-inactivation molecular phenotype is present in BC-S. PCA revealed that, based on the expression of both BC-S hESC-signature and the TP53-inactivation signature, BC-S, but not BC-NS, shared a similar distribution as AdCa subjects with TP53 mutations (Figure 4D), indicating that BC-S and AdCa with TP53 mutations share a similar TP53-inactivation molecular pattern. Next, we analyzed the effect of smoking on the TP53-inactivation signature expression in the healthy airway epithelium. No significant differences were detected between the complete LAE-NS and LAE-S (Figure 4E, upper panel), whereas there was a dramatic up-regulation of the TP53-inactivation signature genes in BC-S vs BC-NS (Figure 4E, lower panel) indicating that smoking selectively induces TP53-inactivation phenotype in the BC population. Finally, there was a very strong correlation between the hESC- and TP53-inactivation signatures induced by smoking in airway BC (Figures 4F-G).
Various Types of Human Lung Cancer Overexpress BC-S hESC-signature
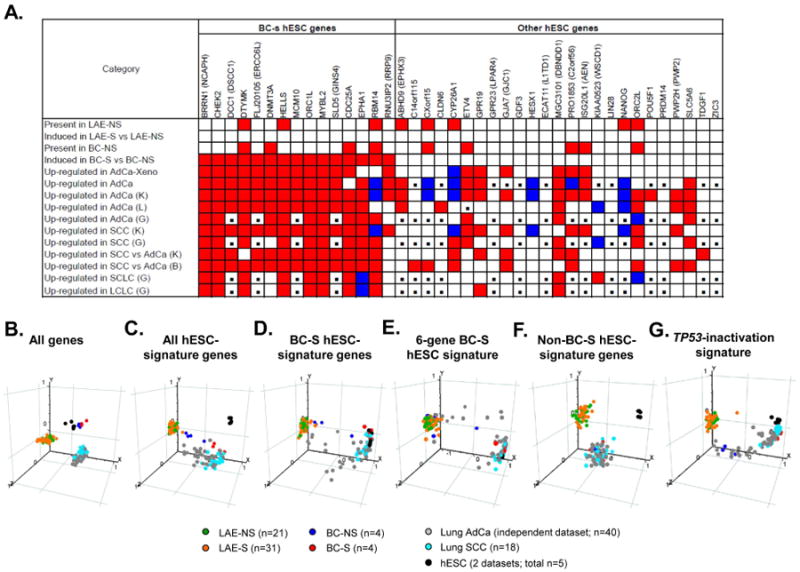
To evaluate BC-S hESC-signature expression in different subtypes of lung cancer, independent lung cancer datasets were analyzed [18, 19, 31]. Similar to the original AdCa cohort, all 3 independent AdCa datasets exhibited preferential up-regulation of the BC-S-induced hESC-signature genes, with remarkable overlap between individual datasets (Figure 5A). Notably, non-BC-S hESC-signature genes CYP26A1, HESX1 and NANOG, associated with airway epithelial differentiation, were down-regulated in AdCa datasets (Figure 5A). Preferential up-regulation of the BC-S hESC signature genes with a pattern similar to that induced in lung AdCa was also observed in 2 independent lung squamous cell carcinoma (SCC) datasets as well as in small- and large-cell lung carcinomas (Figure 5A). Overall BC-S hESC-signature gene expression in lung SCC was considerably higher than in lung AdCa (Figure 5A).
Figure 5.

Overexpression of basal cell-smoker (BC-S) hESC-signature genes in various types of human lung cancer. A. BC-S hESC-signature genes (left gene) and other hESC-signature genes (right cluster) were mapped based on indicated parameters. Original datasets included Large airway epithelium – nonsmoker (LAE-NS; n=21), LAE - smoker (LAE-S; n=31), BC-NS (n=4), BC-S (n=4), lung AdCa cells propagated in a xenograft model (AdCa-Xeno; n=4), and primary lung AdCa (AdCa; n =193) [17]. Independent lung cancer datasets were analyzed using Oncomine database, including lung AdCa datasets Landi et al (L; n=58) [18], Kuner et al (K; n=42) [19], Garber et al (G; n=40) [31], squamous cell lung carcinoma (SCC) datasets Kuner et al, (K; n=18) [19], Garber et al (G; n=13) [31], comparison of SCC to AdCa in datasets Kuner et al [19], Bild et al (B, SCC, n=53; AdCa, n=58) [20], small cell lung carcinoma (SCLC; n=4) and large cell lung carcinoma (LCLC; n=4) in dataset Garber et al (G) [31]. Genes that meet the criteria are highlighted with red; genes with opposite change - blue; genes not detectable by the given microarray platform - with black boxes. B-G. Principal component analysis of LAE-NS, LAE-S, BC-NS, BC-S, independent AdCa and SCC datasets Kuner et al [19], and hESC from datasets Avery et al (n=3) [21] and Denis et al (GSE8590; n=2) based on expression of indicated groups of genes described in Results.
Genome-wide PCA analysis revealed that airway BC from healthy individuals exhibit higher similarity to hESC with BC-S distributed closer to lung cancer samples (Figure 5B). Based on the entire hESC-signature expression, a subset of AdCa samples and the majority of SCC shared with BC-S, but not BC-NS, a similar distribution with a notable shift toward hESC (Figure 5C). Further restriction of the analysis to the 15-gene BC-S hESC-signature revealed similarity of the SCC samples and a subset of the AdCa samples to both BC-S and hESC (Figure 5D). This spatial pattern was effectively reproduced using the dataset containing 6 co-expressed, prognostically relevant BC-S hESC-signature genes (Figure 5E), but not the non-BC-S hESC- signature genes (Figure 5F). Finally, SCC and a subset of AdCa samples clustered together with BC-S and hESC based on expression of the TP53-inactivation signature (Figure 5G), suggesting that acquisition of the transcriptome features of TP53 inactivation is coupled to the reprogramming toward a common hESC-like phenotype shared by BC-S and lung cancer.
Discussion
Accumulating evidence indicates that a number of human epithelial cancers display activation of genes and associated regulatory networks previously ascribed to hESC [4-6]. These observations lead to the hypothesis of the present study that, under the influence of the chronic carcinogenic stress of cigarette smoking, airway BC, the adult stem/progenitor cell population of the airway epithelium, acquire hESC-like molecular traits similar to those induced in lung cancer as an early step toward malignant tissue derangement.
Cigarette smoking, the major risk factor for lung cancer, induces all steps of preneoplastic progression, inducing BC proliferation resulting in hyperplasia, skewing airway epithelial differentiation toward metaplasia, followed by dysplastic changes that precede the development of invasive carcinoma [9-11]. These morphologic changes are preceded and/or accompanied by genomic alterations, epigenetic modifications, and transcriptome reprogramming [9]. The present study demonstrates that smoking induces a unique hESC-like transcriptome program in the airway BC of healthy individuals, which considerably overlaps with the hESC-like program present in all major subtypes of human lung cancer, including AdCa, SCC, large- and small cell carcinomas, and is associated with a distinct, more aggressive phenotype of lung carcinomas. Several themes relevant to the molecular and cellular origins of human lung cancer emerge from these observations.
First, the data of the present study emphasizes the role of airway BC, the airway stem/progenitor cells, as the major target of smoking-induced reprogramming of the airway epithelium toward a lung cancer-relevant molecular phenotype. Smoking is known to induce contrasting effects on different cell populations of the airway epithelium. In the airways of smokers, there is loss and functional defects of ciliated cells accompanied by increased proliferation of BC [32]. But how do BC, located below the layer of differentiated and columnar cells, sense cigarette smoke? Previous studies showed that the airway epithelial junctional barrier, which separates the luminal and basolateral epithelial compartments, is compromised by cigarette smoking [25], making the BC compartment accessible to components of cigarette smoke. In addition, BC may directly sample luminal content by extending their processes across the epithelial layer [33]. In favor of such model, we found that direct exposure of BC from healthy nonsmokers to cigarette smoke extract in vitro resulted in the acquisition of the hESC-signature similar to that induced in BC-S in vivo. Finally, smoking-induced hESC-like BC phenotype was maintained in culture, suggesting that stable changes to the BC genome and/or epigenome induced by smoking in vivo allow them to maintain their phenotype after they have been removed from the in vivo microenvironment. The overall hESC-signature expression markedly decreased following BC differentiation into the ciliated epithelium in vitro, suggesting that regulatory mechanisms controlling the expression of these genes in vivo were also largely preserved in vitro, and the observed increased hESC-signature gene expression in BC-S vs BC-NS was due to their in vivo smoking-induced reprogramming. Furthermore, the same set of BC-S hESC genes was induced in BC-NS after exposure to the cigarette smoke extract in vitro, indicating it is smoking, not the culture itself, that is the factor responsible for the induction of the BC-S hESC-signature genes in BC-S. The smoking-dependent nature of the BC-S hESC-signature expression was further supported by the in vivo observation that a subset of AdCa patients who quit smoking display significantly lower expression of the BC-S hESC-signature genes than actively smoking AdCa patients. This suggests that both irreversible and reversible genomic and epigenomic changes may be responsible for smoking-induced acquisition of the BC-S hESC transcriptional program in both BC and lung carcinomas.
Second, results of the present study provide new insights into the cellular origin of human lung cancer. Airway BC have been regarded as putative cell-of-origin for SCC [10, 35], but not for other types of lung cancer. The remarkable similarity of the hESC-signature induced in BC-S to that overexpressed in 4 histologically distinct types of human lung cancer identified in the present study suggests that reprogramming toward a hESC-like molecular phenotype in these types of lung cancer likely represents a common early molecular process driven by smoking-induced changes in airway BC. Expansion of the smoking-reprogrammed hESC-like BC clones in susceptible individuals might provide potential explanation for progressive dedifferentiation associated with the development of smoking-associated lung carcinomas. Indeed, patches of clonally-related cells harboring a uniform set of molecular alterations identical to those present in lung cancer have been found in the histologically normal airway epithelium of smokers without cancer [36, 37] and the cells expressing BC markers CK5 and CK14 are predominant in SCC-related potentially preneoplastic lesions in smokers' airways [35]. Another intriguing finding in the present study is that, although the BC were from the LAE, the smoking-induced hESC-signature in these cells contributed to the molecular phenotype of both predominantly proximally-derived lung carcinomas such as SCC, SCLC and large cell lung carcinomas, as well as AdCa, which is thought to originate in peripheral airways [34]. It is known that smoking creates a field of cancer-related molecular changes throughout the airway epithelium [38]. In support of this model, multiple clonal outgrowths of molecularly altered cells have been found widely distributed in the airway epithelium of a smoker [37] and smoking-induced changes in the LAE transcriptome have been used to predict lung cancers located at a distance from the sampled LAE [39].
Clinical relevance of the BC-S hESC signature identified in the present study was further demonstrated by the observation that overexpression of this signature in AdCa is associated with a distinct, more aggressive clinical/pathologic phenotype. These individuals are predominantly smokers, have a higher co-morbidity with COPD and decreased lung function parameters FEV1 and DLCO, more advanced pathological stage, larger tumors, markedly poorer differentiation grade, higher recurrence frequency and, most strikingly, a 79-month shorter median overall survival than lung AdCa patients not expressing this signature. Importantly, high expression of the BC-S hESC-signature predicted poorer survival in lung AdCa independent from other covariates such as age, gender, pathologic tumor stage and COPD. By contrast, high expression of the non-BC-S hESC-signature genes was not associated with shorter survival of AdCa patients. In a recent study, overexpression of a distinct set of the hESC-related genes was associated with poor survival of lung AdCa, but not SCC [5]. It is likely that, compared to lung AdCa, which is characterized by variable expression of the BC-S hESC-signature genes allowing categorization of patients into “high” and relatively “low” expressors with markedly different survival, SCC with its uniformly high expression of the BC-S hESC-signature doesn't exhibit such clinically detectable heterogeneity. Thus, smoking-induced hESC-signature in BC population of healthy airway epithelium carries valuable information related to both early pathogenesis and clinical phenotypes of lung carcinomas, including those not previously thought to originate from BC.
Third, the present study sheds light on the early molecular mechanisms associated with acquisition of lung cancer-relevant features in the stem/progenitor cells of otherwise normal airway epithelium chronically exposed to the oncogenic stress of cigarette smoking. The observation of the present study of a significantly higher incidence of TP53 mutations in AdCa patients highly expressing the BC-S hESC-signature, suggests 2 possible mechanistic models whereby smoking might reprogram airway BC toward cells with lung cancer-relevant molecular phenotype. First, TP53-inactivation might be required for acquisition of the hESC-like transcriptome features. TP53 is a tumor suppressor gene encoding phosphoprotein p53, which suppresses tumor formation by promoting apoptosis, activating cell cycle checkpoints and inducing senescence [40]. In addition to these classic functions, recent studies have documented a critical role for TP53 in maintaining ESC genomic stability, inducing their differentiation [41] and suppressing pluripotency [42, 43]. TP53 mutations, a known biomarker of cigarette smoke exposure in lung cancer [44], represent the most common mutation in lung carcinomas, including SCC, AdCa and SCLC, with a frequency varying between 40% and 75% depending on smoking status [34]. The present study provides several lines of evidence in favor of the model, in which activation of the BC-S hESC signature is associated with the TP53 gene inactivation. First, we found that different lung carcinoma cell lines harboring TP53 gene mutations overexpress hESC-signature genes with a pattern similar to that induced in BC-S. Second, AdCa patients with TP53-mutations exhibited significantly higher expression of BC-S hESC-signature genes. Third, transcriptome analysis revealed a selective induction of genes associated with the TP53 inactivation in BC, but not in the complete airway epithelial population of healthy smokers. The molecular pattern of TP53 inactivation in BC-S was similar to that present in hESC, AdCa with TP53-mutations and the majority of SCC samples. Finally, overall expression levels of the hESC and TP53-inactivation signatures in airway BC strongly correlated.
Thus, it is possible that BC carrying inactivated TP53 acquire the hESC-like phenotype, gain a selective growth advantage and eventually play a role in tumor initiation and propagation, thereby contributing to the development of poorly differentiated aggressive lung carcinomas. In support of this scenario, a widespread distribution of epithelial cells bearing a single point mutation in TP53 codon 245, a codon which is frequently mutated in lung cancer, has been detected in the airways of a smoker with dysplastic changes [45], suggesting that a single clone of smoking-reprogrammed TP53-mutant progenitor cells might populate relatively large and distant areas of the airway epithelium prior to the formation of overt cancer. Furthermore, loss of heterozygocity at the TP53 locus and overexpression of the mutant p53 protein have previously been found in the dysplastic bronchial epithelium of smokers without lung cancer [37]. Although the mechanism causing TP53 inactivation in the BC-S is beyond the scope of this study, epigenetic modifications that may occur in response to environmental factors, such as cigarette smoke, can repress gene function without changes in the DNA sequence [9]. Alternatively, DNA replication stress induced by cigarette smoking in proliferating BC might select for TP53-inactivation as a response to ongoing DNA damage [46]. Consistent with this concept, CHEK2, the central component of the DNA damage response [47], was among the hESC-signature genes induced in BC-S. When the function of p53 is lost, BC can escape its “genome guardian” functions, acquire the cancer-relevant hESC-like phenotype and the precancerous lesion can become malignant. Indeed, DNA replication stress leading to genomic instability and selective pressure for p53 mutations has been described as an early mechanism of lung cancer development [48].
In summary, expression of a surprisingly similar pattern of prognostically-relevant hESC-signature genes in BC-S and human lung carcinomas, observed in the present study, provides transcriptome-based evidence for a novel model of lung cancer development in which selective smoking-induced reprogramming of airway BC towards the hESC-like phenotype represents a common molecular event in the pathogenesis of all 4 major types of lung cancer, contributing to the molecular phenotype of aggressive lung carcinomas.
Supplementary Material
Supplementary Figure 1. hESC-signature gene expression in the large airway epithelium (LAE) and basal cells (BC) of healthy nonsmokers (NS). A. Detection frequency. Ordinate represents % subjects in each group expressing a given gene (Affymetrix present detection call). Abcissa - 40 hESC-signature genes identified by Assou et al (8) listed in alphabetic order. Shown is data for LAE-NS (green bars; n=21) and BC-NS (blue bars; n=4). B. Normalized expression. Ordinate represents average gene expression values normalized per array for LAE-NS (green diamonds; n=21) and BC-NS (blue diamonds; n=4). Abscissa represents hESC-signature genes. For A, B see Supplementary Table I for gene descriptions and detailed expression data.
Supplementary Figure 2. Comparison of mean normalized expression levels for 10 known housekeeping genes in basal cells of healthy nonsmokers (BC-NS; n=4) and BC of healthy smokers (BC-S; n=4). In all comparisons, the difference between the groups is not significant (p>0.05; no Benjamini-Hochberg correction applied to increase the sensitivity of the test). The full gene names: actin, beta (ACTB), Rho GDP dissociation inhibitor (GDI) alpha (ARHGDIA), ATPase, H+ transporting, lysosomal 13kDa, V1 subunit G isoform 1 (ATP6V1G1), endosulfine alpha (ENSA), glyceraldehyde-3-phosphate dehydrogenase (GAPDH), lactate dehydrogenase A (LDHA), ribosomal protein S18 (RPS18), ribosomal protein L19 (RPL19), ribosomal protein S27a (RPS27A), ribosomal protein L32 (RPL32).
Supplementary Figure 3. Principal component analysis of (left panels) large airway epithelium of healthy nonsmokers (LAE-NS; green dots; n=21), LAE of healthy smokers (LAE-S; orange dots; n=31) and (right panels) basal cells of healthy nonsmokers (BC-NS; blue dots; n=4), BC of healthy smokers (BC-S; red dots; n=4) based on expression of A. all gene probe sets and B. hESC-signature gene probe sets. The percentage contributions of the first 3 principal components (PC1-3) to the observed variabilities are indicated.
Supplementary Figure 4. Analysis of hESC-signature gene expression in airway basal cells (BC) by massively parallel RNA-Sequencing (RNA-Seq). A. Venn diagram showing overlap of hESC-signature genes detected in BC by Affymetrix HG-U133 Plus 2 microarray (yellow circle; n=21) and by RNA-Seq (orange circle; n=31). Areas highlighted by the blue and green circles represent hESC-signature genes up-regulated in BC of healthy smokers (BC-S; n=4 microarray analysis; n=2 RNA-Seq) vs BC of healthy nonsmokers (BC-NS; n=4 microarray analysis; n=2 RNA-Seq) as determined by microarray (n=12) and RNA-Seq (n=14), respectively. Merged area represents 11 hESC-signature genes up-regulated in BC-S vs BC-NS as determined by both microarray and RNA-Seq. B. Visualization of RNA-Seq reads for 6 hESC-signature gene examples for BC-NS (n=2) and BC-S (n=2) using Partek Genomics Suite (Bowtie alignment algorithm v 0.12). Horizontal tracks represent gene structure with known exons (Ex) mapped according to their physical position. The y-axis corresponds to number of reads mapping to each exon for each gene in each individual sample; reads for BC-NS (blue); for BC-S (red). Cumulative expression level of each gene in each sample (determined as reads per kilobase of exon model per million mapped reads, RPKM) is shown below the label for the corresponding sample on the left of each plot. For the CHEK2 gene, exons 9, 10 and exon 14, containing no or barely detected reads without difference between the study groups, are not shown.
Supplementary Figure 5. Normalized expression of the indicated airway BC signature genes (KRT5, keratin 5; KRT6B, keratin 6B; ITGA6, integrin, alpha 6) and smoking-responsive genes (cytochromes CYP1A1 and CYP1B2; and NQO1, NAD(P)H dehydrogenase, quinone 1) in BC-NS (blue) and BC-S (red) based on the TaqMan PCR analysis; N.D. – not detectable; N.S. – difference not significant (p>0.05) between the groups; * - p<0.05.
Supplementary Figure 6. Kaplan-Meier analysis-based estimates of overall survival of lung adenocarcinoma (AdCa) patients highly expressing a non-BC-S hESC-signature (high expressors, i.e., those highly expressing ≥10 out of 25 non-BC-S hESC-signature genes; red curve; n=19) vs low expressors (blue curve; i.e., those highly expressing ≤4 out of 25 non-BC-S hESC-signature genes; n=30); p values indicated were determined by the log-rank test.
Acknowledgments
We thank B-G. Harvey, R.J. Kaner, A.E. Tilley, M.W. Butler and M. O'Mahony for help in obtaining the large airway epithelium samples; M. Ladanyi for making the Memorial Sloan-Kettering Cancer Center adenocarcinoma dataset available to us; P. Karp and M. Welsh, University of Iowa, for the protocol on culturing primary airway epithelial cells; J. Fuller for coordinating the cancer sample database, B. Ferris and B. Witover for their help in basal cell characterization, M. Al-Hijji, P. Bonsu, T. Fukui for help with in vitro experiments, D. Dang and M. Teater for sample processing for microarray analysis; and N. Mohamed and D.N. McCarthy for help in preparing this manuscript. These studies were supported, in part, by P50 HL084936; Starr Foundation/Starr Cancer Consortium; and UL1-RR024996. R. Shaykhiev was supported, in part, by the Parker B. Francis Foundation.
Footnotes
Author Contributions: Renat Shaykhiev: Conception and design, collection/assembly of data, data analysis and interpretation, manuscript writing
Rui Wang: Collection/assembly of data
Rachel K. Zwick: Collection/assembly of data
Neil R. Hackett: Data analysis and interpretation
Roland Leung: Collection/assembly of data, data analysis and interpretation
Malcolm A.S. Moore: Provision of study material or patients, Data analysis and interpretation
Camelia S. Sima: Data analysis and interpretation
IonWa Chao: Collection/assembly of data
Robert J. Downey: Provision of study material or patients, Data analysis and interpretation
Yael Strulovici-Barel: Collection/assembly of data, Data analysis and interpretation
Jacqueline Salit: Collection/assembly of data, Data analysis and interpretation
Ronald G. Crystal: Conception and design, Data analysis and interpretation, Manuscript writing, Final approval of manuscript
Competing interests: The authors declare that they have no competing interests.
References
- 1.Boyer LA, Lee TI, Cole MF, et al. Core transcriptional regulatory circuitry in human embryonic stem cells. Cell. 2005;122:947–956. doi: 10.1016/j.cell.2005.08.020. [DOI] [PMC free article] [PubMed] [Google Scholar]
- 2.Kim J, Chu J, Shen X, et al. An extended transcriptional network for pluripotency of embryonic stem cells. Cell. 2008;132:1049–1061. doi: 10.1016/j.cell.2008.02.039. [DOI] [PMC free article] [PubMed] [Google Scholar]
- 3.Assou S, Le CT, Tondeur S, et al. A meta-analysis of human embryonic stem cells transcriptome integrated into a web-based expression atlas. Stem Cells. 2007;25:961–973. doi: 10.1634/stemcells.2006-0352. [DOI] [PMC free article] [PubMed] [Google Scholar]
- 4.Ben-Porath I, Thomson MW, Carey VJ, et al. An embryonic stem cell-like gene expression signature in poorly differentiated aggressive human tumors. Nat Genet. 2008;40:499–507. doi: 10.1038/ng.127. [DOI] [PMC free article] [PubMed] [Google Scholar]
- 5.Hassan KA, Chen G, Kalemkerian GP, et al. An embryonic stem cell-like signature identifies poorly differentiated lung adenocarcinoma but not squamous cell carcinoma. Clin Cancer Res. 2009;15:6386–6390. doi: 10.1158/1078-0432.CCR-09-1105. [DOI] [PMC free article] [PubMed] [Google Scholar]
- 6.Wong DJ, Liu H, Ridky TW, et al. Module map of stem cell genes guides creation of epithelial cancer stem cells. Cell Stem Cell. 2008;2:333–344. doi: 10.1016/j.stem.2008.02.009. [DOI] [PMC free article] [PubMed] [Google Scholar]
- 7.Harvey BG, Heguy A, Leopold PL, et al. Modification of gene expression of the small airway epithelium in response to cigarette smoking. J Mol Med. 2007;85:39–53. doi: 10.1007/s00109-006-0103-z. [DOI] [PubMed] [Google Scholar]
- 8.Spira A, Beane J, Shah V, et al. Effects of cigarette smoke on the human airway epithelial cell transcriptome. Proc Natl Acad Sci U S A. 2004;101:10143–10148. doi: 10.1073/pnas.0401422101. [DOI] [PMC free article] [PubMed] [Google Scholar]
- 9.Sato M, Shames DS, Gazdar AF, et al. A translational view of the molecular pathogenesis of lung cancer. J Thorac Oncol. 2007;2:327–343. doi: 10.1097/01.JTO.0000263718.69320.4c. [DOI] [PubMed] [Google Scholar]
- 10.Wistuba II, Gazdar AF. Lung cancer preneoplasia. Annu Rev Pathol. 2006;1:331–348. doi: 10.1146/annurev.pathol.1.110304.100103. [DOI] [PubMed] [Google Scholar]
- 11.Auerbach O, Forman JB, Gere JB, et al. Changes in the bronchial epithelium in relation to smoking and cancer of the lung; a report of progress. N Engl J Med. 1957;256:97–104. doi: 10.1056/NEJM195701172560301. [DOI] [PubMed] [Google Scholar]
- 12.Crystal RG, Randell SH, Engelhardt JF, et al. Airway epithelial cells: current concepts and challenges. Proc Am Thorac Soc. 2008;5:772–777. doi: 10.1513/pats.200805-041HR. [DOI] [PMC free article] [PubMed] [Google Scholar]
- 13.Hajj R, Baranek T, Le NR, et al. Basal cells of the human adult airway surface epithelium retain transit-amplifying cell properties. Stem Cells. 2007;25:139–148. doi: 10.1634/stemcells.2006-0288. [DOI] [PubMed] [Google Scholar]
- 14.Hong KU, Reynolds SD, Watkins S, et al. Basal cells are a multipotent progenitor capable of renewing the bronchial epithelium. Am J Pathol. 2004;164:577–588. doi: 10.1016/S0002-9440(10)63147-1. [DOI] [PMC free article] [PubMed] [Google Scholar]
- 15.Inayama Y, Hook GE, Brody AR, et al. In vitro and in vivo growth and differentiation of clones of tracheal basal cells. Am J Pathol. 1989;134:539–549. [PMC free article] [PubMed] [Google Scholar]
- 16.Rock JR, Onaitis MW, Rawlins EL, et al. Basal cells as stem cells of the mouse trachea and human airway epithelium. Proc Natl Acad Sci U S A. 2009;106:12771–12775. doi: 10.1073/pnas.0906850106. [DOI] [PMC free article] [PubMed] [Google Scholar]
- 17.Chitale D, Gong Y, Taylor BS, et al. An integrated genomic analysis of lung cancer reveals loss of DUSP4 in EGFR-mutant tumors. Oncogene. 2009;28:2773–2783. doi: 10.1038/onc.2009.135. [DOI] [PMC free article] [PubMed] [Google Scholar]
- 18.Landi MT, Dracheva T, Rotunno M, et al. Gene expression signature of cigarette smoking and its role in lung adenocarcinoma development and survival. PLoS One. 2008;3:e1651. doi: 10.1371/journal.pone.0001651. [DOI] [PMC free article] [PubMed] [Google Scholar]
- 19.Kuner R, Muley T, Meister M, et al. Global gene expression analysis reveals specific patterns of cell junctions in non-small cell lung cancer subtypes. Lung Cancer. 2009;63:32–38. doi: 10.1016/j.lungcan.2008.03.033. [DOI] [PubMed] [Google Scholar]
- 20.Bild AH, Yao G, Chang JT, et al. Oncogenic pathway signatures in human cancers as a guide to targeted therapies. Nature. 2006;439:353–357. doi: 10.1038/nature04296. [DOI] [PubMed] [Google Scholar]
- 21.Avery K, Avery S, Shepherd J, et al. Sphingosine-1-phosphate mediates transcriptional regulation of key targets associated with survival, proliferation, and pluripotency in human embryonic stem cells. Stem Cells Dev. 2008;17:1195–1205. doi: 10.1089/scd.2008.0063. [DOI] [PubMed] [Google Scholar]
- 22.Hackett NR, Heguy A, Harvey BG, et al. Variability of antioxidant-related gene expression in the airway epithelium of cigarette smokers. Am J Respir Cell Mol Biol. 2003;29:331–343. doi: 10.1165/rcmb.2002-0321OC. [DOI] [PubMed] [Google Scholar]
- 23.Hackett NR, Shaykhiev R, Walters MS, et al. The human airway epithelial basal cell transcriptome. PLoS One. 2011;6:e18378. doi: 10.1371/journal.pone.0018378. [DOI] [PMC free article] [PubMed] [Google Scholar]
- 24.Rhodes DR, Yu J, Shanker K, et al. ONCOMINE: a cancer microarray database and integrated data-mining platform. Neoplasia. 2004;6:1–6. doi: 10.1016/s1476-5586(04)80047-2. [DOI] [PMC free article] [PubMed] [Google Scholar]
- 25.Shaykhiev R, Otaki F, Bonsu P, et al. Cigarette Smoking Reprograms Apical Junctional Complex Molecular Architecture in the Human Airway Epithelium In Vivo. 2010 doi: 10.1007/s00018-010-0500-x. [DOI] [PMC free article] [PubMed] [Google Scholar]
- 26.Hicks W, Jr, Hall L, III, Sigurdson L, et al. Isolation and characterization of basal cells from human upper respiratory epithelium. Exp Cell Res. 1997;237:357–363. doi: 10.1006/excr.1997.3796. [DOI] [PubMed] [Google Scholar]
- 27.Evans MJ, Van Winkle LS, Fanucchi MV, et al. Cellular and molecular characteristics of basal cells in airway epithelium. Exp Lung Res. 2001;27:401–415. doi: 10.1080/019021401300317125. [DOI] [PubMed] [Google Scholar]
- 28.Araya J, Cambier S, Markovics JA, et al. Squamous metaplasia amplifies pathologic epithelial-mesenchymal interactions in COPD patients. J Clin Invest. 2007;117:3551–3562. doi: 10.1172/JCI32526. [DOI] [PMC free article] [PubMed] [Google Scholar]
- 29.Howell JC, Lee WH, Morrison P, et al. Pluripotent stem cells identified in multiple murine tissues. Ann N Y Acad Sci. 2003;996:158–173. doi: 10.1111/j.1749-6632.2003.tb03244.x. [DOI] [PubMed] [Google Scholar]
- 30.Troester MA, Herschkowitz JI, Oh DS, et al. Gene expression patterns associated with p53 status in breast cancer. BMC Cancer. 2006;6:276. doi: 10.1186/1471-2407-6-276. [DOI] [PMC free article] [PubMed] [Google Scholar]
- 31.Garber ME, Troyanskaya OG, Schluens K, et al. Diversity of gene expression in adenocarcinoma of the lung. Proc Natl Acad Sci U S A. 2001;98:13784–13789. doi: 10.1073/pnas.241500798. [DOI] [PMC free article] [PubMed] [Google Scholar]
- 32.Jeffery PK, Ayers M, Rogers D. The mechanisms and control of bronchial mucous cell hyperplasia. Adv Exp Med Biol. 1982;144:399–409. doi: 10.1007/978-1-4615-9254-9_62. [DOI] [PubMed] [Google Scholar]
- 33.Shum WW, Da SN, McKee M, et al. Transepithelial projections from basal cells are luminal sensors in pseudostratified epithelia. Cell. 2008;135:1108–1117. doi: 10.1016/j.cell.2008.10.020. [DOI] [PMC free article] [PubMed] [Google Scholar]
- 34.Herbst RS, Heymach JV, Lippman SM. Lung cancer. N Engl J Med. 2008;359:1367–1380. doi: 10.1056/NEJMra0802714. [DOI] [PMC free article] [PubMed] [Google Scholar]
- 35.Ooi AT, Mah V, Nickerson DW, et al. Presence of a putative tumor-initiating progenitor cell population predicts poor prognosis in smokers with non-small cell lung cancer. Cancer Res. 2010;70:6639–6648. doi: 10.1158/0008-5472.CAN-10-0455. [DOI] [PMC free article] [PubMed] [Google Scholar]
- 36.Park IW, Wistuba II, Maitra A, et al. Multiple clonal abnormalities in the bronchial epithelium of patients with lung cancer. J Natl Cancer Inst. 1999;91:1863–1868. doi: 10.1093/jnci/91.21.1863. [DOI] [PubMed] [Google Scholar]
- 37.Wistuba II, Lam S, Behrens C, et al. Molecular damage in the bronchial epithelium of current and former smokers. J Natl Cancer Inst. 1997;89:1366–1373. doi: 10.1093/jnci/89.18.1366. [DOI] [PMC free article] [PubMed] [Google Scholar]
- 38.Steiling K, Ryan J, Brody JS, et al. The field of tissue injury in the lung and airway. Cancer Prev Res (Phila Pa) 2008;1:396–403. doi: 10.1158/1940-6207.CAPR-08-0174. [DOI] [PMC free article] [PubMed] [Google Scholar]
- 39.Spira A, Beane JE, Shah V, et al. Airway epithelial gene expression in the diagnostic evaluation of smokers with suspect lung cancer. Nat Med. 2007;13:361–366. doi: 10.1038/nm1556. [DOI] [PubMed] [Google Scholar]
- 40.Yee KS, Vousden KH. Complicating the complexity of p53. Carcinogenesis. 2005;26:1317–1322. doi: 10.1093/carcin/bgi122. [DOI] [PubMed] [Google Scholar]
- 41.Lin T, Chao C, Saito S, et al. p53 induces differentiation of mouse embryonic stem cells by suppressing Nanog expression. Nat Cell Biol. 2005;7:165–171. doi: 10.1038/ncb1211. [DOI] [PubMed] [Google Scholar]
- 42.Hong H, Takahashi K, Ichisaka T, et al. Suppression of induced pluripotent stem cell generation by the p53-p21 pathway. Nature. 2009;460:1132–1135. doi: 10.1038/nature08235. [DOI] [PMC free article] [PubMed] [Google Scholar]
- 43.Kawamura T, Suzuki J, Wang YV, et al. Linking the p53 tumour suppressor pathway to somatic cell reprogramming. Nature. 2009;460:1140–1144. doi: 10.1038/nature08311. [DOI] [PMC free article] [PubMed] [Google Scholar]
- 44.Toyooka S, Tsuda T, Gazdar AF. The TP53 gene, tobacco exposure, and lung cancer. Hum Mutat. 2003;21:229–239. doi: 10.1002/humu.10177. [DOI] [PubMed] [Google Scholar]
- 45.Franklin WA, Gazdar AF, Haney J, et al. Widely dispersed p53 mutation in respiratory epithelium. A novel mechanism for field carcinogenesis. J Clin Invest. 1997;100:2133–2137. doi: 10.1172/JCI119748. [DOI] [PMC free article] [PubMed] [Google Scholar]
- 46.Negrini S, Gorgoulis VG, Halazonetis TD. Genomic instability--an evolving hallmark of cancer. Nat Rev Mol Cell Biol. 2010;11:220–228. doi: 10.1038/nrm2858. [DOI] [PubMed] [Google Scholar]
- 47.Reinhardt HC, Yaffe MB. Kinases that control the cell cycle in response to DNA damage: Chk1, Chk2, and MK2. Curr Opin Cell Biol. 2009;21:245–255. doi: 10.1016/j.ceb.2009.01.018. [DOI] [PMC free article] [PubMed] [Google Scholar]
- 48.Gorgoulis VG, Vassiliou LV, Karakaidos P, et al. Activation of the DNA damage checkpoint and genomic instability in human precancerous lesions. Nature. 2005;434:907–913. doi: 10.1038/nature03485. [DOI] [PubMed] [Google Scholar]
Associated Data
This section collects any data citations, data availability statements, or supplementary materials included in this article.
Supplementary Materials
Supplementary Figure 1. hESC-signature gene expression in the large airway epithelium (LAE) and basal cells (BC) of healthy nonsmokers (NS). A. Detection frequency. Ordinate represents % subjects in each group expressing a given gene (Affymetrix present detection call). Abcissa - 40 hESC-signature genes identified by Assou et al (8) listed in alphabetic order. Shown is data for LAE-NS (green bars; n=21) and BC-NS (blue bars; n=4). B. Normalized expression. Ordinate represents average gene expression values normalized per array for LAE-NS (green diamonds; n=21) and BC-NS (blue diamonds; n=4). Abscissa represents hESC-signature genes. For A, B see Supplementary Table I for gene descriptions and detailed expression data.
Supplementary Figure 2. Comparison of mean normalized expression levels for 10 known housekeeping genes in basal cells of healthy nonsmokers (BC-NS; n=4) and BC of healthy smokers (BC-S; n=4). In all comparisons, the difference between the groups is not significant (p>0.05; no Benjamini-Hochberg correction applied to increase the sensitivity of the test). The full gene names: actin, beta (ACTB), Rho GDP dissociation inhibitor (GDI) alpha (ARHGDIA), ATPase, H+ transporting, lysosomal 13kDa, V1 subunit G isoform 1 (ATP6V1G1), endosulfine alpha (ENSA), glyceraldehyde-3-phosphate dehydrogenase (GAPDH), lactate dehydrogenase A (LDHA), ribosomal protein S18 (RPS18), ribosomal protein L19 (RPL19), ribosomal protein S27a (RPS27A), ribosomal protein L32 (RPL32).
Supplementary Figure 3. Principal component analysis of (left panels) large airway epithelium of healthy nonsmokers (LAE-NS; green dots; n=21), LAE of healthy smokers (LAE-S; orange dots; n=31) and (right panels) basal cells of healthy nonsmokers (BC-NS; blue dots; n=4), BC of healthy smokers (BC-S; red dots; n=4) based on expression of A. all gene probe sets and B. hESC-signature gene probe sets. The percentage contributions of the first 3 principal components (PC1-3) to the observed variabilities are indicated.
Supplementary Figure 4. Analysis of hESC-signature gene expression in airway basal cells (BC) by massively parallel RNA-Sequencing (RNA-Seq). A. Venn diagram showing overlap of hESC-signature genes detected in BC by Affymetrix HG-U133 Plus 2 microarray (yellow circle; n=21) and by RNA-Seq (orange circle; n=31). Areas highlighted by the blue and green circles represent hESC-signature genes up-regulated in BC of healthy smokers (BC-S; n=4 microarray analysis; n=2 RNA-Seq) vs BC of healthy nonsmokers (BC-NS; n=4 microarray analysis; n=2 RNA-Seq) as determined by microarray (n=12) and RNA-Seq (n=14), respectively. Merged area represents 11 hESC-signature genes up-regulated in BC-S vs BC-NS as determined by both microarray and RNA-Seq. B. Visualization of RNA-Seq reads for 6 hESC-signature gene examples for BC-NS (n=2) and BC-S (n=2) using Partek Genomics Suite (Bowtie alignment algorithm v 0.12). Horizontal tracks represent gene structure with known exons (Ex) mapped according to their physical position. The y-axis corresponds to number of reads mapping to each exon for each gene in each individual sample; reads for BC-NS (blue); for BC-S (red). Cumulative expression level of each gene in each sample (determined as reads per kilobase of exon model per million mapped reads, RPKM) is shown below the label for the corresponding sample on the left of each plot. For the CHEK2 gene, exons 9, 10 and exon 14, containing no or barely detected reads without difference between the study groups, are not shown.
Supplementary Figure 5. Normalized expression of the indicated airway BC signature genes (KRT5, keratin 5; KRT6B, keratin 6B; ITGA6, integrin, alpha 6) and smoking-responsive genes (cytochromes CYP1A1 and CYP1B2; and NQO1, NAD(P)H dehydrogenase, quinone 1) in BC-NS (blue) and BC-S (red) based on the TaqMan PCR analysis; N.D. – not detectable; N.S. – difference not significant (p>0.05) between the groups; * - p<0.05.
Supplementary Figure 6. Kaplan-Meier analysis-based estimates of overall survival of lung adenocarcinoma (AdCa) patients highly expressing a non-BC-S hESC-signature (high expressors, i.e., those highly expressing ≥10 out of 25 non-BC-S hESC-signature genes; red curve; n=19) vs low expressors (blue curve; i.e., those highly expressing ≤4 out of 25 non-BC-S hESC-signature genes; n=30); p values indicated were determined by the log-rank test.