Abstract
Multidrug resistance-associated protein 1 (MRP-1) is a ubiquitously expressed member of the ATP-binding cassette transporter family. MRP-1 is one of the primary transporters of glutathione and glutathione conjugates. This protein also transports antiretroviral therapeutics, such as HIV-1 protease inhibitors (PI). We hypothesized that inflammatory mediators that activate macrophages would modify the expression and activity of MRP-1 in macrophages. Real time PCR assays western blots and calcein efflux assays were used to show that exposure of macrophage cell line RAW 264.7 to LPS increased expression of MRP-1 at the level of mRNA and protein, as well as at the level of functional activity. Treatment of macrophages with LPS resulted in 2-fold increases of MRP-1 expression or functional activity. LPS-mediated increases in calcein efflux were repressed by the MRP-specific inhibitor MK-571. These results suggest that the effectiveness of HIV-1 PI therapy may be compromised by the presence of opportunistic infections.
ATP-binding cassette (ABC) transporters are a large and diverse family of proteins in which translocation of both endogenous and xenobiotic compounds is coupled to the hydrolysis of ATP. These transporters function in drug absorption, distribution and excretion. MRP-1, which is the best characterized transporter in the ABCC family, transports organic anions. MRP-1 is expressed fairly ubiquitously, including tissues such as peripheral blood mononuclear cells, kidney, brain microvascular endothelial cells and testis (Leslie et al., 2005). It has been demonstrated that MRP-1 transports glutathione (GSH), glutathione conjugates and glutathione disulfide (GSSG) (Leier et al., 1996). Glutathione is not only a substrate of MRP-1, but it is also capable of modulating transport of other compounds by MRP-1 (Leslie et al., 2005). The interactions between GSH and MRP-1 are functionally complex, and at present, not completely understood.
Due to its role in transport of GSH/GSSG, MRP-1 activity is a major determinant of intracellular redox status. Several independent investigations have demonstrated that MRP-1 expression is elevated in response to inducers that include oxidative stress. Both β-glutamylcysteine synthetase, the rate limiting enzyme in GSH synthesis, and MRP-1show increased expression levels in response to prooxidants such as tertbutylhydroquinone (t-BHQ) (Yamane et al., 1998). It is of particular note that exposure to the prooxidants increased the generation of reactive oxygen intermediates (ROI). Primary cultures of rat astrocytes have also been shown to express increased levels of MRP-1 in response to exposure to the HIV-1 viral envelope protein gp120. Exposure of these cells to gp120 induced ROI, as well as increased expression of MRP-1at the levels of mRNA, protein and functional expression (Ronaldson and Bendayan, 2008). HIV-1 Tat protein has also been demonstrated to induce MRP-1 expression in mouse brain microvascular endothelial cells (Hayashi et al., 2006). Previous studies have demonstrated the presence of functional MRP-1 in macrophages and microglial cells (Cao et al., 1992; Dallas et al., 2004). Due to the pivotal role of macrophages in various infectious diseases, our laboratory has sought to determine the effects of lipopolysaccharide (LPS) on MRP-1 expression in terms of mRNA and protein levels, as well as in terms of functional activity. Our working hypothesis is that LPS will significantly alter the expression and function of MRP-1 in a mouse macrophage cell line. Our results demonstrate that exposure to LPS increases MRP-1 expression in macrophages at the levels of mRNA, protein and functional expression.
METHODS
Cell Line and Reagents
RAW 264.7 cells were obtained from the American Type Culture Collection (ATCC, Rockville, MD). LPS was a deep rough mutant LPS (ReLPS) from E. coli D31 m4 (Qureshi et al., 1988). Calcein-AM was purchased from Invitrogen (Carlsbad, CA). MK-571 was purchased from BIOMOL (Plymouth Meeting, PA). All media and serum used was obtained from Lonza (Walkersville, MD).
Cell Culture
RAW 264.7 macrophage-like cells were maintained in DMEM supplemented with 10% FBS and gentamycin at a concentration of 20 mg/mL. Cells were maintained in 5% CO2 at 37°C in a humidified chamber. All experiments were performed with cells that had been passaged less than 20 times. For the isolation of RNA and protein, cells were plated at a concentration of 3 × 10⁶ cells/60 mm plate. 3 h after plating, fresh media was added containing LPS at a final concentration of 100 ng/mL. For mock-treated cells, an equivalent volume of 0.91% saline was added in place of the LPS.
RNA Isolation and Real-time PCR
RNA was isolated using an RNeasyPlus Mini kit from Qiagen (Valencia, CA). cDNA was generated from total RNA (1.5 μg) using MuLV reverse transcriptase and random primers (High Capacity cDNA Reverse Transcription kit; Applied Biosystems, Foster City, CA). Amplification reactions were performed using TaqMan Fast Universal PCR Master Mix and TaqMan gene expression assays for either mouse MRP-1 (Mm00456156_m1) or GAPDH (Mm99999915_g1). Each amplification reaction contained cDNA generated from 10 ng of RNA and was performed using an Applied Biosystems Step One thermal cycler. Relative quantification of gene expression was performed with GAPDH as the endogenous control using the 2-ΔΔCt method.
Western blots
For each sample, 20 μg of protein was denatured in SDS sample buffer and resolved on a 4-12% Tris-HCl polyacrylamide gels (Bio-Rad, Hercules, CA). Proteins were transferred to PVDF membranes and blocked with 5% non-fat dry milk overnight. The primary antibody used to detect MRP-1 was MRPr1 that was purchased from Signet Laboratories (Dedham, MA). The primary antibody used to detect GAPDH (FL-335), along with appropriate species-specific secondary antibodies for the GAPDH and MRP-1 primary antibodies were purchased from Santa Cruz Biotechnology (Santa Cruz, CA). Proteins were visualized using chemiluminescence (Pierce).
Efflux experiments
RAW 264.7 cells were plated in 12-well tissue culture plates at a density of 6 × 10⁶ cells per plate and incubated under the conditions described above. After allowing cells to adhere for 3 h, the media was replaced with fresh media containing 100 ng/ml LPS. In place of LPS, an equivalent volume of 0.91% saline was added to the media in the mock-treated cells. After 20 h, the cells were washed with PBS and DMEM (without serum or phenol red) was added to the cells. The cells were then placed in a 37° incubator without CO2. At this time, MK-571 was added to the media at a final concentration of 50 mM for wells that were treated with this inhibitor. After 30 minutes, DMEM was replaced with DMEM containing calcein-AM (Invitrogen, Carlsbad, CA) at a final concentration of 5 M, or calcein-AM and MK-571.After 1 h, the DMEM containing the calcein-AM was removed, the cells were briefly washed with ice-cold PBS, and 1 mL of DMEM, or DMEM to which MK-571 had been added, was added to each well. For 1 h, 100 L samples of media were withdrawn every 15 m for analysis; media was replaced with 100 μL of fresh media. Fluorescence of these samples was analyzed in a Bio-Tek FLx800 fluorescent plate reader (Winooski, VT). The cells in each well were lysed and protein concentration was determined using a BCA assay. The amount of calcein in the samples was quantified by comparison with standards generated by dissolving calcein (Sigma, St. Louis) in DMEM.
RESULTS
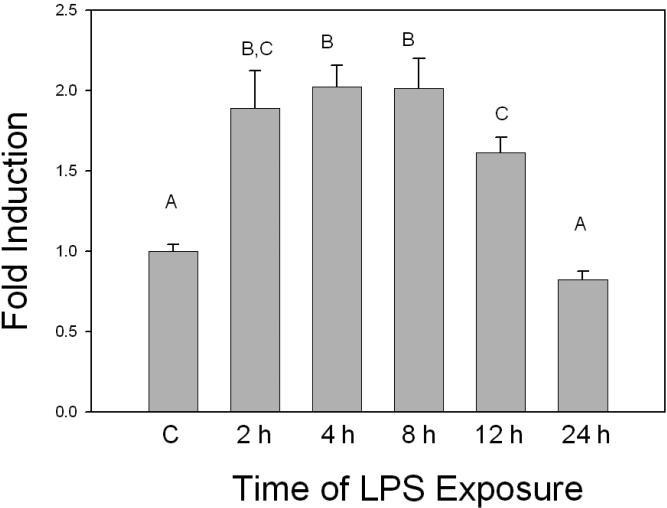
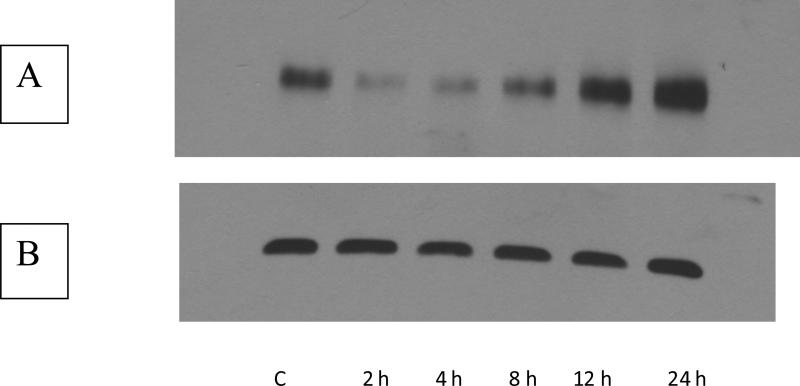
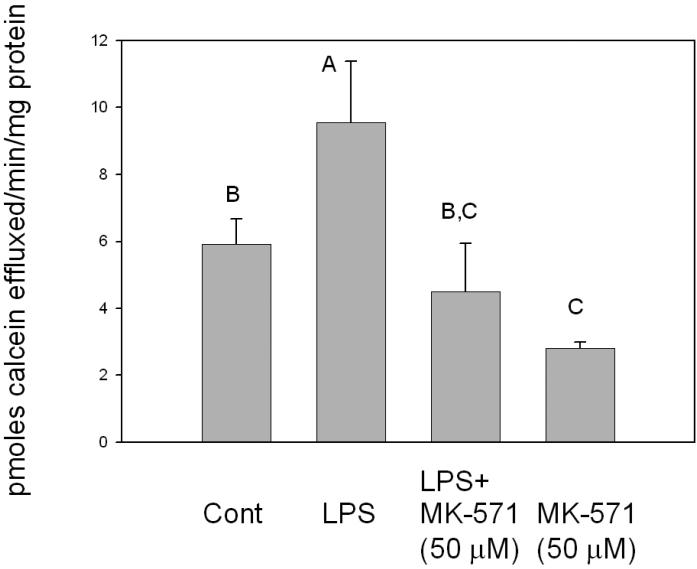
In order to assess the effect of LPS exposure on MRP-1 expression in macrophages, RAW 264.7 cells were treated with LPS and levels of MRP-1 mRNA, protein and functional activity were determined. Compared to the controls, mRNA levels were significantly increased at 2 h after treatment (Figure 1). MRP-1 mRNA levels continued to increase, so that expression reached a peak at 4-8 h that was approximately two-fold that of the control. By 12 h after LPS treatment, MRP-1 levels started to decline and by 24 h after LPS treatment, levels of MRP-1 mRNA were not significantly different from those of the control. In terms of protein levels, western blot analyses indicated that, relative to the control, there was a decline in MRP-1 protein expression at 2 h after LPS treatment (Figure 2). By 8-12 h after the initiation of LPS exposure, MRP-1 protein levels had increased so that they were significantly above the MRP-1 protein levels in the control. Thus, the changes in protein levels are consistent with the changes in the mRNA levels that were seen 4-8 h earlier. At 24 h post-treatment, MRP-1 protein levels in LPS-treated macrophages are approximately 2-fold higher than in the control. Efflux experiments that measured extrusion of calcein from LPS-treated macrophages were used to assess levels of MRP-1 functional activity. Efflux was measured at 20 h after the initiation of LPS treatment because elevated levels of protein expression were measured between 12 and 24 h. and preliminary experiments indicated that at this time the level of MRP-1 expression was at, or near, its peak. At 20 h after LPS treatment was initiated, efflux of calcein was increased by approximately 1.5-fold relative to the mock-treated control (Figure 3). In LPS-treated cells, the MRP-1 inhibitor MK-571 suppressed calcein efflux to levels significantly below that of the mock-treated control. When mock-treated cells were exposed to MK-571, calcein efflux levels decreased to a level that was approximately 50% of the level of mock-treated cells that were not exposed to MK-571. Thus, LPS treatment of RAW 264.7 cells resulted in an increase in levels of MRP-1 mRNA, protein and functional activity. The increase in mRNA was apparent after 2 h of LPS exposure, while the increase in MRP-1 at the level of protein was not evident until 8-12 h after the initiation of LPS exposure. The increase in all levels, relative to the mock-treated control was in the range of 1.5- 2.5-fold. It is of note that very similar results have been obtained when using the J774.1 mouse macrophage cell line (data not shown). This strongly suggests that the observed effects of LPS on MRP-1 expression are genuine rather than an artifact of the immortalized cell line.
FIGURE 1.
Induction of MRP-1 mRNA by LPS. Total RNA was isolated from RAW 264.7 cells exposed to LPS for periods ranging between 2 h and 24 h. Levels of MRP-1 RNA were determined by real time PCR. Relative quantification of gene expression was performed with GAPDH as the endogenous control using the 2-ΔΔCt method. All assays were run in triplicate. The data shown are the results from 3 independent experiments. Letters different from each other indicate a statistical difference between treatment groups (p<0.05) as determined by a one way ANOVA followed by Duncan's Multiple Range Test.
FIGURE 2.
Western blot of induction of MRP-1 protein by LPS. Total protein was isolated from RAW 264.7 cells exposed to LPS for periods ranging between 2 h and 24 h. A. Western blot using the MRPr1 antibody. The numbers below the lane indicate the time of exposure to LPS. B. Western blot using GAPDH as a loading control. The numbers below the lanes represent the time for which the cells were exposed to 100 ng/mL LPS.
FIGURE 3.
Calcein efflux assays of RAW 264.7 cells. RAW 264.7 cells that had been plated in 12-well tissue culture plates were treated with LPS for 20 h and then loaded with calcein-AM for 1 h. Wells to which the MRP inhibitor MK-571 was added, were pretreated with the inhibitor for 30 minutes before the addition of calcein-AM. After loading, cells were washed and 1 mL of media was added to each well. At 15 minute intervals 100 μL aliquots were withdrawn and used for measuring fluorescence. At the end of 1 h, media was removed from wells and the protein content of each well was measured using a BCA assay. Results shown are from 3 independent experiments. Letters different from each other indicate a statistical difference (p<0.05) between treatment groups as determined by one way ANOVA followed by Duncan's Multiple Range Test.
DISCUSSION
In a previous report (Leite et al., 2007) MRP-1 expression in RAW 264.7 cells was studied by flow cytometry and the results indicated that LPS caused a significant decrease in the number of RAW 264.7 cells expressing MRP-1. However, they also suggested that LPS did cause an increase in MRP-1 functional activity because they had obtained similar results from extrusion studies on both resting and activated macrophages. Our study shows that LPS causes an increase in MRP-1 functional activity in activated macrophages and clearly demonstrates that this increase is accompanied by similar increases in the levels of MRP-1 mRNA and protein expression.
Using mouse embryonic fibroblast cells from wild type and knockout mice, other investigators determined that NF-E2-related factor-2 (Nrf2) is important for the expression of constitutive and inducible levels of MRP-1(Hayashi et al., 2003). Nrf2 is involved in the cellular response to oxidative stress by stimulating the induction of genes that are regulated by antioxidant response elements (ARE). The Nrf2 pathway has been demonstrated to regulate ARE-dependent pathways in macrophages and monocytes (Ishii et al., 2000; Rushworth et al., 2008), Exposure of human monocytes to LPS induces the expression of NADPH: quinine oxidoreductase and heme oxygenase 1 through the Nrf2 pathway (Rushworth et al., 2008). This information suggests that the Nrf2 pathway is involved in the increases in MRP-1 expression that we observed.
There are important ramifications of our findings with regard to the potential impact of bacterial infection upon drug disposition, particularly in the treatment of HIV-1 infection because the HIV-1 protease inhibitors (PI) ritonavir and saquinavir are substrates of MRP-1 (Meaden et al., 2002; Dallas et al., 2004; Eilers et al., 2008). Attainment of effective intracellular concentrations of HIV-1 PIs in macrophages is problematic. The EC50 value of saquinavir for inhibiting HIV-1 replication is ~25-fold higher in chronically infected macrophages than in acutely infected lymphocytes (Perno et al., 1998), and a similar situation occurs with ritonavir. The trough values for these antivirals fall below the EC50 in chronically infected macrophages, a condition that is relatively ineffective at eliminating viral replication (Perno et al., 1998). Our results suggest that the effectiveness of HIV-1 PI therapy may be compromised by the presence of opportunistic infections. A better understanding of the regulation of multidrug efflux transporters, and the effects of pathogens on the expression of these transporters, is necessary in order to achieve optimal therapeutic efficacy of antiretrovirals.
ACKNOWLEDMENTS
The work was supported by NIH grants AI010657 (PSS), GM050870 (NQ) and DA015013 (AK).
REFERENCES
- Cao CX, Silverstein SC, Neu HC, Steinberg TH. J774 macrophages secrete antibiotics via organic anion transporters. J Infect Dis. 1992;165:322–328. doi: 10.1093/infdis/165.2.322. [DOI] [PubMed] [Google Scholar]
- Dallas S, Ronaldson PT, Bendayan M, Bendayan R. Multidrug resistance protein 1-mediated transport of saquinavir by microglia. Neuroreport. 2004;15:1183–1186. doi: 10.1097/00001756-200405190-00020. [DOI] [PubMed] [Google Scholar]
- Eilers M, Roy U, Mondal D. MRP (ABCC) transporters-mediated efflux of anti-HIV drugs, saquinavir and zidovudine, from human endothelial cells. Exp Biol Med (Maywood) 2008;233:1149–1160. doi: 10.3181/0802-RM-59. [DOI] [PMC free article] [PubMed] [Google Scholar]
- Hayashi A, Suzuki H, Itoh K, Yamamoto M, Sugiyama Y. Transcription factor Nrf2 is required for the constitutive and inducible expression of multidrug resistance-associated protein 1 in mouse embryo fibroblasts. Biochem Biophys Res Commun. 2003;310:824–829. doi: 10.1016/j.bbrc.2003.09.086. [DOI] [PubMed] [Google Scholar]
- Hayashi K, Pu H, Andras IE, Eum SY, Yamauchi A, Hennig B, Toborek M. HIV-TAT protein upregulates expression of multidrug resistance protein 1 in the blood-brain barrier. J Cereb Blood Flow Metab. 2006;26:1052–1065. doi: 10.1038/sj.jcbfm.9600254. [DOI] [PubMed] [Google Scholar]
- Ishii T, Itoh K, Takahashi S, Sato H, Yanagawa T, Katoh Y, Bannai S, Yamamoto M. Transcription factor Nrf2 coordinately regulates a group of oxidative stress-inducible genes in macrophages. J Biol Chem. 2000;275:16023–16029. doi: 10.1074/jbc.275.21.16023. [DOI] [PubMed] [Google Scholar]
- Leier I, Jedlitschky G, Buchholz U, Center M, Cole SP, Deeley RG, Keppler D. ATP-dependent glutathione disulphide transport mediated by the MRP gene-encoded conjugate export pump. Biochem J. 1996;314(Pt 2):433–437. doi: 10.1042/bj3140433. [DOI] [PMC free article] [PubMed] [Google Scholar]
- Leite DF, Echevarria-Lima J, Calixto JB, Rumjanek VM. Multidrug resistance related protein (ABCC1) and its role on nitrite production by the murine macrophage cell line RAW 264.7. Biochem Pharmacol. 2007;73:665–674. doi: 10.1016/j.bcp.2006.11.005. [DOI] [PubMed] [Google Scholar]
- Leslie EM, Deeley RG, Cole SP. Multidrug resistance proteins: role of P-glycoprotein, MRP1, MRP2, and BCRP (ABCG2) in tissue defense. Toxicol Appl Pharmacol. 2005;204:216–237. doi: 10.1016/j.taap.2004.10.012. [DOI] [PubMed] [Google Scholar]
- Meaden ER, Hoggard PG, Newton P, Tjia JF, Aldam D, Cornforth D, Lloyd J, Williams I, Back DJ, Khoo SH. P-glycoprotein and MRP1 expression and reduced ritonavir and saquinavir accumulation in HIV-infected individuals. J Antimicrob Chemother. 2002;50:583–588. doi: 10.1093/jac/dkf161. [DOI] [PubMed] [Google Scholar]
- Perno CF, Newcomb FM, Davis DA, Aquaro S, Humphrey RW, Calio R, Yarchoan R. Relative potency of protease inhibitors in monocytes/macrophages acutely and chronically infected with human immunodeficiency virus. J Infect Dis. 1998;178:413–422. doi: 10.1086/515642. [DOI] [PubMed] [Google Scholar]
- Qureshi N, Takayama K, Mascagni P, Honovich J, Wong R, Cotter RJ. Complete structural determination of lipopolysaccharide obtained from deep rough mutant of Escherichia coli. Purification by high performance liquid chromatography and direct analysis by plasma desorption mass spectrometry. J Biol Chem. 1988;263:11971–11976. [PubMed] [Google Scholar]
- Ronaldson PT, Bendayan R. HIV-1 viral envelope glycoprotein gp120 produces oxidative stress and regulates the functional expression of multidrug resistance protein-1 (Mrp1) in glial cells. J Neurochem. 2008;106:1298–1313. doi: 10.1111/j.1471-4159.2008.05479.x. [DOI] [PubMed] [Google Scholar]
- Rushworth SA, MacEwan DJ, O'Connell MA. Lipopolysaccharide-induced expression of NAD(P)H:quinone oxidoreductase 1 and heme oxygenase-1 protects against excessive inflammatory responses in human monocytes. J Immunol. 2008;181:6730–6737. doi: 10.4049/jimmunol.181.10.6730. [DOI] [PMC free article] [PubMed] [Google Scholar]
- Yamane Y, Furuichi M, Song R, Van NT, Mulcahy RT, Ishikawa T, Kuo MT. Expression of multidrug resistance protein/GS-X pump and gamma-glutamylcysteine synthetase genes is regulated by oxidative stress. J Biol Chem. 1998;273:31075–31085. doi: 10.1074/jbc.273.47.31075. [DOI] [PubMed] [Google Scholar]


