Abstract
OBJECTIVE
To develop ultrashort echo time (UTE) magnetic resonance imaging (MRI) techniques to image the zone of calcified cartilage (ZCC), and quantify its T2*, T1 and T1ρ.
DESIGN
In this feasibility study a dual inversion recovery ultrashort echo time (DIR-UTE) sequence was developed for high contrast imaging of the ZCC. T2* of the ZCC was measured with DIR-UTE acquisitions at progressively increasing TEs. T1 of the ZCC was measured with saturation recovery UTE acquisitions at progressively increasing saturation recovery times. T1ρ of the ZCC was measured with spin-locking prepared DIR-UTE acquisitions at progressively increasing spin-locking times.
RESULTS
The feasibility of the qualitative and quantitative DIR-UTE techniques was demonstrated on phantoms and in six cadaveric patellae using a clinical 3T scanner. On average the ZCC has a short T2* ranging from 1.0 to 3.3 ms (mean ± standard deviation = 2.0 ± 1.2 ms), a short T1 ranging from 256 to 389 ms (mean ± standard deviation = 305 ± 45 ms), and a short T1ρ ranging from 2.2 to 4.6 ms (mean ± standard deviation = 3.6 ± 1.2 ms).
CONCLUSION
UTE MR based techniques have been developed for high resolution imaging of the ZCC and quantitative evaluation of its T2*, T1 and T1ρ relaxation times, providing noninvasive assessment of collagen orientation and proteoglycan content at the zone of calcified cartilage and the bone cartilage interface. These measurements may be useful for non-invasive assessment of the ZCC, including understanding the involvement of this tissue component in osteoarthritis.
Keywords: Ultrashort echo time, adiabatic inversion recovery, dual inversion recovery, T1ρ, ZCC
Introduction
Articular cartilage has a hierarchical structure. It can be divided into four zones: (i) the superficial zone, (ii) the transitional zone, (iii) the radial zone, and (iv) the zone of calcified cartilage (ZCC) which is 3-8% of the cartilage thickness (1, 2). The calcified cartilage is separated from the overlying cartilage by the tidemark, and from subchondral bone (SCB) by the cement line. The zones of articular cartilage have T2 relaxation times ranging from around 40 ms for the superficial layer down to sub-millisecond for SCB (3-5).
The ZCC is a highly modified mineralized region of articular cartilage that forms an important interface between cartilage and bone for transmitting force and attaching cartilage to bone (6). It is a region that may change dramatically in OA (7-9). Its continued activity as a growth plate in OA has long been the subject of much speculation (10-13). With a few exceptions, almost all of our knowledge about the formation, development maturation, aging, and possible changes in OA of the ZCC has come from the application of microscopic techniques. Magnetic resonance imaging (MRI) is routinely used in the diagnosis of OA because of its high spatial resolution and excellent soft tissue contrast (4). However, conventional sequences typically have a minimum TE of several milliseconds or longer, and show little or no signal for the ZCC because of its short T2*.
By using a special form of slice selection, rapid transmit/receive (T/R) switching, radial mapping of k-space and variable-rate selective excitation (VERSE), pulse sequences with nominal TEs as short as 8 μs, which is 100-1000 times shorter than those routinely available on clinical MR systems, can be achieved (14-20). These 2D ultrashort TE (UTE) sequences can directly image short T2* tissues such as cortical bone (15, 16), menisci (15, 17), ligaments (17), tendons (17, 18), calcification in soft tissues (19), and the ZCC (20) using clinical scanners. Although the ZCC can be detected with UTE sequences, its visualization may be compromised by high signal intensity from the superficial layers of cartilage and marrow fat. Efficient suppression of those long T2* signals can be used to improve short T2* contrast and dynamic range for display of the ZCC (18, 20).
Recent research has focused on establishing correlations between quantitative MR parameters and the biochemical, structural and biomechanical properties of articular cartilage. T1ρ reflects slow interactions between motion restricted water molecules and their local macromolecular environment (21). Recent studies have demonstrated that T1ρ has a high sensitivity to proteoglycan (PG) loss in bovine cartilage samples as well as to OA in patients (21, 22). T2 mapping based on Carl-Purcell-Meiboon-Gill (CPMG) sequences has been used to monitor microstructural changes in collagen matrix (3). However, T1ρ and T2 mapping usually utilize relatively long TEs, and so can only reflect the status of longer T2 tissue components, such as the more superficial layers of articular cartilage. As far as we are aware, the MR relaxation properties of the ZCC are virtually unknown.
In this paper we describe techniques to image the ZCC and quantify its T2*, T1 and T1ρ using UTE or dual adiabatic inversion recovery UTE (DIR-UTE) sequences. Qualitative and quantitative UTE based sequences have been implemented on a clinical 3T MR scanner and assessed on six cadaveric patella specimens in this study.
Materials and Methods
Pulse Sequences
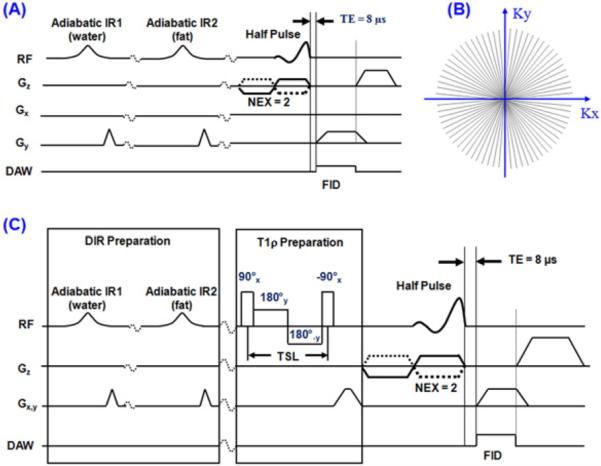
Both regular two-dimensional (2D) DIR-UTE and spin-lock prepared DIR-UTE sequences (Figure 1) were implemented on a 3T Signa TwinSpeed scanner (GE Healthcare Technologies, Milwaukee, WI) with gradient capabilities of 40 mT/m amplitude and 150 mT/m/ms slew rate on each axis. The regular DIR-UTE sequence (Figure 1A) has three parts: a half-sinc radiofrequency (RF) excitation pulse, 2D radial acquisition with ramp sampling, and dual adiabatic inversion recovery preparation pulses for long-T2 water and fat suppression (20). The spin-locking prepared DIR-UTE sequence combines a spin-locking preparation pulse cluster with the regular DIR-UTE sequence (Figure 1C) (23).
Figure 1.
(A) The DIR-UTE pulse sequence. This combines half pulse excitation, radial ramp sampling and dual adiabatic inversion pulses to selectively image the ZCC with a nominal TE of 8 μs. The longitudinal magnetization of the superficial layers of cartilage and marrow fat are inverted and nulled by the two adiabatic inversion pulses. The corresponding radial k-space trajectories are shown in (B). (C) The spin-locking prepared DIR-UTE sequence combines a regular DIR-UTE sequence with a spin-locking preparation pulse, which consists of a hard 90° pulse followed by a spin-locking field and another -90° hard pulse.
The DIR-UTE contrast mechanism is illustrated in Figure 2. The first long adiabatic inversion pulse (duration ~ 25 ms, spectral bandwidth ~ 500 Hz) is centered near the water peak with an inversion time of TI-1 to invert and null the magnetization of the longer T2 superficial layers of articular cartilage. The second long adiabatic inversion pulse with the same duration and spectral bandwidth is centered near the fat peak with an inversion time of TI-2 to invert and null the magnetization of marrow fat. The superficial layers of cartilage have longer T1s than marrow fat (24), and are inverted first The ZCC has a short T2* and its longitudinal magnetization is not inverted. Signal from this tissue is subsequently detected by the UTE data acquisition.
Figure 2.
Data acquisition scheme for the DIR-UTE sequence. The first adiabatic IR pulse is centered near the water peak and the second adiabatic IR pulse is centered near the fat peak. The longitudinal magnetization for the ZCC is not inverted but largely saturated by each of the two adiabatic IR pulses. UTE acquisition starts at a time delay of TI-1 to invert and null the longitudinal magnetization of the superficial layers of cartilage, and a time delay of TI-2 to invert and null the longitudinal magnetization of marrow fat. Signal from the ZCC recovered during TI-2 is detected by subsequent UTE data acquisition, creating high image contrast for the ZCC.
T2* Measurement
The approach to measurement of T2* was similar to the conventional strategy of varying TE while keeping TR constant. In order to monitor short T2* species, however, the range of echo times is significantly shorter than those used with standard MR imaging. T2* of the ZCC was quantified through exponential fitting of DIR-UTE images acquired at a series of TEs based on the following equation:
| [1] |
where a constant term C is introduced to account for background noise and artifacts associated with DIR-UTE data acquisition and image reconstruction.
T1 Measurement
A non-selective 90° square pulse with a duration of 256 μs was followed by a large crusher gradient to saturate signal from the ZCC. UTE acquisitions with progressively increasing saturation recovery times (TSRs) were then used to detect the recovery of the longitudinal magnetization of the ZCC. The simple exponential signal recovery model shown below was used to fit T1 (25):
| [2] |
where k accounts for the residual fraction of the longitudinal magnetization of the ZCC after a nominal 90° pulse.
T1ρ Measurement
T1ρ of the ZCC was measured with spin-locking prepared DIR-UTE acquisitions at progressively increasing spin-locking times (TSLs) using the following signal decay model (23):
| [3] |
where TR is the time between α imaging pulses, and C accounts for background noise and artifacts associated with spin-lock prepared DIR-UTE data acquisition and image reconstruction.
Simulation
Numerical simulation was performed to investigate the effect of DIR preparation pulses on short T2* signal attenuation based on the Bloch equations. Errors in T1ρ quantification due to T1 contamination was also investigated through simulation based on equation [2]. The following parameters were used: TR = 300 ms, TE = 8 μs, TI-1 = 140 ms, TI-2 = 105 ms, T2* = 2 ms, flip angle = 60°, two adiabatic IR pulses centered on water and fat, respectively, maximal adiabatic pulse amplitude of 12 μT. To study error propagation in T1ρ estimation, a T1 of 300 were assumed.
Phantom Study
The DIR-UTE techniques were applied to a phantom consisting of a tube of distilled water doped with MnCl2 (T1 ~ 1100 ms, simulating long T2* water signal), a tube of vegetable oil (simulating fat), and a piece of rubber eraser (T2* ~ 0.3 ms, simulating short T2* signal). For morphological comparison a regular UTE sequence, and UTE sequences combined with a single adiabatic inversion pulse focused on either the water or fat peak, were performed. For quantitative comparison, both conventional 2D UTE and DIR-UTE sequences were used for measurements of T2* and T1ρ of the rubber eraser. The following imaging parameters were used: a FOV of 8 cm, a slice thickness of 2 mm, a reconstruction matrix of 512×512, a sampling bandwidth (BW) of 125 kHz, 511 half projections, two number of excitations (NEX), 5 minutes scan time. Other parameters were similar to these used in the simulation. To measure T2*, conventional UTE and DIR-UTE images were acquired at a series of TEs of 8 μs, 0.2, 0.4, 0.8, 1.2, 1.6 and 2 ms. To measure T1ρ, UTE-T1ρ and DIR-UTE T1ρ images were acquired at a series of TSLs of 0, 0.2, 0.4, 0.8, 1.2, 1.6 and 2 ms. A 3-inch surface coil was used for signal reception (a body coil was used for signal excitation). T2* and T1ρ values without, and with the DIR preparation pulse were compared.
Cadaver Patellae Study
The quantitative DIR-UTE sequences were applied on six cadaveric human patellae. After harvesting, a transverse slab of 5 mm thickness was cut from each patella and stored in a phosphate buffered saline (PBS) soaked gauze at 4°C prior to MR imaging. During MR imaging each patella sample was placed in perfluorooctyl bromide (PFOB) or saline solution to minimize susceptibility effects at tissue-air junctions. A single slice at the center of each patella slab was imaged with the apex normal to the B0 field to minimize the magic angle effect which is known to affect both T2* and T1ρ (26, 27). For comparison a conventional UTE sequence, a 2D gradient recalled echo (GRE) sequence with a TE of 3 ms, a proton-density weighted fast spin echo (PD-FSE) sequence and a T1-weighted fast spin echo (T1-FSE) sequence were also performed. Typical imaging parameters were similar to those for the phantom studies, except for a thinner slice of 0.7 mm. T2* was quantified through DIR-UTE imaging at a series of TEs (8 μs, 1, 4 and 12 ms). One sample was acquired with 10 TEs (8 μs, 0.2, 0.5, 1, 1.5, 2, 3.5, 5, 7.5 and 10 ms). T1ρ was quantified through spin-locking prepared DIR-UTE imaging at a series of TSLs (0.02, 1, 4 and 12 ms). T1 was quantified through saturation recovery UTE imaging at a series of TSRs (10, 100, 200, 400, 600, 800 ms). The total scan time was about 20 minutes for T2* quantification, 20 minutes for T1ρ quantification, and 26 minutes for T1 quantification. A home-built 1-inch Transmit/Receive birdcage coil was used for signal excitation and reception.
Quantitative Analysis
Both signal to noise ratio (SNR) and contrast to noise ratio (CNR) measurements were performed. SNR was calculated as the ratio of the mean signal intensity inside a user drawn region of interest (ROI) within the ZCC to the standard deviation of the signal in an ROI placed in artifact free background. CNR between the ZCC and the superficial cartilage and marrow fat were calculated as their signal difference over background noise. T2*, T1 and T1ρ values were obtained using a Levenberg-Marquardt fitting algorithm written in Matlab (The Mathworks, Natick, MA). The placement of manual ROIs is susceptible to volume averaging and misregistration. A small line-shaped ROI containing approximately 10-20 pixels was chosen to minimize errors of this type. Five different ROIs were fitted to determine the average relaxation times for the ZCC.
Results
Simulations
The Bloch equation simulations show that the DIR preparation pulse cluster results in about 68% signal loss for the ZCC when a T2* of 2 ms is assumed. Both the first and second IR pulses almost completely saturate the longitudinal magnetization of the ZCC. The ~32% longitudinal magnetization comes from T1 recovery during TI-2. The hard 90° pulse results in a comparative signal loss of 3-8% for the ZCC with a T2* of 1 to 3 ms, when compared with tissues with infinitely long T2* relaxation times. Based on equations [2] and [3], a 20% error in T1 quantification roughly leads to 3% error in T1ρ quantification, while this error increases to 12% as the T1 error increases to 100%.
Phantom Study
Figure 3 shows the results of the phantom study using the DIR-UTE sequence, as well as conventional UTE and UTE with a single long adiabatic inversion pulse focused on either the water peak or fat peak. The long duration adiabatic inversion pulse focused on water peak (0 Hz) selectively nulls the water signal, but signal from fat and the rubber eraser remain high. When the long adiabatic inversion pulse is shifted to -440 Hz, fat signal is selectively suppressed, but signal from water and rubber eraser remains high. There is some residual fat signal from CH peak which is located at 5.3 ppm (close to the water peak) and is not inverted/nulled by the inversion pulse. The DIR-UTE sequence selectively suppresses both water and fat, leaving high signal and contrast from the rubber eraser.
Figure 3.
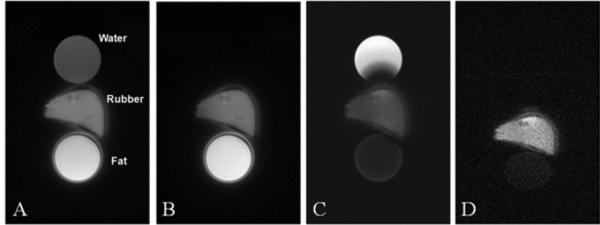
UTE imaging of a phantom consisting of a tube of water, a tube of fat and a piece of eraser rubber with a short T2* (A). UTE imaging with the adiabatic inversion pulse centered on the water peak completely nulls the water signal but the fat signal remains high (B). UTE imaging with the adiabatic inversion pulse centered on the fat peak significantly suppressed the fat signal but the water signal remains high (C). The DIR-UTE technique suppresses both water and fat, leaving a high contrast image of the rubber (D). The ring artifacts surrounding the fat tube and rubber are due to off-resonance effects.
T2* of the rubber eraser was measured to be 0.31 ± 0.02 ms with the UTE sequence and 0.29 ± 0.01 ms with the DIR-UTE sequence. T1ρ of the rubber eraser was measured to be 0.59 ± 0.12 ms with the UTE T1rho sequence and 0.57 ± 0.08 ms with the DIR-UTE T1rho sequence. These results demonstrate that the DIR-UTE sequences provide consistent T2* and T1ρ values (with an error of 3-6%) for the rubber eraser when compared to these from conventional UTE sequences.
Cadaver Patellae Study
Figure 4 shows clinical and UTE MR imaging of a patella slice from a human cadaver knee specimen. The clinical PD- and T1-FSE sequences show a signal void for the ZCC. Conventional UTE sequence shows high signal for the ZCC, but with limited contrast between it and the superficial layers of cartilage or marrow fat. The DIR-UTE sequence selectively suppresses signals from both marrow fat and superficial layers of cartilage, leaving the ZCC shown with high contrast. An association between signal reduction and increase in thickness in the ZCC was observed in the lateral part of the patella.
Figure 4.
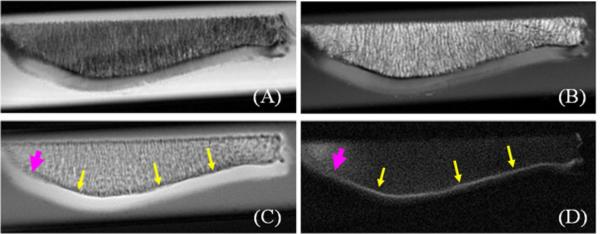
Imaging of a patella slab using PD-FSE (A), T1-FSE (B), regular UTE (C) and DIR-UTE (D) sequences, respectively. The clinical FSE sequences show a signal void for the ZCC (A, B). The regular UTE sequence shows high signal for the ZCC, but provides little contrast between the ZCC (arrows) and the superficial layers of cartilage (C). The DIR-UTE sequence selectively suppresses signals from fat and the superficial layers of cartilage, creating high contrast for the ZCC which is shows as a linear, well-defined area of high signal (thin arrows) ) (D). There is a reduction in signal and increase in thickness from the ZCC in the lateral part of the patella (thick arrows) where morphological degradation was observed.
Figure 5 shows clinical and UTE MR imaging of another patella. The clinical PD-FSE, T1-FSE and GE sequences show a signal void for the ZCC. The regular UTE sequence shows a high signal line, representing the ZCC, but with limited contrast. High contrast imaging of the ZCC is shown with the DIR-UTE sequence. Figure 6 shows DIR-UTE imaging of the ZCC at progressively increasing TEs. The excellent soft tissue suppression from the DIR preparation pulse minimizes signal contamination from the long T2 superficial layers of articular cartilage as well as marrow fat, resulting in robust measurement of T2* of the ZCC. There is rapid signal decay with increasing TE, suggesting a short T2* relaxation time for the ZCC. This is confirmed by the mono-exponential fitting which shows a T2* of 1.79 ± 0.20 ms for the ZCC.
Figure 5.
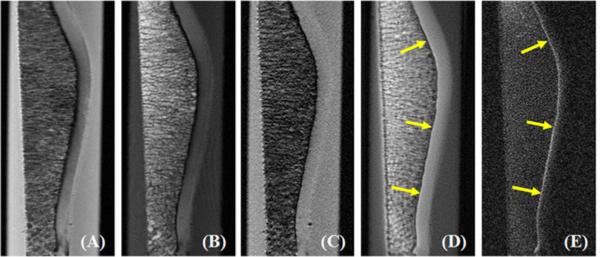
Imaging of a normal patella sample using PD-FSE (A), T1-FSE (B), GRE (C), regular UTE (D) and DIR-UTE (E) sequences. The clinical FSE and GRE sequences show a signal void for the ZCC. The regular UTE sequence shows high signal but low contrast for the ZCC (arrows). This is shown with high contrast by the DIR-UTE sequence (E).
Figure 6.
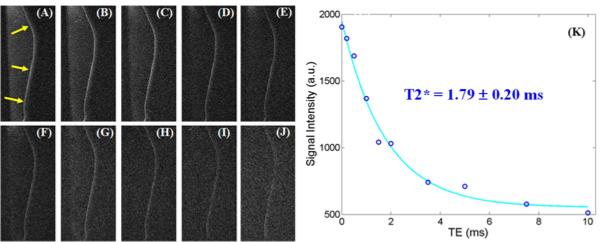
DIR-UTE imaging of the ZCC at a series of TEs of 8 μs (A), 200 μs (B), 500 μs (C), 1 ms (D), 1.5 ms (E), 2 ms (F), 3.5 ms (G), 5 ms (H), 7.5 ms (I), 10 ms (J), as well as single component exponential fitting to the decay curve (K). There is loss of signal with increasing TE (A-J). The decay curve (K) shows a short T2* of 1.79 ms for the ZCC.
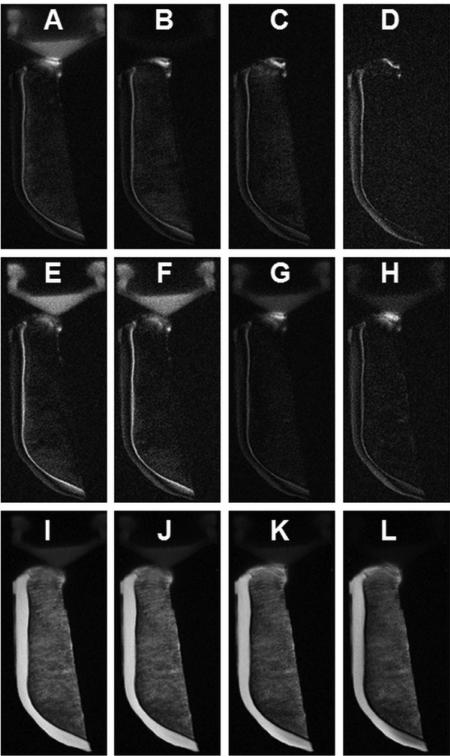
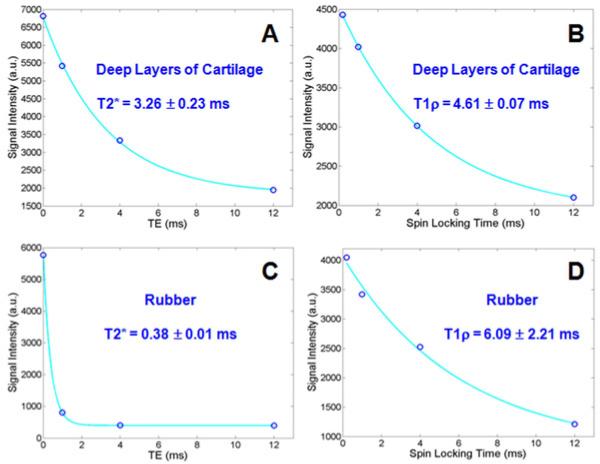
Quantitative T2* and T1ρ DIR-UTE imaging of the ZCC of a patella sample are shown in Figure 7. The DIR-UTE images show the ZCC with excellent contrast. It is hardly visible with conventional UTE-T1ρ imaging. Exponential fitting of the DIR-UTE images shows a short T2* of 3.26 ± 0.23 ms and T1ρ of 4.61 ± 0.07 ms, as indicated in Figure 8. T1ρ was about 41% longer than T2* for the ZCC. A relatively short T1 of 304 ± 25 ms for the ZCC of this patella derived from saturation recovery UTE imaging was used for T1ρ fitting. Interestingly, the rubber stopper had a short T2* of 0.38 ± 0.01 ms and a T1ρ of 6.09 ± 2.21 ms, suggesting that T1ρ was 16 times longer than T2*.
Figure 7.
DIR-UTE imaging of the ZCC at a series of TEs of 8 μs (A), 1 ms (B), 4 ms (C) and 12 ms (D), as well as DIR-UTE T1ρ imaging of the ZCC at a series of TSLs of 0.02 ms (E), 1 ms (F), 4 ms (G) and 12 ms (H). Fat saturated UTE imaging of the same patella at a series of TEs of 8 μs (I), 1 ms (J), 4 ms (K) and 12 ms (L) are also displayed for comparison. There is progressive loss of signal from (A) to (D) and from (E) to (H). Fat saturation alone provides poor delineation of the ZCC (I-L).
Figure 8.
Single component curve fitting shows a short T2* of 3.26 ± 0.23 ms (A) and a T1ρ of 4.61 ± 0.07 ms (B) for the ZCC of the patella shown in Figure 7. In comparison, the rubber stopper in the syringe has a short T2* of 0.38 ± 0.01 ms (C) and a T1ρ of 6.09 ± 2.21 ms (D).
Quantitative measurements of SNR and CNR shown in Table 1 demonstrate that the DIR-UTE sequence provides a significant contrast improvement between the ZCC and superficial cartilage and marrow fat when compared with the conventional UTE and clinical sequences. Table 2 shows the quantitative evaluation of T2*, T1 and T1ρ over six cadaveric patellae. On average, T2* ranged from 1.0 to 3.3 ms (mean ± standard deviation = 2.0 ± 1.2 ms), T1 ranged from 256 to 389 ms (305 ± 45 ms), while T1ρ ranged from 2.2 to 4.6 ms (3.6 ± 1.2 ms).
Table 1.
Quantitative measurements of SNR for the ZCC, CNR between the ZCC and the superficial cartilage (SC), and CNR between the ZCC and fat for conventional clinical T1-FSE, PD-FSE, GRE, UTE, and DIR-UTE images (mean and standard deviation over six patellae)
| T1-FSE | PD-FSE | GRE | UTE | DIR-UTE | |
|---|---|---|---|---|---|
| SNRZCC | 3.2 (0.4) | 2.8 (0.4) | 2.1 (0.3) | 33.1 (6.8) | 19.5 (4.4) |
| -26.7 (3.7) | -30.1 (5.3) | -7.7 (1.4) | 3.4 (0.6) | 14.5 (4.1) | |
| -34.6 (5.3) | -15.8 (3.9) | -20.2 (4.1) | -2.9 (0.8) | 11.7 (3.6) |
Table 2.
Quantitative measurements of T2*, T1 and T1ρ of the ZCC. Minimum, maximum, mean and standard deviation derived from six patellae were displayed.
| Min | Max | Mean ± Std | |
|---|---|---|---|
| T2* | 1.0 | 3.3 | 2.0 ± 1.2 |
| T1 | 256 | 389 | 305 ± 45 |
| T1ρ | 2.2 | 4.6 | 3.6 ±1.2 |
Discussion
One of the most important questions about the ZCC is its involvement in the initiation of pathogenesis in OA. It is generally believed that the initial changes of OA occur in the noncalcified part of the cartilage rather than the calcified layer, and that degeneration and erosion of the articular cartilage result in mechanical overload. Bone responds by becoming sclerotic, and this leads to further degeneration (28-30). However, a number of recent studies have found changes in the ZCC and SCB that are not readily explicable by this model (31-37). The ZCC is an order of magnitude less stiff than bone, but 10-100 fold stiffer than cartilage (32). This supports the concept that the ZCC forms a transition zone of intermediate stiffness between the articular cartilage and the SBC. In an adult the ZCC becomes quiescent but not inactive. In OA the ZCC may be reactive and progressively extend to and calcify adjacent unmineralized cartilage. This may contribute to relative thinning of uncalcified cartilage and increased force gradient across the uncalcified cartilage leading to more damage (33). Burr found that in OA calcified cartilage was significantly denser and had significantly more mineral than the adjacent SCB (34). He concluded that it was likely that changes in the mineral content and thickness of the calcified cartilage played a greater role in the pathogenesis of OA than had previously been realized. Ferguson et al studied the ZCC and SCB in normal and osteoarthritic human femoral heads (35) and found that the ZCC was extremely hypermineralized and twice as hard as neighboring SCB. Very highly mineralized cartilage fragments may function as a grinding abrasive, accelerating wear rates whether attached to, or separated from the bony surface of the ZCC. Highly mineralized regions could also alter loading patterns and thereby contribute to further destruction of the joint tissues (35). Revell et al were able to recover joints at the time of surgery from 50 patients with OA and concluded that the ZCC was active in OA (36). Histological studies have also revealed the presence of multiple tidemarks coupled with thickening and over-mineralization of the ZCC in the OA joint (37).
Taken together, the results of different studies show that the ZCC may contribute to OA via altered growth plate-like behavior of the deep cells of the deep zone and bony remodeling. In addition a number of age-correlated changes in the ZCC could compromise adjacent noncalcified cartilage and cause it to degenerate. Thus the ZCC may play an important role in the initiation and/or progression of OA. The study of early and late alterations to ZCC may therefore be of critical importance in elucidating the structural and functional pathogenesis of OA including features associated with the internal stages of the disease.
The qualitative and quantitative DIR-UTE sequences described in this paper may be significant since they allow non-invasive assessment of the ZCC, which is a region that cannot be assessed by conventional MRI techniques due to limited signal, or by conventional radiography due to limited image contrast. Studies of articular cartilage have demonstrated that T2 is related at the molecular level changes in the state of collagen (3). More recently, T2*s of deep cartilage and menisci have been show to be sensitive to matrix degeneration (38, 39). Increased T1 is associated with cartilage degeneration (40). T1ρ is correlated with proteoglycan depletion (an early sign of OA) (21, 22). The quantitative information on T2*, T1 and T1ρ may also be of value in evaluating the ZCC.
The phantom study shows that the DIR-UTE sequence allows consistent measurement of T2*, while the spin-lock prepared DIR-UTE sequence allows consistent measurement of T1ρ of short T2* species when compared with conventional UTE sequences. Based on our study of six cadaveric human patellae, the ZCC shows a wide range of T2* values ranging from 1.0 to 3.3 ms, and a wide range of T1ρ values ranging from 2.2 to 4.6 ms.
The primary goal of the DIR preparation pulse is to suppress signals from long-T2 water (such as the superficial layers of cartilage, muscle, etc) and fat (such as bone marrow). UTE sequences based on half pulse excitations are sensitive to eddy currents and are subject to out-of-slice signal contamination. The DIR preparation pulse helps to reduce out-of-slice long-T2 signal contamination, although out-of-slice short-T2* signal contamination still exists. Although the DIR-UTE sequence provides high contrast visualization of the ZCC, it is a low SNR technique. Numerical simulation based on Bloch equations suggests that the DIR preparation pulses nearly saturate the ZCC magnetization while signals from the superficial layers of cartilage and marrow fat are nulled. DIR-UTE signal of the ZCC comes almost entirely from T1 recovery during TI-2. Recent studies show that short-T2 signal attenuation depends on pulse spectral bandwidth, RF amplitude and the T2 values (18). Further optimization of the adiabatic inversion pulses may result in better preservation of the ZCC magnetization, and therefore higher SNR.
The current study was limited to ex vivo human cadaveric patellae. In vivo cartilage imaging is time and subject constrained and this results in decreased spatial resolution, reduced SNR and motion artifacts. More work will be needed to develop translational imaging of the ZCC in vivo. This is likely to include further optimization of the DIR-UTE sequences, more advanced reconstruction techniques and high performance localized coils. However, the use of ex vivo data is a critical first step in the establishment and validation of sophisticated MR pulse sequences and the quantitative information generated by them.
There are several limitations of this study. First, the sample size was small. More samples would help investigate the ranges of T2*, T1 and T1ρ of the ZCC, especially in normal and abnormal patellae. Second, reference standards such as histology and polarized light microscopy (PLM) were not performed. The correlation between quantitative DIR-UTE MR findings and histopathological scores will be investigated in future studies. Third, the DIR-UTE signal may represent not only the ZCC, but part of the deepest radial layer of articular cartilage due to limited spatial resolution. Our previous study show that the DIR-UTE signal near the osteochondral junction included the deepest layer of uncalcified cartilage and calcified cartilage, with no definite contribution from the subchondral bone (41). Fourth, the magic angle effect is a potential limitation of applying this technique, and was not investigated in this study. UTE imaging of the patellae at a series of angular orientations relative to the B0 field would help illustrating the angular dependence of T1, T2* and T1ρ values (26, 27). Fifth, the T2 of the ZCC was not investigated in our study. T2 measurement is more challenging due to the requirement for a 180° refocusing pulse. A rectangular 180° pulse may take 500 μs or longer due to the relatively low peak RF power available on clinical MR scanners. Since the T2* of the ZCC is comparable with the duration of the 180° pulse, it is difficult to refocus the transverse magnetization of the ZCC for T2 measurement. Sixth, the DIR-UTE sequences are based on 2D UTE imaging, therefore subject to partial volume effect in imaging fine structures such as the ZCC (<0.1 mm) using a relatively thick slice (e.g. 0.7 mm). However, this partial volume effect may have a more limited affect on the quantification of T2* and T1ρ values, since the DIR preparation pulse efficiently suppresses signals from long T2 water and fat. The 3D DIR-UTE sequences may allow more accurate depiction and quantitative evaluation of the ZCC (42), and will be investigated in the future.
Conclusion
The 2D DIR-UTE sequences can be used to robustly image the ZCC with high signal and image contrast, and to quantify the T2*, T1 and T1ρ. These measurements may be useful for non-invasive assessment of the ZCC.
Acknowledgments
Funding source
The authors would like to acknowledge grant support from GE Healthcare and NIH 1R21AR057901-01A1.
Footnotes
Publisher's Disclaimer: This is a PDF file of an unedited manuscript that has been accepted for publication. As a service to our customers we are providing this early version of the manuscript. The manuscript will undergo copyediting, typesetting, and review of the resulting proof before it is published in its final citable form. Please note that during the production process errors may be discovered which could affect the content, and all legal disclaimers that apply to the journal pertain.
Author contributions
Jiang Du contributed to conception and study design of the study, data acquisition and analysis, manuscript preparation and final approval of the article. Dr. Carl contributed to numerical simulation, manuscript revision and final approval of the article. Dr. Bae contributed to data analysis, manuscript revision and final approval of the article. Sheronda Statum contributed to sample preparation and final approval of the article. Dr. Bydder contributed to data interpretation, manuscript revision and final approval of the article. Dr. Chung contributed to conception and study design of this study, data interpretation, manuscript revision and final approval of the article.
Conflict of interest
The authors of this work have no conflicts of interest to report relevant to this work.
References
- 1.Bullough PG, Yawitz PS, Tafra L, Boskey AL. Topographical variations in the morphology and biochemistry of adult canine tibial plateau articular cartilage. J Orthop Res. 1985;3:1–16. doi: 10.1002/jor.1100030101. [DOI] [PubMed] [Google Scholar]
- 2.Buckwalter JA, Mankin HJ. Articular cartilage: degeneration and osteoarthritis, repair, regeneration, and transplantation. Instr Course Lect. 1998;47:487–504. [PubMed] [Google Scholar]
- 3.Mosher TJ, Dardzinski BJ. Cartilage MRI T2 relaxation time mapping: overview and applications. Semin Musculoskelet Radiol. 2004;8:355–368. doi: 10.1055/s-2004-861764. [DOI] [PubMed] [Google Scholar]
- 4.Eckstein F, Burstein D, Link TM. Quantitative MRI of cartilage and bone: degenerative changes in osteoarthritis. NMR Biomed. 2006;19:822–854. doi: 10.1002/nbm.1063. [DOI] [PubMed] [Google Scholar]
- 5.Recht MP, Goodwin DW, Winalski CS, White LM. MRI of articular cartilage: revisiting current status and future directions. AJR Am J Roentgenol. 2005;185:899–914. doi: 10.2214/AJR.05.0099. [DOI] [PubMed] [Google Scholar]
- 6.Oegema TR, Thompson RC. Fluorescent-tracer labeling for measuring remodeling in the zone of calcified cartilage. In: Maroudas A, Keuttner K, editors. Methods in Cartilage Research. Academic Press; New York: 1990. pp. 322–324. [Google Scholar]
- 7.Bullough PG, Jagannath A. The morphology of the calcification front in articular cartilage. J Bone Joint Surg. 1983;65:72–78. doi: 10.1302/0301-620X.65B1.6337169. [DOI] [PubMed] [Google Scholar]
- 8.Havelka S, Horn V, Spohrova D, Valough P. The calcified-non calcified cartilage interface; the tidemark. Acta Biol Hung. 1984;34:271–279. [PubMed] [Google Scholar]
- 9.Redler I, Mow VC, Zimny ML, Mansell J. The ultrastructure and biomechnical significance of the tidemark of articular cartilage. Clin Orthop. 1975;112:357–362. [PubMed] [Google Scholar]
- 10.Ogston R. On the growth and maintenance of the articular cartilage ends of adult bones. J Anat Physiol. 1878;12:503–517. [PMC free article] [PubMed] [Google Scholar]
- 11.Johnson IC. Kinetics of osteoarthritis. Lab Invest. 1958;3:1223–1238. [PubMed] [Google Scholar]
- 12.Bullough PG, Yawitz PS, Tafra L, Boskey AL. Topographical variations in the morphology and biochemistry of adult canine tibial plateau articular cartilage. J Orthop Res. 1985;3:1–16. doi: 10.1002/jor.1100030101. [DOI] [PubMed] [Google Scholar]
- 13.Hulth A. Does orthoarthrosis depend on growth of the mineralized layer of cartilage? Clini Orthop Relat Res. 1993;287:19–24. [PubMed] [Google Scholar]
- 14.Gold GE, Thedens DR, Pauly JM, Fechner KP, Bergman G, Beaulieu CF, Macovski A. MR imaging of articular cartilage of the knee: new methods using ultrashort TEs. AJR Am J Roentgenol. 1998;170:1223–1226. doi: 10.2214/ajr.170.5.9574589. [DOI] [PubMed] [Google Scholar]
- 15.Gatehouse PD, Bydder GM. Magnetic resonance imaging of short T2 components in tissues. Clin Radiol. 2003;58:1–19. doi: 10.1053/crad.2003.1157. [DOI] [PubMed] [Google Scholar]
- 16.Du J, Hamilton G, Takahashi A, Bydder M, Chung CB. Ultrashort TE spectroscopic imaging (UTESI) of cortical bone. Magn Reson Med. 2007;58:1001–1009. doi: 10.1002/mrm.21397. [DOI] [PubMed] [Google Scholar]
- 17.Du J, Takahashi A, Chung CB. Ultrashort TE spectroscopic imaging (UTESI): Application to the Imaging of Short T2 Relaxation Tissues in the Musculoskeletal System. J Magn Reson Imaging. 2009;29:412–421. doi: 10.1002/jmri.21465. [DOI] [PubMed] [Google Scholar]
- 18.Larson PE, Gurney PT, Nayak K, Gold GE, Pauly JM, Nishimura DG. Designing long-T2 suppression pulses for ultrashort echo time imaging. Magn Reson Med. 2006;56:94–103. doi: 10.1002/mrm.20926. [DOI] [PMC free article] [PubMed] [Google Scholar]
- 19.Du J, Corbeil J, Znamirowski R, Angle N, Peterson M, Bydder GM, Kahn AM. Direct imaging and quantification of carotid plaque calcification. Magn Reson Med. 2011;65:1013–1020. doi: 10.1002/mrm.22682. [DOI] [PubMed] [Google Scholar]
- 20.Du J, Takahashi AM, Bae WC, Chung CB, Bydder GM. Dual invesion recovery UTE imaging: creating high contrast for short-T2 species. Magn Reson Med. 2010;63:447–455. doi: 10.1002/mrm.22257. [DOI] [PMC free article] [PubMed] [Google Scholar]
- 21.Duvvuri U, Kudchodkar SB, Reddy R, Leigh JS. T1ρ relaxation can assess longitudinal proteoglycan loss from articular cartilage in vitro. Osteoarthritis and Cartilage. 2002;10:838–844. doi: 10.1053/joca.2002.0826. [DOI] [PubMed] [Google Scholar]
- 22.Li X, Ma B, Link TM, Castillo D, Blumenkrantz G, Lozano J, Carballido-Gamio J, Ries M, Majumdar S. In vivo T1ρ and T2 mapping of articular cartilage in osteoarthritis of the knee using 3T MRI. Osteoarthritis and Cartilage. 2007;15:789–797. doi: 10.1016/j.joca.2007.01.011. [DOI] [PMC free article] [PubMed] [Google Scholar]
- 23.Du J, Carl M, Diaz E, Takahashi A, Han E, Szeverenyi NM, Chung CB, Bydder GM. Ultrashort TE T1rho (UTE T1rho) imaging of the Achilles tendon and meniscus. Magn Reson Med. 2010;64:834–842. doi: 10.1002/mrm.22474. [DOI] [PubMed] [Google Scholar]
- 24.Gold GE, Han E, Stainsby J, Wright G, Brittain J, Beaulieu C. Musculoskeletal MRI at 3.0T: relaxation times and image contrast. Am J Roentgenol. 2004;183:343–351. doi: 10.2214/ajr.183.2.1830343. [DOI] [PubMed] [Google Scholar]
- 25.Sussman MS, Pauly JM, Wright GA. Design of practical T2-selective RF excitation (TELEX) pulses. Magn Reson Med. 1998;40:890–899. doi: 10.1002/mrm.1910400615. [DOI] [PubMed] [Google Scholar]
- 26.Xia Y, Farquhar T, Burton-Wurster N, Lust G. Origin of cartilage laminae in MRI. J Magn Reson Imaging. 1997;7:887–894. doi: 10.1002/jmri.1880070518. [DOI] [PubMed] [Google Scholar]
- 27.Du J, Statum S, Znamirowski R, Bydder GM, Chung CB. Ultrashort TE T1ρ magic angle imaging. Magn Reson Med. 2012 doi: 10.1002/mrm.24296. Epub on-line Apr 26, 2012. [DOI] [PubMed] [Google Scholar]
- 28.Buckwalter JA, Martin J. Degenerative joint disease. Clin Symp. 1995;47:1–32. [PubMed] [Google Scholar]
- 29.Recht MP, Resnick D. Magnetic resonance imaging of articular cartilage: an overview. Top Magn Reson Imaging. 1998;9:328–336. [PubMed] [Google Scholar]
- 30.Eckstein F, Charles HC, Buck RJ, Kraus VB, Remmers AE, Hudelmaier M, Wirth W, Evelhoch JL. Accuracy and precision of quantitative assessment of cartilage morphology by magnetic resonance imaging at 3.0T. Arthritis Rheum. 2005;52:3132–3136. doi: 10.1002/art.21348. [DOI] [PubMed] [Google Scholar]
- 31.Oegema TR, Carpenter RJ, Hofmeister F, Thompson RC. The interaction of the zone of calcified cartilage and subchondral bone in osteoarthritis. Microsc Res Tech. 1997;37:324–332. doi: 10.1002/(SICI)1097-0029(19970515)37:4<324::AID-JEMT7>3.0.CO;2-K. [DOI] [PubMed] [Google Scholar]
- 32.Mente PL, Lewis JL. Elastic modulus of calcified cartilage is an order of magnitude less than that of subchondral bone. J Orthopaedic Research. 1994;12:637–647. doi: 10.1002/jor.1100120506. [DOI] [PubMed] [Google Scholar]
- 33.Anderson DD, Brown TD, Radin EL. The influence of basal cartilage calcification on dynamic juxtaarticular stress transmission. Basal Cartilage Calcification. 1993;286:298–307. [PubMed] [Google Scholar]
- 34.Burr DB. Anatomy and physiology of the mineralized tissues: role in the pathogenesis of osteoarthrosis. Osteoarthritis and Cartilage. 2004;12:S20–S30. doi: 10.1016/j.joca.2003.09.016. [DOI] [PubMed] [Google Scholar]
- 35.Ferguson VL, Bushby AJ, Boyde A. Nanomechanical properties and mineral concentration in articular calcified cartilage and subchondral bone. J Anat. 2003;203:191–199. doi: 10.1046/j.1469-7580.2003.00193.x. [DOI] [PMC free article] [PubMed] [Google Scholar]
- 36.Revell PA, Pirie C, Amir G, Rashad, Walker F. Metabolic activity in the calcified zone of cartilage: observations on tetracycline labeled articular cartilage in human osteoarthritic hips. Rheumatol Int. 1990;10:143–147. doi: 10.1007/BF02274838. [DOI] [PubMed] [Google Scholar]
- 37.Miller LM, Novatt JT, Hamerman D, Carlson CS. Alternations in mineral composition observed in osteoarthritic joints of cynomolgus monkeys. Bone. 2004;35:498–506. doi: 10.1016/j.bone.2004.03.034. [DOI] [PubMed] [Google Scholar]
- 38.Williams A, Qian Y, Bear D, Chu CR. Assessing degeneration of human articular cartilage with ultra-short echo time (UTE) T2* mapping. Osteoarthritis Cartilage. 2010;18:539–546. doi: 10.1016/j.joca.2010.02.001. [DOI] [PMC free article] [PubMed] [Google Scholar]
- 39.Williams A, Qian Y, Golla S, Chu CR. UTE-T2* mapping detects sub-clinical meniscus injury after anterior cruciate ligament tear. Osteoarthritis Cartilage. 2012 doi: 10.1016/j.joca.2012.01.009. Epub on-line Jan 18, 2012. [DOI] [PMC free article] [PubMed] [Google Scholar]
- 40.Sanz-Requena R, Marti-Bonmati L, Hervas V, Veqa M, Alberich-Bayarri A, Garcia-Marti G, Carot JM. Modification of longitudinal relaxation time (T1) as a biomarker of patellar cartilage degeneration. Radiology. 2010;52:221–227. doi: 10.1016/j.rx.2010.01.012. [DOI] [PubMed] [Google Scholar]
- 41.Bae WC, Dwek JR, Znamirowski R, Statum S, Hermida JC, D'Lima DD, Sah RL, Du J, Chung CB. Ultrashort TE MRI of the osteochondral junction of the knee at 3T: identification of anatomic structures contributing to signal intensity. Radiology. 2010;254:837–845. doi: 10.1148/radiol.09081743. [DOI] [PMC free article] [PubMed] [Google Scholar]
- 42.Du J, Bydder M, Takahashi AM, Carl M, Chung CB, Bydder GM. Short T2 contrast with three-dimensional ultrashort echo time imaging. Magn Reson Imaging. 2011;29:470–482. doi: 10.1016/j.mri.2010.11.003. [DOI] [PMC free article] [PubMed] [Google Scholar]


