Abstract
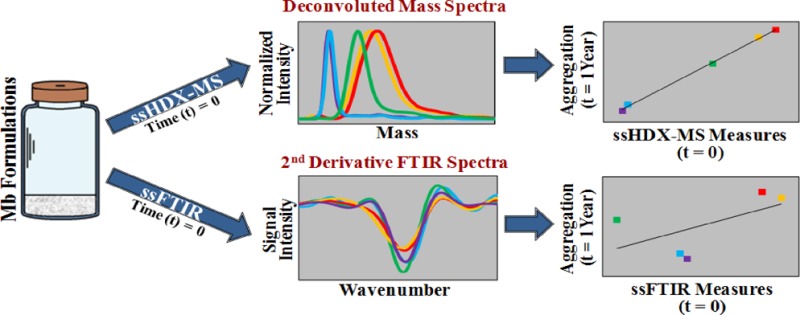
Solid state amide hydrogen/deuterium exchange with mass spectrometric analysis (ssHDX-MS) was used to assess the conformation of myoglobin (Mb) in lyophilized formulations, and the results correlated with the extent of aggregation during storage. Mb was colyophilized with sucrose (1:1 or 1:8 w/w), mannitol (1:1 w/w), or NaCl (1:1 w/w) or in the absence of excipients. Immediately after lyophilization, samples of each formulation were analyzed by ssHDX-MS and Fourier transform infrared spectroscopy (FTIR) to assess Mb conformation, and by dynamic light scattering (DLS) and size exclusion chromatography (SEC) to determine the extent of aggregation. The remaining samples were then placed on stability at 25 °C and 60% RH or 40 °C and 75% RH for up to 1 year, withdrawn at intervals, and analyzed for aggregate content by SEC and DLS. In ssHDX-MS of samples immediately after lyophilization (t = 0), Mb was less deuterated in solids containing sucrose (1:1 and 1:8 w/w) than in those containing mannitol (1:1 w/w), NaCl (1:1 w/w), or Mb alone. Deuterium uptake kinetics and peptide mass envelopes also indicated greater Mb structural perturbation in mannitol, NaCl, or Mb-alone samples at t = 0. The extent of deuterium incorporation and kinetic parameters related to rapidly and slowly exchanging amide pools (Nfast, Nslow), measured at t = 0, were highly correlated with the extent of aggregation on storage as measured by SEC. In contrast, the extent of aggregation was weakly correlated with FTIR band intensity and peak position measured at t = 0. The results support the use of ssHDX-MS as a formulation screening tool in developing lyophilized protein drug products.
Keywords: solid state hydrogen/deuterium exchange with mass spectrometric analysis (ssHDX-MS), lyophilized, myoglobin, protein stability, Fourier transform infrared spectroscopy (FTIR), size exclusion chromatography (SEC), dynamic light scattering (DLS)
Introduction
Protein drugs are often formulated as lyophilized solids to preserve their native structure and minimize the rate of degradation during storage.1 These lyophilized powders are usually amorphous rather than crystalline, a fact that has been attributed to the lyophilization process and the properties of the proteins themselves. Though high resolution methods such as X-ray crystallography and NMR spectroscopy can be used to study protein structure in solution and in crystalline solids,2−4 the methods for assessing protein structure in amorphous solids are far more limited. Vibrational spectroscopy methods such as Fourier transform infrared spectroscopy (FTIR)5 and Raman spectroscopy6 are routinely used by pharmaceutical companies to probe protein secondary structure in lyophilized powders, to assess the effects of formulation additives (“excipients”), and to design formulations. Such methods lack the structural resolution of X-ray crystallography and NMR, however, and the data are only semiquantitative.
Hydrogen–deuterium exchange with mass spectrometric analysis (HDX-MS) has been widely used to study protein structure, stability, and dynamics in solution.7,8 In HDX-MS, a protein in aqueous solution is exposed to D2O and the rate and extent of deuterium incorporation detected as a change in mass (m/z). Proteolytic digestion prior to MS analysis allows exchange to be monitored with peptide-level resolution.9−11 To preserve the sites of labeling during analysis, the reaction is usually quenched by lowering pH and temperature to inhibit the reverse reaction (“back exchange”). Together with rapid sample analysis under refrigerated conditions, this typically allows retention of label acquired by backbone amide groups,12 so that the exposure of protein sequence to D2O can be mapped. In pharmaceutical development, HDX-MS has been used to map the interactions between receptors and small molecule drugs,13 to monitor conformational changes in protein drugs mediated by post-translational modifications,14 and to compare batch-to-batch variation in developing biosimilars.15
To extend HDX-MS to lyophilized samples, our group has developed solid state hydrogen–deuterium exchange with mass spectrometric analysis (ssHDX-MS) to measure protein structure and excipient interactions in lyophilized powders with high resolution.16−19 In ssHDX-MS, lyophilized samples are exposed to D2O in the vapor phase at controlled relative humidity (RH) and temperature. Samples are reconstituted under quenched conditions and subjected to MS analysis with or without proteolytic digestion. Our previous ssHDX-MS studies have shown that proteins in lyophilized solids are protected from deuterium exchange in a manner that depends on relative humidity, position in the protein sequence, and the type and amount of excipient used.17,20 For example, when compared to HDX in solution, HDX-MS of equine myoglobin (Mb) colyophilized with sucrose showed greater protection from exchange than Mb colyophilized with mannitol,20 while samples colyophilized with guanidine hydrochloride showed greater deuterium uptake than native Mb in aqueous solution.19 When comparing different lyophilized formulations, ssHDX-MS often shows differences not detected by FTIR.20 This suggests that ssHDX-MS may be useful as a screening tool to select formulations that best preserve protein structure and so promote stability during storage. To date, however, the relationship between the solid state structural information provided by ssHDX-MS and protein stability in lyophilized powders has not been explored.
In the work reported here, we used ssHDX-MS and FTIR to monitor the effects of different excipients on the conformation of Mb in lyophilized powders, and to relate these measures of structure to Mb aggregation during 1 year (∼360 days) of storage of the lyophilized powder under controlled conditions. The results demonstrate that quantitative measures of deuterium exchange provided by ssHDX-MS are highly correlated with aggregate formation during storage and provide a better indication of the propensity for aggregation than secondary structure as measured by FTIR.
Materials and Methods
Materials
Equine myoglobin (Mb) was purchased from Sigma-Aldrich (St. Louis, MO). Mass spectrometry grade water, acetonitrile (ACN), and formic acid (FA) were from ThermoFisher Scientific (Waltham, MA). D2O was purchased from Cambridge Isotope Laboratories, Inc. (Andover, MA). Pepsin from Sigma-Aldrich was immobilized on Poros AL resin (Applied Biosystems, Foster City, CA) and packed into a high performance liquid chromatography (HPLC) column (50 × 2.1 mm, Grace Davison Discovery Sciences, Deerfield, IL). All other chemicals used were at least reagent grade and used as received.
Sample Preparation
Mb was solubilized and dialyzed thoroughly in 2.5 mM potassium phosphate buffer, pH 7.0 at 4 °C. The dialyzed Mb stock solution (6.8 mg/mL) was used to prepare the formulations shown in Table 1. The samples were filtered using Millex-GV 0.22 μm PVDF filter (Millipore, Billerica, MA) and filled as 2.2 mL into 8 mL glass vial (Nuova Ompi, Padova, Italy) using a peristaltic pump (Flexicon PF6, Flexicon, Wilmington, MA). The vials were loaded and freeze-dried in a Boc Edwards Lyophilizer (Lyomax 0.4) (Boc Edwards, Tonawanda, NY). Lyophilization was initiated by precooling the shelves to −2 °C, followed by freezing at −40 °C. Primary drying was carried out under vacuum (70 mTorr) at −35 °C for 75 h followed by secondary drying at 25 °C for 12 h and 5 °C for 12 h. All vials were backfilled with nitrogen prior to sealing. After lyophilization, the Mb formulations were analyzed for any excipient and/or lyophilization induced changes using dynamic light scattering (DLS), size exclusion chromatography (SEC), FTIR, and ssHDX-MS, as described below. The lyophilized samples were then placed on stability at 25 °C and 60% RH or 40 °C and 75% RH over a period of 1 year. Samples were withdrawn at intervals and analyzed for aggregate content by SEC and DLS as described below.
Table 1. Different Mb Formulations and the Concentration of Ingredients Used.
| formulations |
|||||
|---|---|---|---|---|---|
| ingredients | MbA | MbB | MbC | MbD | MbE |
| myoglobin (Mb) | 1.7 mg/mL, 45% w/w | 1.7 mg/mL, 45% w/w | 1.7 mg/mL, 45% w/w | 3.4 mg/mL, 90% w/w | 0.4 mg/mL, 10% w/w |
| sucrose | 1.7 mg/mL, 45% w/w | 3.0 mg/mL, 80% w/w | |||
| mannitol | 1.7 mg/mL, 45% w/w | ||||
| NaCl | 1.7 mg/mL, 45% w/w | ||||
| potassium phosphate (pH 7.0) | 0.4 mg/mL, 10% w/w | 0.4 mg/mL, 10% w/w | 0.4 mg/mL, 10% w/w | 0.4 mg/mL, 10% w/w | 0.4 mg/mL, 10% w/w |
Solid State FTIR Spectroscopy
To evaluate excipient and/or lyophilization induced secondary structural changes in Mb, FTIR spectra were acquired for MbA, MbB, MbC, MbD, and MbE (Table 1) using a Tensor 37 FTIR spectrometer (Bruker Optics, Billerica, MA). Approximately 2 mg of lyophilized protein was mounted onto the ATR germanium crystal and the data collected with 128 scans at a resolution of 4 cm–1. To avoid interference from atmospheric water vapor, the system was continuously purged under nitrogen. Background spectra collected under similar conditions were subtracted from the raw spectra acquired for each sample. Data were processed and analyzed using the OPUS software (version 6.5, Bruker Optics). The raw spectra were first cut between 1720 and 1580 cm–1 to analyze the amide I band. Spectra were smoothed using a nine-point Savitsky–Golay smoothing function, and baseline correction was carried out using the rubberband correction method with 64 baseline points. Finally, spectra were centered and min/max normalized before second derivatization was carried out. The second derivative spectra were obtained with an additional nine-point Savitsky–Golay smoothing function.
Dynamic Vapor Sorption (DVS)
To determine the rate and extent of moisture sorption by Mb formulations during ssHDX-MS, moisture sorption was measured using a gravimetric analyzer (Q5000SA; TA Instruments, New Castle, DE). Approximately 3–4 mg of Mb powder was loaded onto the platinum sample pan, and the samples were heated to 85 °C at 0% RH for 10 min to remove any moisture present before the start of the experiment. Samples were then equilibrated at 5 °C, 0% RH and exposed to 33% RH for 24 h, with sorption data collected at 4 s intervals.
ssHDX-MS for Intact Mb
To determine the rate and extent of deuterium incorporation for intact (i.e., undigested) Mb, ssHDX-MS was carried out at 5 °C by incubating the vials in a sealed desiccator containing a saturated solution of MgCl2 in D2O (33% RH over D2O). Samples were removed at six different time points over 240 h, and exchange was quenched by flash freezing the vials in liquid nitrogen, which were then stored at −80 °C until analysis. Deuterium uptake by intact Mb was measured using a high performance liquid chromatography mass spectrometer (LC/MS) (1200 series LC, 6520 qTOF; Agilent Technologies, Santa Clara, CA) equipped with a custom-built refrigeration unit which maintained the column at ∼0 °C. The samples were quickly reconstituted in chilled 0.2% formic acid (FA), and approximately 15 pmol of protein was injected onto a protein microtrap (Michrom Bioresources, Inc., Auburn, CA). Samples were desalted for 1.7 min with 15% acetonitrile, 85% water, and 0.1% FA and eluted in 2.3 min using a gradient to 90% acetonitrile, 10% water, and 0.1% FA. Mass spectra were obtained over the m/z range 200–3200, and the masses of both undeuterated and deuterated protein were obtained by deconvoluting the spectra using MassHunter Workstation Software (Version B.03.01, Agilent Technologies). To calculate the number of deuterons incorporated in intact Mb, the mass of undeuterated Mb was subtracted from the mass of deuterated Mb at each exchange time point. Using GraphPad Prism software version 5 (San Diego, CA), deuteration kinetic data for intact Mb in different formulations were fitted to a biexponential model (eq 1) which assigns deuterons to “fast” and “slow” exchanging pools, as described previously.21
| 1 |
Peak width analysis for deuterated intact Mb was carried out as described previously.22
ssHDX-MS for Mb at the Peptide Level
To determine the distribution of deuterium incorporation along the Mb sequence, deuterated Mb was subjected to proteolytic digestion with pepsin prior to MS analysis. Exchange reactions were carried out as above, the quenched sample was quickly reconstituted in chilled 0.2% formic acid (FA), and approximately 15 pmol of protein was then injected into an immobilized pepsin column. Online digestion was carried out for 2 min in water containing 0.1% FA at a flow rate of 0.2 mL/min. The digested sample was desalted in a peptide microtrap (Michrom Bioresources, Inc., Auburn, CA) and eluted using a gradient of acetonitrile (10–60%) in 0.1% FA onto a reverse phase analytical column (Zorbax 300SB-C18; Agilent Technologies) at 50 μL/min. The pepsin column, peptide microtrap, and analytical column were located within the refrigeration unit and connected through a two-position valve (EPC12CW, VICI Valco Instruments Co., Inc., Houston, TX). The time elapsed between sample reconstitution and MS analysis was 4–9 min. Mass spectra were acquired over the m/z range 100–1700. Peptides from an undeuterated Mb sample were also analyzed, and their mass was measured by MS/MS analysis (CID fragmentation; MassHunter Software; Agilent Technologies). Peptides indentified using undeuterated Mb were mapped onto subsequent deuteration experiments using prototype custom software, HDExaminer (Sierra Analytics, Modesto, CA), to obtain the average number of deuterons exchanged for each of the pepsin digest fragments. Kinetic data for deuteration of 13 nonredundant peptides were fitted to a biexponential association model (eq 1) which accounts for deuterons exchanging at “fast” and “slow” rates, as described above. Data from 48 h ssHDX-MS samples were mapped onto the crystal structure of Mb (PDB ID: 1WLA)23 using PyMOL (PyMOL Molecular Graphics System, Version 1.3, Schrodinger, LLC). Peak width analysis for the peptide mass envelopes was carried out using HX-Express software as described previously.21,24,25
Dynamic Light Scattering (DLS)
The formation of particles in the stability samples was monitored using 90° DLS (Zetasizer Nano ZS90, Malvern Instruments, Ltd., Westborough, MA). Approximately 1 mL of the reconstituted Mb sample was placed in a polystryrene cuvette (VWR) and analyzed with a path length of 10 mm at 25 °C. Triplicate samples for each formulation were recorded 3 times using an automatic mode for the selection of best number of subruns. The z-average diameter (nm) was calculated from the correlation function using the Dispersion Technology Software supplied with the instrument (Version 4.20, Malvern, Westborough MA).
High Performance Size Exclusion Chromatography (HP-SEC)
HP-SEC was used to assess the percentage loss of monomeric Mb during the stability study. An Agilent 1200 system with UV detection at 280 nm (Agilent Technologies, Palo Alto, CA) was used to monitor the loss in monomeric protein. Vials containing lyophilized Mb for each formulation were reconstituted with 2.2 mL of sterile distilled water; samples in triplicate were centrifuged (Microfuge 22R refrigerated microcentrifuge, VWR) at 14,000 rpm for 15 min to remove any insoluble protein aggregates. 25 μL aliquots were then injected onto a Tosoh TSKgel G3000SWxl column (Tosoh Bioscience LLC, King of Prussia, PA; 3000 mm × 7.8 mm) and eluted with buffer (50 mM potassium phosphate, 100 mM NaCl, pH 7.5) at a flow rate of 0.5 mL/min. The percentage loss of monomeric Mb was determined using the following equation (eq 2).
| 2 |
Results
Mb Secondary Structure by FTIR
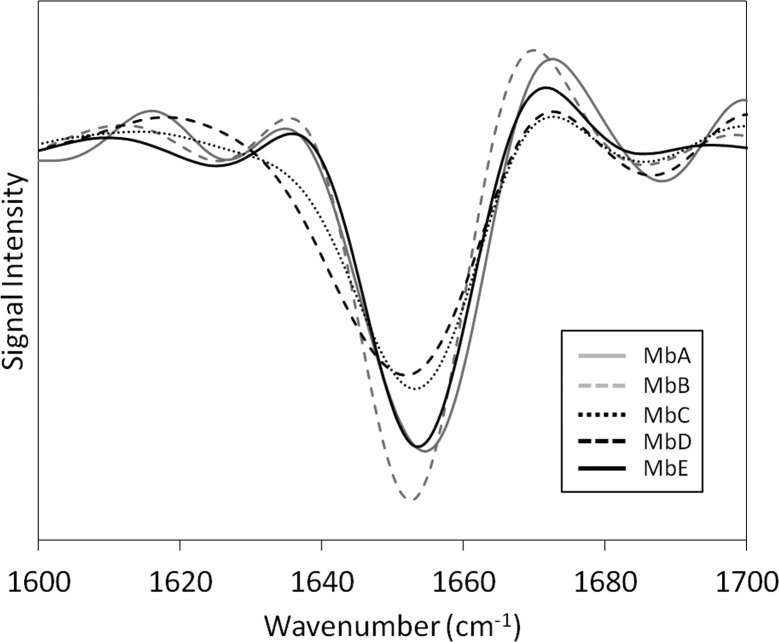
Mb secondary structure in lyophilized samples was initially characterized using FTIR. Mb is a globular protein with high (>80%) α-helix content. All second derivative FTIR spectra showed a strong α-helix band at ∼1654 cm–1. A decrease in band intensity was observed for samples MbC and MbD, suggesting reduced α-helix content for these formulations (Figure 1).
Figure 1.
Overlay of second derivative amide I FTIR spectra of Mb in formulations MbA, MbB, MbC, MbD, and MbE.
Moisture Sorption Kinetics by DVS
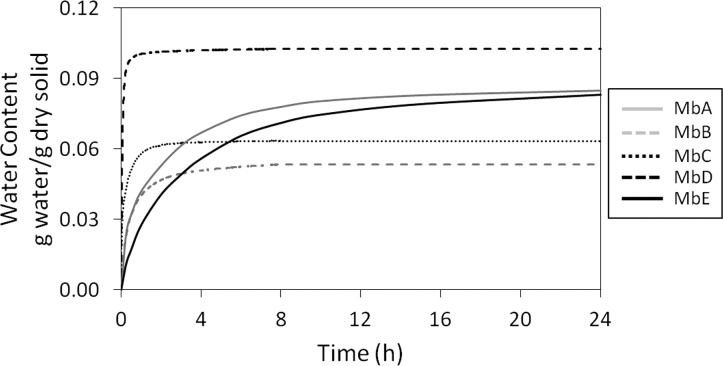
Before exchange can occur in ssHDX-MS, D2O must be sorbed by the solid matrix from the vapor phase and diffuse into the solid. The rate of moisture sorption and diffusion thus may influence the rate of exchange. The effect of hydration on HDX of Mb colyophilized with sucrose or mannitol has been extensively characterized in our previous study.20,21 The results showed that moisture sorption is complete in a period of hours while HDX continues for days, indicating that, under conditions comparable to those used here, HDX in lyophilized powders is not simply a measure of moisture sorption.21 In the work reported here, the rate of moisture uptake was measured at 5 °C, 33% RH to confirm that the rate of water vapor sorption is rapid relative to the deuterium exchange rate. The rate and extent of moisture absorption differed among the formulations (Figure 2). The formulation with Mb alone (MbD) reached its sorption maximum absorption in <1 h and sorbed more moisture (0.103 g water/g solid) than the other formulations. The formulations containing sucrose (MbA, MbE) reached their sorption maxima in ∼20 h and sorbed similar levels of moisture (0.085 and 0.083 g of water/g of solid, respectively). Formulations containing mannitol (MbB) and NaCl (MbC) sorbed the least moisture (0.053 and 0.064 g of water/g of solid, respectively) but reached equilibrium in ∼2 h. Based on these results, and since ssHDX occurs over hundreds of hours (see Figure 3 and Figure S2 in the Supporting Information), it is unlikely that vapor sorption dominates ssHDX kinetics, except at t < 24 h for samples containing sucrose (MbA, MbE).
Figure 2.
Moisture sorption kinetics for Mb formulations MbA, MbB, MbC, MbD, and MbE. Data were collected at 33% RH, 5 °C for 24 h.
Figure 3.
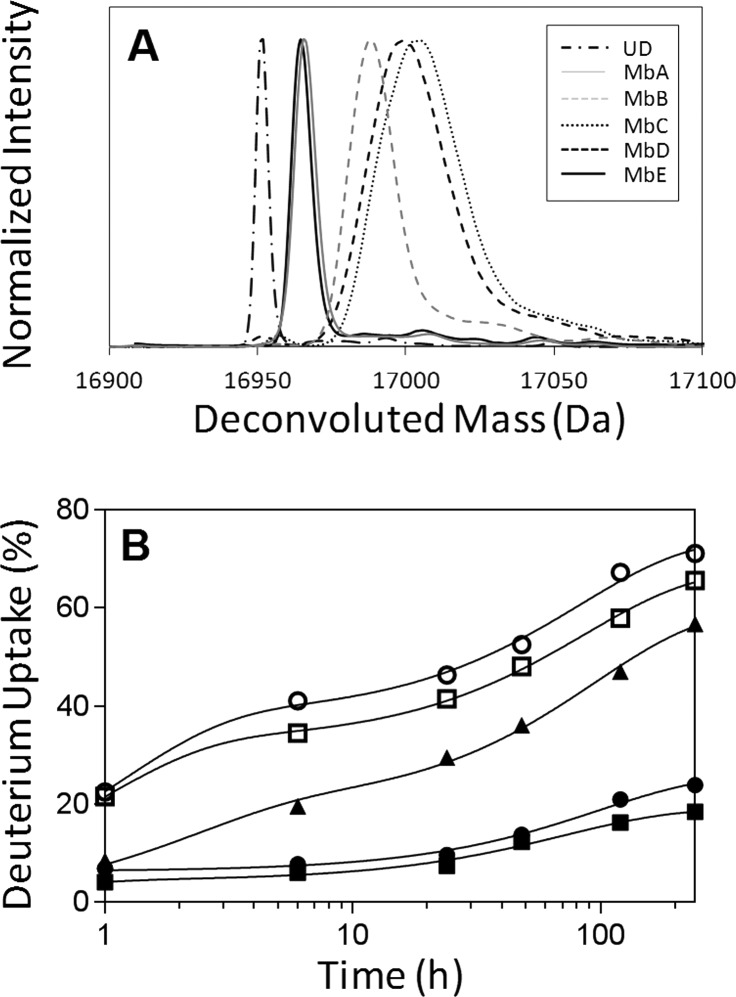
(A) Overlay of deconvoluted mass spectra of intact Mb from formulations MbA, MbB, MbC, MbD, and MbE following 48 h of deuterium exchange. UD: deconvoluted mass spectrum for undeuterated Mb. (B) Kinetics of deuterium uptake for intact Mb in formulations MbA (closed circle), MbB (closed triangle), MbC (open circle), MbD (open square), and MbE (closed square). Plots of the time course of deuterium exchange were fitted to an equation for two phase exponential association (GraphPad Prism software version 5 (San Diego, CA)) (n = 3, ±SE).
Effect of Excipients on Deuterium Uptake in Intact Mb
ssHDX-MS data were acquired for the five formulations (Table 1) at six different time points (1–240 h). Overall, MbA and MbE showed less deuterium uptake than MbB, MbC, and MbD (Table 2). Furthermore, MbE is less deuterated than MbA, indicating that the greater sucrose content in MbE provides greater protection from exchange. Formulations containing NaCl (MbC) or without excipient (MbD) showed the greatest deuterium uptake at all time points (Figure 3). The extent of deuterium uptake at 48 h (Figure 3A and Table 2) was not simply related to the extent of water vapor sorption at 24 h (Figure 2). For example, MbC showed less moisture sorption than MbD but comparable deuterium uptake. MbA and MbE (with sucrose) showed high vapor sorption yet had the greatest protection from exchange, while MbB (with mannitol) showed the lowest vapor sorption and an intermediate extent of exchange. These results are consistent with our previous ssHDX-MS study of Mb at 43% RH, in which Mb formulations with sucrose sorbed ∼25% more moisture and showed 20% less deuteration than those containing mannitol following 48 h of HDX.21
Table 2. Quantitative Measures of Deuterium Uptake in Mb Formulations.
| peak
width (Da) |
||||||
|---|---|---|---|---|---|---|
| formulationa | deuterium uptake (%)b,c | Nfastb,d | Nslowb,d | Nfast/(Nfast + Nslow) | ∼15% deuterationb,e | ∼12.5% deuterationb,e |
| MbA | 9.4 ± 0.1 | 19.6 ± 0.9 | 6.3 ± 0.4 | 0.76 ± 0.04 | 17.2 ± 0.3 | 15.4 ± 0.3 |
| MbB | 24.6 ± 0.2 | 39.8 ± 1.6 | 19.7 ± 1.4 | 0.67 ± 0.04 | 18.4 ± 0.1 | 15.8 ± 0.3 |
| MbC | 35.8 ± 0.2 | 36.0 ± 1.4 | 37.9 ± 1.1 | 0.49 ± 0.02 | 33.6 ± 1.1 | |
| MbD | 32.7 ± 0.2 | 34.8 ± 0.9 | 32.7 ± 0.6 | 0.52 ± 0.01 | 31.1 ± 0.5 | |
| MbE | 8.4 ± 0.1 | 14.6 ± 0.5 | 4.4 ± 0.3 | 0.77 ± 0.06 | 14.8 ± 0.2 | |
See Table 1 for the composition.
Values obtained from three independent ssHDX-MS experiments (mean ± SE).
Percent deuterium uptake relative to theoretical maximum by intact Mb after 48 h of HDX at 5 °C, 33% RH.
Nfast and Nslow values were determined by nonlinear regression of ssHDX-MS kinetic data. Time course of deuterium exchange for intact Mb was fitted to the two phase exponential association model (eq 1).
Peak width was measured at 20% height of the deconvoluted mass spectrum of intact Mb.
Kinetic plots of deuterium uptake for intact Mb were fitted to a biexponential model (Figure 3B). On average, the Nfast and Nslow values for MbA and MbE were less than those for MbB, MbC, and MbD (Table 2). Among the formulations, differences in the Nslow values were larger than differences in the Nfast values (Table 2). This suggests that greater Nslow values in MbB, MbC, and MbD may be due to the recruitment of amide groups that do not exchange in MbA and MbE into the slowly exchanging pool. The fraction of exchanging amide groups in the rapidly exchanging pool is expressed in the ratio Nfast/(Nfast + Nslow) (Table 2), which provides another measure of the distribution between the two pools.
Effect of Excipients on Deuterium Uptake at the Peptide Level
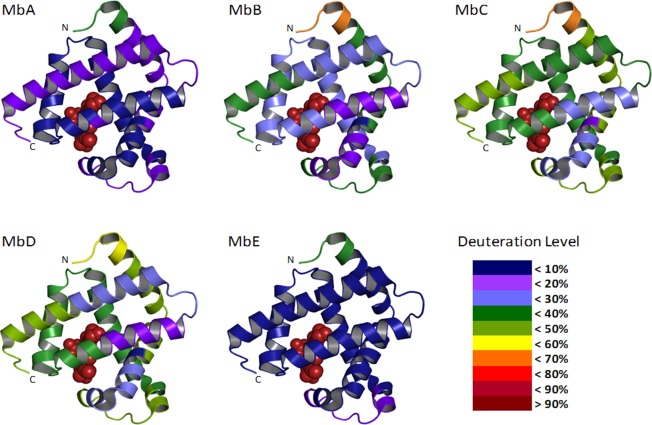
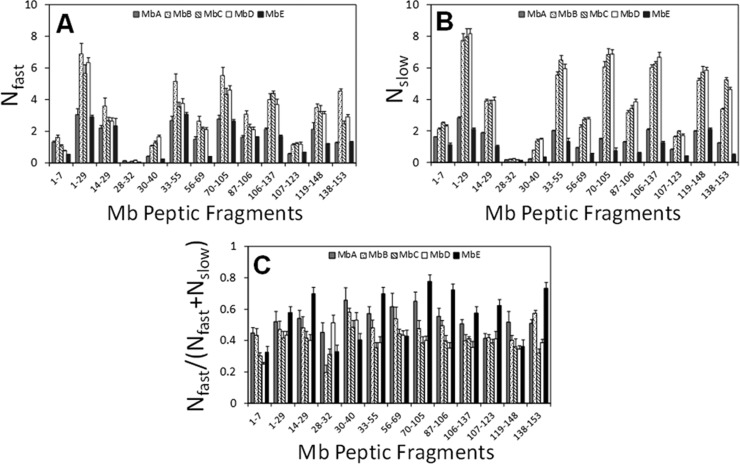
A total of 41 fragments were identified; from these, a nonredundant set of 13 fragments covering 100% of the Mb sequence was selected for analysis (Figure S1 in the Supporting Information). The average number of deuterons exchanged for each peptide was calculated, and the results from 48 h samples were mapped onto the crystal structure of Mb (PDB ID: 1WLA) (Figure 4). The kinetics of deuterium uptake for the 13 nonredundant peptic fragments showed biexponential behavior (Figure S2 in the Supporting Information), consistent with subpopulations of amide groups undergoing “fast” and “slow” exchange. The number of amides in the “fast” and “slow” pools, Nfast and Nslow, varied with formulation and in different regions of the Mb molecule (Figure 5). Overall, the Nfast and the Nslow values for most of the peptides in formulations MbB, MbC, and MbD were greater than those in MbA and MbE, with the differences in the Nslow values somewhat greater than differences in the Nfast values (Figure 5A,B).
Figure 4.
Crystal structures of holo-Mb (PDB ID: 1WLA) showing the percent deuterium uptake for Mb in formulations MbA, MbB, MbC, MbD, and MbE following 48 h of deuterium exchange. ssHDX-MS data from 13 nonredundant pepsin digest fragments were mapped onto the structure. The heme group in holo-Mb is shown in brown spheres; color coding for deuteration level is as per legend key indicated.
Figure 5.
Comparison of Nfast (A), Nslow (B), and Nfast/(Nfast + Nslow) (C) values for Mb in formulations MbA, MbB, MbC, MbD, and MbE. Values were obtained from nonlinear regression of ssHDX-MS kinetic data for 13 nonredundant peptic peptides (n = 3, ±SE).
The ssHDX-MS kinetic data also differed in sucrose formulations having different concentrations of excipient (MbA, MbE). Nfast values for peptides 1–29, 14–29, 28–32, 33–55, 70–105, 87–106, 106–137, 107–123, and 138–153 in formulations MbA and MbE showed slight or no differences, whereas Nslow values were generally smaller in MbE than in MbA. Similarly, values of the Nfast/(Nfast + Nslow) ratio were greater for these peptides in MbE (Figure 5C). For regions spanning residues, 1–7, 30–40, 56–69, and 119–148, the Nfast values for MbA were greater than for MbE, and Nfast/(Nfast + Nslow) values were smaller. Together, the results suggest that these regions in MbE are more rigid or folded than in MbA.
Peak Width Determination for Deuterated Mb
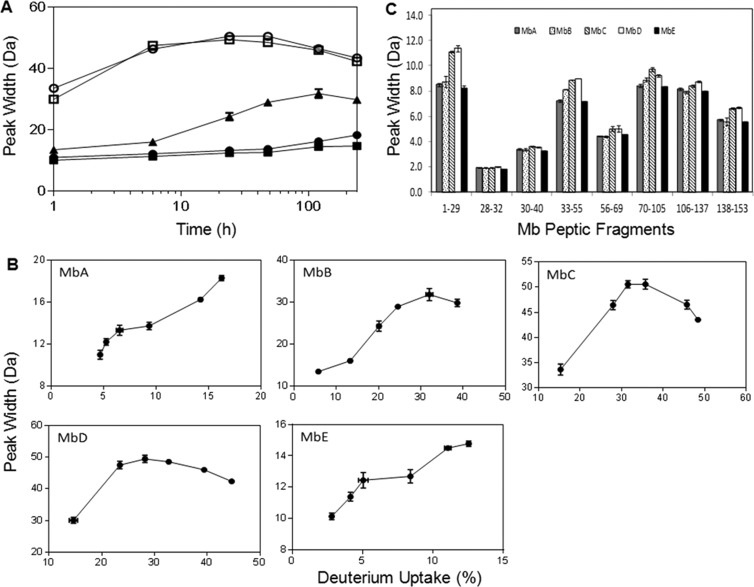
In ssHDX-MS, a comparison of peak widths at a similar level of deuteration is expected to provide information on differences in the spatial and/or conformational heterogeneity of proteins in solid samples.20,21 For intact Mb, peak width steadily increased with time for formulations MbB, MbC, and MbD but showed smaller increases in MbA and MbE (Figure 6A). To establish a level of deuterium uptake for comparing different formulations, peak width was plotted against percentage deuterium uptake (Figure 6B), and 15% deuterium incorporation was selected for comparison. Since this value is greater than the maximum deuterium uptake observed in MbE, it was omitted from the comparison (Figure 6B). At ∼15% deuterium uptake, MbC and MbD showed ∼2-fold greater peak width than formulations MbA and MbB, and MbB showed slightly greater peak width (∼1.2 Da) than MbA (Table 2). Thus, peak width analysis in intact Mb suggests that protein in MbA retained a greater degree of native structure and/or was more homogeneous than in MbB, MbC, or MbD.
Figure 6.
(A) Peak width broadening for intact deuterated Mb as a function of time. Peak width at 20% height of the deconvoluted mass spectrum was measured for formulations MbA (closed circle), MbB (closed triangle), MbC (open circle), MbD (open square), and MbE (closed square). (B) Peak width broadening in formulations MbA, MbB, MbC, MbD, and MbE with differing levels of deuterium uptake (n = 3, ±SE). (C) Comparison of peak width for 8 nonredundant peptic peptides obtained from Mb in MbA, MbB, MbC, MbD, and MbE at similar deuteration level. Peak with at 20% peak height was plotted for residues 1–29 at 15.1%, 28–32 at 6.2%, 30–40 at 6.1%, 33–55 at 17.2%, 56–69 at 7.9%, 70–105 at 9.3%, 106–137 at 10.0%, and 138–153 at 12.5% deuteration (n = 3, ±SE).
Peak width analysis was also carried out for the peptic peptides from Mb using HX-Express software. The eight nonredundant peptides were analyzed for peak width to represent the distribution of conformations of Mb within the solid matrix. The extent of deuteration of the eight peptides of MbE at 240 h, relative to the theoretical maximum, were as follows: residues 1–29, 15.1%; residues 28–32, 6.2%; residues 30–40, 6.1%, residues 33–55, 17.2%; residues 56–69, 7.9%; residues 70–105, 9.3%; residues 106–137, 10.0%; and residues 138–153, 12.5%. Peak widths for the remaining formulations were compared at an extent of deuteration equal to the value for that peptide in MbE at 240 h. The increase in peak width and its differences among formulations are region specific (Figure 6C and Figures S3 and S4 in the Supporting Information). For formulations MbC and MbD, the N-terminal region (residues 1–29) showed a greater peak width (∼2.5 Da) for formulations MbC and MbD than for the remaining formulations. The region spanning residues 33–55 showed greater peak widths (∼2.0 Da) for MbC and MbD (∼2.0 Da) and for MbB (∼1.0 Da). Other regions (i.e., 56–69, 70–105, 106–137, and 138–153) also showed greater peak widths for MbC and MbD, and to a lesser extent for MbB, though the magnitude of the effect is not as large. These results are consistent with a greater distribution of conformations in MbB, MbC, and MbD, particularly in domains 1–29 and 33–55.
Effect of Excipients on Mb Stability during Long-Term Storage
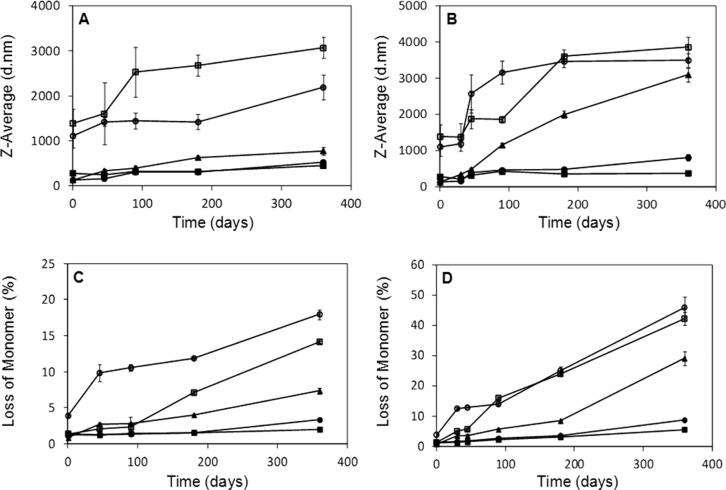
The stability of the Mb formulations during long-term storage was characterized using DLS and HP-SEC, which monitor subvisible particles and loss of monomeric protein, respectively. For DLS analysis, the lyophilized samples were reconstituted in sterile distilled water and analyzed with a Zetasizer Nano ZS90 (Malvern Instruments, Ltd., Westborough, MA). The reconstituted lyophilized samples showed an increase in particle size relative to the prelyophilized controls, with the largest particle sizes observed in MbC and MbD (Figure S5 in the Supporting Information, t = 0). During storage at 25 and 40 °C, particle size increased with time for formulations MbC and MbD at both temperatures. MbA, MbB, and MbE showed a slight increase in particle size over time (Figures 7A and 7B).
Figure 7.
Mb aggregation in lyophilized formulations during stability study, as monitored using DLS and HP-SEC. The increase in particle size for formulations stored at 25 °C (A) and 40 °C (B) and the percentage loss of monomeric Mb for formulations stored at 25 °C (C) and 40 °C (D) were plotted against time (n = 3, ±SE). MbA (closed circle), MbB (closed triangle), MbC (open circle), MbD (open square), and MbE (closed square).
The effects of excipients on lyophilization-induced aggregation were also characterized using HP-SEC. Lyophilized samples were reconstituted with sterile distilled water and subjected to HP-SEC, and the chromatographic peak area was used to calculate the loss of monomeric Mb. At t = 0 (i.e., immediately after lyophilization and reconstitution), the percent loss of Mb in formulations MbA, MbB, MbC, MbD, and MbE was 1.3 ± 0.1, 0.8 ± 0.1, 4 ± 0.3, 1.4 ± 0.1, and 1.3 ± 0.2%, respectively. To assess the effect of excipients on Mb stability during storage, the lyophilized Mb formulations were placed at 25 and 40 °C for a period of 360 days and evaluated at regular intervals. The rate of loss of monomeric protein was greatest for MbC at 25 °C and for MbB, MbC, and MbD at 40 °C (Figures 7C and 7D). At both temperatures, the rate of aggregate formation was slowest in MbA and MbE and the loss of monomeric Mb for these samples after 360 days was less than 4%.
Correlation of ssHDX-MS Results with Mb Stability on Storage
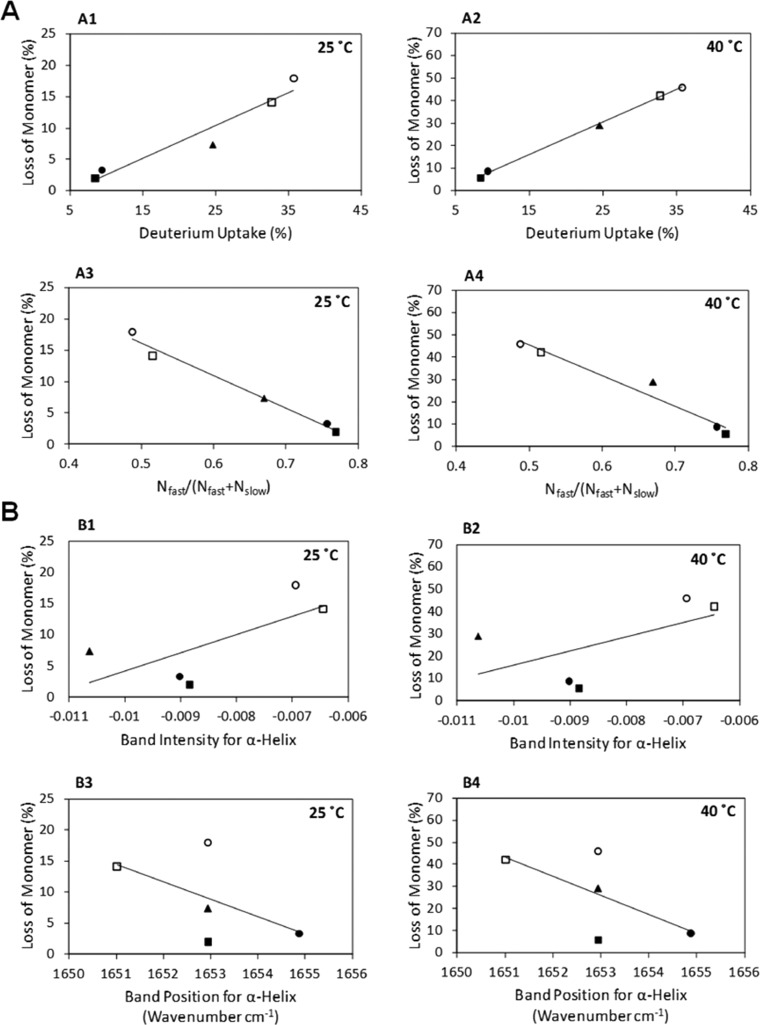
To evaluate ssHDX-MS as a potential screening tool for lyophilized formulations, we correlated quantitative measures of deuterium exchange in freshly lyophilized formulations (t = 0) to the extent of aggregation during 6 months and 1 year of storage as measured by HP-SEC. The quantitative measures of exchange were as follows: (i) deuterium uptake in intact Mb after 48 h D2O exposure; and (ii) Nfast/(Nfast + Nslow) values determined by nonlinear regression of HDX kinetic data (eq 1) for intact Mb. The extent of aggregation was also correlated with secondary structure in freshly lyophilized samples as measured by α-helix band intensity and peak position in FTIR (Figures 8B1–8B4 and Figures S6B1–S6B4 in the Supporting Information). For both 25 and 40 °C stability samples, the percent loss of Mb monomer after 180 and 360 days increased monotonically with the percent deuterium uptake as measured by ssHDX-MS at t = 0 (Figures 8A1 and 8A2 and Figures S6A1 and S6A2 in the Supporting Information) (Table 3 and Table S1 in the Supporting Information), and decreased monotonically with Nfast/(Nfast + Nslow) (Figures 8A3 and 8A4 and Figures S6A3 and S6A4 in the Supporting Information) (Table 3 and Table S1 in the Supporting Information). In contrast, correlation of aggregation during storage with FTIR measures of secondary structure was poor (Figures 8B1–8B4 and Figures S6B1–S6B4 in the Supporting Information) (Table 3 and Table S1 in the Supporting Information).
Figure 8.
Correlation of Mb aggregation during long-term storage (at t = 360 days) with t = 0 ssHDX-MS (A) and FTIR (B) analysis. The percent loss of Mb monomer after 360 days of storage at 25 and 40 °C as a function of percent deuterium uptake (A1 and A2), Nfast/(Nfast + Nslow) (A3 and A4), band intensity for α-helix (B1 and B2), and band position for α-helix (B3 and B4) in formulations, MbA (closed circle), MbB (closed triangle), MbC (open circle), MbD (open square), and MbE (closed square) (n = 3, ±SE). The data were subjected to linear regression to obtain slope, intercept, and R2 values (see Table 3).
Table 3. Parameters Obtained from the Correlation of t = 0 ssHDX-MS and FTIR Results with the Percent Loss Mb at t = 360 days.
| parametersb |
|||
|---|---|---|---|
| figure no.a | slope | intercept | R2 |
| 8A1 | 0.52 ± 0.08 | –2.58 ± 2.04 | 0.9308 |
| 8A2 | 1.44 ± 0.04 | –5.80 ± 0.86 | 0.9983 |
| 8A3 | –51.77 ± 3.82 | 42.05 ± 2.48 | 0.9839 |
| 8A4 | –137.28 ± 17.14 | 114.11 ± 11.15 | 0.9553 |
| 8B1 | 2907.09 ± 1645.83 | 33.29 ± 14.01 | 0.5098 |
| 8B2 | 6385.00 ± 5141.23 | 79.78 ± 43.76 | 0.3396 |
| 8B3 | –2.80 ± 2.40 | 4635.72 ± 4020.45 | 0.3063 |
| 8B4 | –8.66 ± 6.06 | 14349.26 ± 10018.47 | 0.4052 |
Refer to Figure 8 for storage conditions and variables used.
Parameters ± SE determined by linear fit of values obtained from FTIR and HDX-MS experiments at t = 0 against Mb aggregation at t = 360 days.
Discussion
Lyophilization is often used in an attempt to inhibit aggregation and other types of degradation in protein drug products. Though it is often helpful in this regard, aggregates have nevertheless been observed in lyophilized solids.26−28 In general, the extent of aggregation depends on the composition of the solid29−31 and on lyophilization process variables,32−34 with optimal formulation and processing conditions varying from protein to protein. To develop lyophilized protein drug products in a rational way, the rates of degradation should be correlated to measurable properties of the formulation. Identifying such properties would enable a formulation to be designed to achieve desired performance, rather than developed by trial-and-error in stability studies requiring months or years to complete. To date, consensus has not been reached on the properties that control degradation in lyophilized solids, however. There have been a number of attempts to correlate protein stability in the solid state with properties such as glass transition temperature (Tg),35 moisture content,36 free volume measurement by gas pycnometry,37 protein secondary structure as measured by FTIR,35,38−41 and fast local dynamics measured using neutron scattering,38,39 which have met with varying degrees of success. For example, though FTIR measures of secondary structure correlated well with long-term storage stability in some studies,39,41 others have reported a weak35,38 or unsuccessful40 correlation. A limitation common to these approaches is that they rely on bulk properties of the matrix and/or population averaged properties of protein molecule. Since protein instability is driven by changes occurring at the molecular or functional group scale, bulk methods may lack sufficient resolution to monitor the relevant molecular environment. The spatial and dynamic heterogeneities of amorphous solids42−44 further complicate the picture.
To address the need for molecular-scale characterization of proteins in lyophilized solids, our group has developed ssHDX-MS to assess protein conformation and excipient interactions in the solid state with peptide-level resolution.16−21 In the current study, we used ssHDX-MS to correlate protein conformation in solid samples with the extent of aggregation during long-term storage. Five different Mb formulations were produced and characterized for process- or formulation-induced structural changes prior to evaluating long-term storage stability. The studies tested the hypothesis that quantitative measures of protein conformation provided by ssHDX-MS are correlated with the extent of Mb aggregation during storage, and that the correlation is superior to those based on FTIR peak intensity or position.
Initial characterization of solid samples using FTIR showed retention of α-helix band intensity in formulations MbA, MbB, and MbE, reflecting a high degree of native structure, while decreased band intensity in MbC and MbD indicated structural perturbation. These results suggest that formulations with sucrose (MbA and MbE) or mannitol (MbB) are likely to be more stable. FTIR spectra did not reveal differences among formulations MbA, MbB, and MbE at t = 0, however, though the three formulations showed different levels of aggregation on stability. In addition, the extent of aggregation was poorly correlated to quantitative measures of secondary structure (i.e., peak intensity, peak position) obtained from FTIR spectra (Figures 8B1–8B4).
In contrast, ssHDX-MS provided quantitative measures of protein conformation that were highly correlated with the extent of aggregation during storage. In ssHDX-MS analysis, Mb in formulations MbB, MbC, and MbD showed greater deuterium uptake throughout the molecule than formulations containing sucrose (MbA, MbE) (Figures 3–5). Formulations that were indistinguishable by FTIR (MbA, MbB, MbE; Figure 1) showed measurable differences in the extent of ssHDX in intact Mb after 48 h of D2O exposure (Figures 3A and 4), which were highly correlated with aggregation during storage (Figures 8A1 and 8A2). Studies of ssHDX kinetics allowed the number of amide groups in rapidly and slowly exchanging pools to be quantified (Nfast, Nslow; Table 2). While a definitive structural assignment of the Nfast and Nslow pools cannot be made, it is reasonable to expect that the Nslow amide groups correspond to regions that are protected from exchange, either through folding of Mb or through interactions with the solid matrix. In contrast, the Nfast amides are expected to be present on the surface of protein molecule or to have limited interaction with the matrix. The fraction in the rapidly exchanging pool (Nfast/(Nfast + Nslow)) was also highly correlated with the extent of aggregation on storage (Figures 8A3 and 8A4). Thus, the results of these studies support the hypothesis that ssHDX-MS results are correlated with the extent of Mb aggregation during storage, and that the correlation is superior to those based on FTIR peak intensity or position. Previous studies in solution have shown that cold-unfolded Mb retains a significant amount of secondary structure and easily aggregates at moderate temperatures through partially unfolded forms.45 If partial unfolding is also involved in Mb aggregation in the lyophilized samples studied here, ssHDX-MS may be superior to FTIR as a measure of aggregation potential because it can detect partial unfolding when secondary structure is largely retained. However, it should be noted that the results presented here cannot justify the poor correlation observed in earlier FTIR studies,35,38,40 since protein formulations and experimental conditions used in those studies differ.
With pepsin digestion, ssHDX-MS provided additional, higher resolution information on the effects of formulation on Mb conformation and stability. Data from the digests show that portions of the Mb B-C helices (fragments 28–32, 30–40) and G helix (fragment 107–123) are relatively unaffected by solid composition and show low deuterium uptake in all five formulations (Figures 4, 5). In solution at low pH and temperature, Mb forms an equilibrium molten globule involving helices A, G, and H, together with part of the B helix; the molten globule is thought to be an intermediate on the Mb folding pathway.46 That the regions most protected from exchange in lyophilized samples correspond to the equilibrium molten globule suggests that this domain is folded in all five lyophilized formulations, and that formulation primarily affects folding in other Mb domains. Interestingly, residues 1–7 from the N-terminus (A helix) and residues 138–153 from the C-terminus (H helix) are less protected from exchange in solid samples than other helices in the equilibrium molten globule (Figures 4 and 5), though the reasons for this are not clear. Whether the heme group is intact in the lyophilized samples is also unclear, since it is not retained during LC/MS analysis and patterns of exchange near the heme pocket are not conclusive (Figure 4). Nevertheless, the results demonstrate that high resolution structural information can be obtained for proteins in lyophilized solids using ssHDX-MS.
Together, the results support the use of ssHDX-MS as a screening tool in developing stable lyophilized formulations of protein drugs. The ssHDX-MS studies reported here were completed in 48 h; with sample preparation and data analysis, the process required 7–10 days in total. In room temperature (25 °C) stability studies, differences among the formulations became clear only after 180 days (6 months) of storage (Figure 7C,D). Accelerated (40 °C) stability data at earlier time points were not indicative of the ultimate rank-ordered performance of the formulations at room temperature (Figure 7C,D). Though Mb is a well-characterized protein, ssHDX-MS can also be applied to new and incompletely characterized proteins if the amino acid sequence is known. While we have used the known X-ray crystal structure of Mb to map the sites of exchange in the solid state, ssHDX-MS can be applied as a stand-alone method in the absence of detailed structural information. In fact, the results presented here demonstrate that storage stability is highly correlated with the extent of HDX in the intact protein, data apart from other structural characterization. The strong correlation of solid stability with ssHDX-MS results reported here supports its wider adoption. However, establishing the utility of ssHDX-MS as a formulation tool will ultimately require that it be applied to many proteins and formulations.
Conclusions
ssHDX-MS provided quantitative measures of the conformation of Mb in lyophilized solids which were highly correlated to aggregation during 6 months and 1 year of storage in the solid state. In contrast, spectral band intensity and position as measured by FTIR in lyophilized solids was poorly correlated with aggregation during storage. The results support the use of ssHDX-MS as a rapid screening tool to predict the propensity for aggregation during storage and to discriminate among candidate formulations.
Acknowledgments
The authors gratefully acknowledge financial support from Abbott Laboratories, North Chicago, IL (now AbbVie, Inc.), and from NIH R01 GM085293 (P.I. E. Topp). The authors also acknowledge helpful discussions with Dr. Alina Alexeenko and Arnab Ganguly, School of Aeronautics and Astronautics, Purdue University, West Lafayette, IN.
Supporting Information Available
Additional figures and tables. This material is available free of charge via the Internet at http://pubs.acs.org.
The authors declare the following competing financial interest(s): Moorthy BS and Topp EM are employees of Purdue University and have received funding from AbbVie for this research. Schultz SG and Kim SG are employees of AbbVie. The design, study conduct, and financial support for the study were provided in part by AbbVie. AbbVie participated in the interpretation of data, review, and approval of the publication.
Funding Statement
National Institutes of Health, United States
Supplementary Material
References
- Carpenter J. F.; Chang B. S.; Garzon-Rodriguez W.; Randolph T. W. Rational design of stable lyophilized protein formulations: theory and practice. Pharm. Biotechnol. 2002, 13, 109–33. [DOI] [PubMed] [Google Scholar]
- Smyth M. S.; Martin J. H. x Ray crystallography. Mol. Pathol. 2000, 5318–14. [DOI] [PMC free article] [PubMed] [Google Scholar]
- Wüthrich K. Protein structure determination in solution by NMR spectroscopy. J. Biol. Chem. 1990, 2653622059–62. [PubMed] [Google Scholar]
- Brünger A. T. X-ray crystallography and NMR reveal complementary views of structure and dynamics. Nat. Struct. Biol. 1997, 4 Suppl, 862–5. [PubMed] [Google Scholar]
- Manning M. C. Use of infrared spectroscopy to monitor protein structure and stability. Expert Rev. Proteomics 2005, 25731–43. [DOI] [PubMed] [Google Scholar]
- Grohganz H.; Gildemyn D.; Skibsted E.; Flink J. M.; Rantanen J. Rapid solid-state analysis of freeze-dried protein formulations using NIR and Raman spectroscopies. J. Pharm. Sci. 2011, 10072871–5. [DOI] [PubMed] [Google Scholar]
- Tsutsui Y.; Wintrode P. L. Hydrogen/deuterium exchange-mass spectrometry: a powerful tool for probing protein structure, dynamics and interactions. Curr. Med. Chem. 2007, 14222344–58. [DOI] [PubMed] [Google Scholar]
- Konermann L.; Pan J.; Liu Y. H. Hydrogen exchange mass spectrometry for studying protein structure and dynamics. Chem. Soc. Rev. 2011, 4031224–34. [DOI] [PubMed] [Google Scholar]
- Rosa J. J.; Richards F. M. An experimental procedure for increasing the structural resolution of chemical hydrogen-exchange measurements on proteins: application to ribonuclease S peptide. J. Mol. Biol. 1979, 1333399–416. [DOI] [PubMed] [Google Scholar]
- Engen J. R.; Smith D. L. Investigating the higher order structure of proteins. Hydrogen exchange, proteolytic fragmentation, and mass spectrometry. Methods Mol. Biol. 2000, 146, 95–112. [DOI] [PubMed] [Google Scholar]
- Woods V. L.; Hamuro Y. High resolution, high-throughput amide deuterium exchange-mass spectrometry (DXMS) determination of protein binding site structure and dynamics: utility in pharmaceutical design. J. Cell. Biochem. Suppl. 2001, Suppl 37, 89–98. [DOI] [PubMed] [Google Scholar]
- Keppel T. R.; Jacques M. E.; Young R. W.; Ratzlaff K. L.; Weis D. D. An efficient and inexpensive refrigerated LC system for H/D exchange mass spectrometry. J. Am. Soc. Mass Spectrom. 2011, 2281472–6. [DOI] [PubMed] [Google Scholar]
- Pacholarz K. J.; Garlish R. A.; Taylor R. J.; Barran P. E. Mass spectrometry based tools to investigate protein-ligand interactions for drug discovery. Chem. Soc. Rev. 2012, 41114335–55. [DOI] [PubMed] [Google Scholar]
- Houde D.; Peng Y.; Berkowitz S. A.; Engen J. R. Post-translational modifications differentially affect IgG1 conformation and receptor binding. Mol. Cell. Proteomics 2010, 981716–28. [DOI] [PMC free article] [PubMed] [Google Scholar]
- Houde D.; Berkowitz S. A.; Engen J. R. The utility of hydrogen/deuterium exchange mass spectrometry in biopharmaceutical comparability studies. J. Pharm. Sci. 2011, 10062071–86. [DOI] [PMC free article] [PubMed] [Google Scholar]
- Li Y.; Williams T. D.; Schowen R. L.; Topp E. M. Characterizing protein structure in amorphous solids using hydrogen/deuterium exchange with mass spectrometry. Anal. Biochem. 2007, 366118–28. [DOI] [PubMed] [Google Scholar]
- Li Y.; Williams T. D.; Schowen R. L.; Topp E. M. Trehalose and calcium exert site-specific effects on calmodulin conformation in amorphous solids. Biotechnol. Bioeng. 2007, 9761650–3. [DOI] [PubMed] [Google Scholar]
- Li Y.; Williams T. D.; Topp E. M. Effects of excipients on protein conformation in lyophilized solids by hydrogen/deuterium exchange mass spectrometry. Pharm. Res. 2008, 252259–67. [DOI] [PubMed] [Google Scholar]
- Sinha S.; Li Y.; Williams T. D.; Topp E. M. Protein conformation in amorphous solids by FTIR and by hydrogen/deuterium exchange with mass spectrometry. Biophys. J. 2008, 95125951–61. [DOI] [PMC free article] [PubMed] [Google Scholar]
- Sophocleous A. M.; Zhang J.; Topp E. M. Localized hydration in lyophilized myoglobin by hydrogen-deuterium exchange mass spectrometry. 1. Exchange mapping. Mol. Pharm. 2012, 94718–26. [DOI] [PMC free article] [PubMed] [Google Scholar]
- Sophocleous A. M.; Topp E. M. Localized hydration in lyophilized myoglobin by hydrogen-deuterium exchange mass spectrometry. 2. Exchange kinetics. Mol. Pharmaceutics 2012, 94727–33. [DOI] [PMC free article] [PubMed] [Google Scholar]
- Weis D. D.; Wales T. E.; Engen J. R.; Hotchko M.; Ten Eyck L. F. Identification and characterization of EX1 kinetics in H/D exchange mass spectrometry by peak width analysis. J. Am. Soc. Mass Spectrom. 2006, 17111498–509. [DOI] [PubMed] [Google Scholar]
- Maurus R.; Overall C. M.; Bogumil R.; Luo Y.; Mauk A. G.; Smith M.; Brayer G. D. A myoglobin variant with a polar substitution in a conserved hydrophobic cluster in the heme binding pocket. Biochim. Biophys. Acta 1997, 134111–13. [DOI] [PubMed] [Google Scholar]
- Weis D. D.; Engen J. R.; Kass I. J. Semi-automated data processing of hydrogen exchange mass spectra using HX-Express. J. Am. Soc. Mass Spectrom. 2006, 17121700–3. [DOI] [PubMed] [Google Scholar]
- Houde D.; Arndt J.; Domeier W.; Berkowitz S.; Engen J. R. Characterization of IgG1 Conformation and Conformational Dynamics by Hydrogen/Deuterium Exchange Mass Spectrometry. Anal. Chem. 2009, 81145966. [DOI] [PubMed] [Google Scholar]
- Liu W. R.; Langer R.; Klibanov A. M. Moisture-induced aggregation of lyophilized proteins in the solid state. Biotechnol. Bioeng. 1991, 372177–84. [DOI] [PubMed] [Google Scholar]
- Costantino H. R.; Langer R.; Klibanov A. M. Solid-phase aggregation of proteins under pharmaceutically relevant conditions. J. Pharm. Sci. 1994, 83121662–9. [DOI] [PubMed] [Google Scholar]
- Costantino H. R.; Schwendeman S. P.; Langer R.; Klibanov A. M. Deterioration of lyophilized pharmaceutical proteins. Biochemistry (Moscow) 1998, 633357–63. [PubMed] [Google Scholar]
- Park J.; Nagapudi K.; Vergara C.; Ramachander R.; Laurence J. S.; Krishnan S. Effect of pH and Excipients on Structure, Dynamics, and Long-Term Stability of a Model IgG1Monoclonal Antibody upon Freeze-Drying. Pharm. Res. 2013, 304968–84. [DOI] [PubMed] [Google Scholar]
- Andya J. D.; Hsu C. C.; Shire S. J. Mechanisms of aggregate formation and carbohydrate excipient stabilization of lyophilized humanized monoclonal antibody formulations. AAPS PharmSci 2003, 52E10. [DOI] [PMC free article] [PubMed] [Google Scholar]
- Costantino H. R.; Carrasquillo K. G.; Cordero R. A.; Mumenthaler M.; Hsu C. C.; Griebenow K. Effect of excipients on the stability and structure of lyophilized recombinant human growth hormone. J. Pharm. Sci. 1998, 87111412–20. [DOI] [PubMed] [Google Scholar]
- Dong A.; Prestrelski S. J.; Allison S. D.; Carpenter J. F. Infrared spectroscopic studies of lyophilization- and temperature-induced protein aggregation. J. Pharm. Sci. 1995, 844415–24. [DOI] [PubMed] [Google Scholar]
- Wang W. Lyophilization and development of solid protein pharmaceuticals. Int. J. Pharm. 2000, 2031–21–60. [DOI] [PubMed] [Google Scholar]
- Sarciaux J. M.; Mansour S.; Hageman M. J.; Nail S. L. Effects of buffer composition and processing conditions on aggregation of bovine IgG during freeze-drying. J. Pharm. Sci. 1999, 88121354–61. [DOI] [PubMed] [Google Scholar]
- Pikal M. J.; Rigsbee D.; Roy M. L.; Galreath D.; Kovach K. J.; Wang B.; Carpenter J. F.; Cicerone M. T. Solid state chemistry of proteins: II. The correlation of storage stability of freeze-dried human growth hormone (hGH) with structure and dynamics in the glassy solid. J. Pharm. Sci. 2008, 97125106–21. [DOI] [PubMed] [Google Scholar]
- Flores-Fernández G. M.; Solá R. J.; Griebenow K. The relation between moisture-induced aggregation and structural changes in lyophilized insulin. J. Pharm. Pharmacol. 2009, 61111555–61. [DOI] [PubMed] [Google Scholar]
- Kikuchi T.; Wang B. S.; Pikal M. J. High-precision absolute (true) density measurements on hygroscopic powders by gas pycnometry: application to determining effects of formulation and process on free volume of lyophilized products. J. Pharm. Sci. 2011, 10072945–51. [DOI] [PubMed] [Google Scholar]
- Wang B.; Tchessalov S.; Cicerone M. T.; Warne N. W.; Pikal M. J. Impact of sucrose level on storage stability of proteins in freeze-dried solids: II. Correlation of aggregation rate with protein structure and molecular mobility. J. Pharm. Sci. 2009, 9893145–66. [DOI] [PubMed] [Google Scholar]
- Abdul-Fattah A. M.; Truong-Le V.; Yee L.; Nguyen L.; Kalonia D. S.; Cicerone M. T.; Pikal M. J. Drying-induced variations in physico-chemical properties of amorphous pharmaceuticals and their impact on stability (I): stability of a monoclonal antibody. J. Pharm. Sci. 2007, 9681983–2008. [DOI] [PubMed] [Google Scholar]
- Schüle S.; Friess W.; Bechtold-Peters K.; Garidel P. Conformational analysis of protein secondary structure during spray-drying of antibody/mannitol formulations. Eur. J. Pharm. Biopharm. 2007, 6511–9. [DOI] [PubMed] [Google Scholar]
- Chang L.; Shepherd D.; Sun J.; Ouellette D.; Grant K. L.; Tang X. C.; Pikal M. J. Mechanism of protein stabilization by sugars during freeze-drying and storage: native structure preservation, specific interaction, and/or immobilization in a glassy matrix?. J. Pharm. Sci. 2005, 9471427–44. [DOI] [PubMed] [Google Scholar]
- Thurau C. T.; Ediger M. D. Spatially heterogeneous dynamics during physical aging far below the glass transition temperature. J. Polym. Sci., Part B: Polym. Phys. 2002, 40212463–72. [Google Scholar]
- Hirakura Y.; Yamaguchi H.; Mizuno M.; Miyanishi H.; Ueda S.; Kitamura S. Detection of lot-to-lot variations in the amorphous microstructure of lyophilized protein formulations. Int. J. Pharm. 2007, 3401–234–41. [DOI] [PubMed] [Google Scholar]
- Murphy B. M.; Zhang N.; Payne R. W.; Davis J. M.; Abdul-Fattah A. M.; Matsuura J. E.; Herman A. C.; Manning M. C. Structure, stability, and mobility of a lyophilized IgG1 monoclonal antibody as determined using second-derivative infrared spectroscopy. J. Pharm. Sci. 2012, 101181–91. [DOI] [PubMed] [Google Scholar]
- Meersman F.; Smeller L.; Heremans K. Comparative Fourier transform infrared spectroscopy study of cold-, pressure-, and heat-induced unfolding and aggregation of myoglobin. Biophys. J. 2002, 8252635–44. [DOI] [PMC free article] [PubMed] [Google Scholar]
- Eliezer D.; Yao J.; Dyson H. J.; Wright P. E. Structural and dynamic characterization of partially folded states of apomyoglobin and implications for protein folding. Nat. Struct. Biol. 1998, 52148–55. [DOI] [PubMed] [Google Scholar]
Associated Data
This section collects any data citations, data availability statements, or supplementary materials included in this article.


