

Inflammatory responses in LPS-induced systemic inflammation are increased in P2Y12 null mice.
Keywords: P2Y receptor antagonism, thienopyridine platelets
Abstract
Thienopyridines are a class of antiplatelet drugs that are metabolized in the liver to several metabolites, of which only one active metabolite can irreversibly antagonize the platelet P2Y12 receptor. Possible effects of these drugs and the role of activated platelets in inflammatory responses have also been investigated in a variety of animal models, demonstrating that thienopyridines could alter inflammation. However, it is not clear whether it is caused only by the P2Y12 antagonism or whether off-target effects of other metabolites also intervene. To address this question, we investigated P2Y12 KO mice during a LPS-induced model of systemic inflammation, and we treated these KO mice with a thienopyridine drug (clopidogrel). Contrary to the reported effects of clopidogrel, numbers of circulating WBCs and plasma levels of cytokines were increased in LPS-exposed KO mice compared with WT in this inflammation model. Moreover, both spleen and bone marrow show an increase in cell content, suggesting a role for P2Y12 in regulation of bone marrow and spleen cellular composition. Finally, the injury was more severe in the lungs of KO mice compared with WT. Interestingly, clopidogrel treatments also exerted protective effects in KO mice, suggesting off-target effects for this drug. In conclusion, the P2Y12 receptor plays an important role during LPS-induced inflammation, and this signaling pathway may be involved in regulating cell content in spleen and bone marrow during LPS systemic inflammation. Furthermore, clopidogrel may have effects that are independent of P2Y12 receptor blockade.
Introduction
The P2Y12 receptor mediates ADP-induced aggregation in platelets, but it also plays a crucial role when these cells are activated by other agonists [1]. Previous studies have shown that Gi signaling, mediated by the P2Y12 receptor, is dependent on the cholesterol-rich lipid rafts [2] and that high-fat diet enhances platelet activation induced by other agonists [3]. In addition to chronic hypercholesterolemia, other pathologic conditions, ranging from diabetes [4] to hypertension, may increase P2Y12 receptor functions and hence, the risk of thrombosis. Moreover, polymorphisms in the P2Y12 gene, which enhance receptor activity, have been associated with increased risk of thrombotic events [5]. The P2Y12 receptor gene variants correlate with pulmonary inflammation and asthma [6], and receptor deficiency abrogated dust mite-induced airway inflammation [7], suggesting an important role for the P2Y12 receptor also in pulmonary inflammation.
A class of antiplatelet drugs—thienopyridines—has been designed to antagonize the P2Y12 receptor on platelet membrane [1] to prevent ADP-induced aggregation and consequently, thrombus formation [1, 8]. These drugs are orally administrated as a pro-drug and then metabolized in the liver to generate the active form that irreversibly inactivates the P2Y12 receptor [9]. However, the metabolism of the pro-drug also produces other metabolites that have been considered inactive [10].
As it has been suggested that P2Y12 may be expressed in other cells of the immune system, such as lymphocytes, monocytes, and DCs [11, 12], rather than platelets alone, the effects of thienopyridines and in particular, clopidogrel have been evaluated in a variety of animal models, such as LPS-induced systemic inflammation [13], myocardial infarction [14], and inflammatory erosive arthritis [15, 16]. Interestingly, during myocardial infarction [14] and LPS-induced sepsis [17], clopidogrel pretreatment could decrease inflammation levels, suggesting a protective role for these drugs. On the contrary, during erosive arthritis, the severity of the inflammation in the joints was augmented when animals were pretreated with clopidogrel [16]. The reasons for the proinflammatory effects of clopidogrel in this animal model compared with others are not known, although the use of exposed collagen in generating arthritis may activate unique inflammatory pathways, which are regulated differently than those observed in other models of inflammation [6, 14, 17].
Previous effects of clopidogrel treatments could be a result of P2Y12 antagonism, but they could be caused by possible off-target effects of other metabolites generated by the clopidogrel metabolism. To evaluate this possibility, we used P2Y12 KO mice and treated them for 4 days with LPS, with or without clopidogrel treatment. Then, we analyzed blood-cell count and cytokine levels in plasma to evaluate levels of systemic inflammation. Furthermore, we investigated effects on organs by studying cell content in the spleen and the bone marrow and by analyzing cell infiltration in the lungs. Our findings show that the levels of inflammation in LPS-treated KO animals were higher than those in LPS-treated WT mice, suggesting that the P2Y12 receptor had a protective role in this model of inflammation. Furthermore, clopidogrel treatments altered inflammatory response and spleen and bone marrow cell content in P2Y12 receptor KO mice, suggesting that clopidogrel effects could also be a result of off-target effects of metabolites rather than of the P2Y12 blockade.
MATERIALS AND METHODS
Materials
All reagents (analytical grade) were obtained from Thermo Fisher Scientific (Waltham, MA, USA), unless stated otherwise. LPS from Salmonella enterica serotype enteritidis (L7770; protein content ≤1%) and BSA were obtained from Sigma-Aldrich (St. Louis, MO, USA). Clopidogrel was provided as 75 mg Plavix tablets from Bristol-Myers Squibb/Sanofi Pharmaceutical partnership (New York, NY, USA). HBSS and PBS were purchased from Mediatech (Manassa VA, USA). Antibodies against mouse CD14 (FITC-conjugated; clone Sa2-8) mouse CD11b (PE-conjugated; clone M1/70), mouse CD25 (APC-conjugated; clone PC61.5), and mouse CD69 (APC-conjugated; clone H1.2F3) were obtained from eBioscience (San Diego, CA, USA). Rat IgG2a K isotype control FITC, rat IgG2b K isotype control PE, and rat IgG1 K isotype control APC were also purchased from eBioscience. Goat polyclonal antibody against MPO (L-20) was from Santa Cruz Biotechnology (Santa Cruz, CA, USA), and streptavidin Alexa Fluor 488 conjugate was from Life Technologies (Grand Island, NY, USA).
Animals and treatments
WT and P2Y12 KO pathogen-free C57BL/6 male mice (weight, 25–30 g) were obtained from Shering-Plough corporation (Kenilworth, NJ) [18], and given unlimited access to food and water before treatment. Mice were assigned randomly to one of four groups for WT or KO: WT and KO control group (six animals/group); WT and KO LPS-induced systemic inflammation group (LPS group, nine animals/group) received an i.p. dose of PBS or LPS (3 mg/kg, LPS group) for 4 consecutive days. LPS dose and time of exposure were chosen on the basis of previous pilot experiments in our laboratory and previous studies [19, 20]. Clopidogrel was orally administrated to WT and KO (four animals/group) with a loading dose of 30 mg/kg and a maintenance dose of 10 mg/kg for 4 consecutive days. WT and KO LPS-induced systemic inflammation and clopidogrel group (six animals/group) received LPS and clopidogrel treatments. Animals were weighed and examined daily. At Day 4, mice were anesthetized, and blood samples were collected by cardiac puncture (10:1 ratio of blood in 3.8% sodium citrate) for hematology studies that were performed using the HemaVet Multispecies Hematology System (Drew Scientific, Oxford, CT, USA). All animals were killed at Day 4. The experimental protocol followed in this study was fully approved by the Institutional Animal Care and Use Committee of Temple University School of Medicine.
Cytokine profiles
Plasma aliquots from each animal were obtained by blood centrifugation (2000 g for 10 min) and used for detection of IL-1β, IL-4, IL-6, IL-10, IFN-γ, and KC plasma levels by the Luminex system (Allied Biotech, Ijamsville, MD, USA) [21].
Cell extraction in bone marrow
To isolate bone marrow, the tibiae and femurs were harvested, and the medullar channels were flushed with 2% BSA in HBSS. The single-cell suspension obtained by mechanical dissociation (passing the cells through needles of gauge 25) was then centrifuged at 300 g for 5 min at 20°C and resuspended in 1 ml HBSS. This volume of suspension was analyzed with the HemaVet Multispecies Hematology System. Cells were then fixed using 2% PFA in PBS and kept at 4°C prior to analysis.
Isolation of cells in the spleen
To analyze cells in the spleen, the organ was removed and minced (cell strainer, 70 μM nylon mesh). Then, minced tissue was passed through the mesh to obtain a single-cell suspension. After washing, cells were resuspended in HBSS and analyzed with the HemaVet Multispecies Hematology System. Cells were then fixed using PFA (2% in PBS) and kept at 4°C before analysis.
Flow cytometry
Fixed samples were incubated with FITC-conjugated anti-mouse CD14, PE-conjugated anti-mouse CD11b, APC-conjugated anti-mouse CD25, and APC-conjugated anti-mouse CD69 for 1 h at 4°C. Rat IgG2a isotype control FITC, rat IgG2b K isotype control PE, and rat IgG1 K isotype control APC were used as background controls. All antibodies were diluted 1:100 in PBS. After being washed, samples were resuspended in PBS and kept at 4°C up to analysis. Flow cytometry was performed on a FACSCalibur analyzer (Becton Dickinson, San Diego, CA, USA), and data were analyzed with FlowJo software (TreeStar, Ashland, OR, USA).
Lung histopathology
After 4 days of LPS treatment, mice were anesthetized and killed by cardiac puncture and exsanguination. Organs were weighed, and the percentage of the organ from the total body weight was calculated and plotted. Then, lungs were formalin-fixed and embedded in paraffin, and 5-μm sections were stained with H&E. Morphological analysis of random fields (n=6) from each section (n=3 sections/animal) was performed by a second independent, blinded observer, using methods described previously [22]. ALI was scored based on four parameters: alveolar capillary congestion, hemorrhage, infiltration or aggregation of neutrophils in the airspace or the vessel wall, and thickness of the alveolar wall. Each parameter was graded from 0 to 4, based on the damage present (0, no or little damage; 1, <25% damage; 2, 25–50% damage; 3, 50–75% damage; and 4, >75% damage). The degree of ALI was assessed by the sum of scores of four parameters, and the average sum of each was compared among groups.
MPO measurements
Murine lung-tissue sections were deparaffinized and antigen retrieval achieved by microwaving the tissue slides for 4 min in citrate buffer, pH 6.0. MPO levels were determined using a goat polyclonal antibody against MPO [23]. The slides were washed and incubated with biotinylated rabbit anti-goat IgG2b antibody. Fluorescence visualization was achieved using a streptavidin Alexa Fluor 488 conjugate. The slides were mounted in Vectashield with DAPI (DNA stain) and imaged using fluorescence microscopy. The ImageJ cell-counting program was used to determine fluorescence mean.
Statistical analysis
Differences among groups were statistically analyzed using one-way ANOVA; Bonferroni's multiple comparison test was used as post-test analyses. P < 0.05 was considered to be significant. Data are reported as mean ± sem for each group.
RESULTS
Effect of LPS treatments on body weight and animal survival
There are a number of LPS models of inflammation that have been described in previous studies. The model that we chose (3 mg/kg for 4 days) was based on previous pilot experiments in our laboratory and previous studies [19, 20], where repeated LPS doses have been shown to alter inflammation differently than a single dose. We aimed to analyze effects of P2Y12 KO when animals where challenged with repeated LPS treatments for a prolonged period of time. WT and KO animals survived the 4-day repeated treatments of LPS, administrated with or without clopidogrel treatment (loading dose of 30 mg/kg and a maintenance dose of 10 mg/kg). The change in body weight among groups is shown in Table 1, indicating that LPS treatments decreased the body weight of the animals significantly (P<0.05 LPS treated vs. untreated), with no change between WT and KO. Clopidogrel treatments (alone or when coadministrated with LPS) did not alter animal weight.
Table 1. Effects of LPS Treatments on Body Weight.
| WT (g) |
KO (g) |
|||
|---|---|---|---|---|
| Before | After | Before | After | |
| Control | 27 ± 2 | 31 ± 1 | 26 ± 2 | 30 ± 2 |
| Clopidogrel | 25 ± 3 | 21.7 ± 2.0 | 23 ± 2 | 20.6 ± 1.0 |
| LPS | 28 ± 1 | 20.5 ± 0.8a | 28 ± 1 | 21.2 ± 1.5a |
| LPS + clopidogrel | 26 ± 4 | 20.4 ± 2.5a | 27 ± 3 | 20.5 ± 1.7a |
WT and KO mice were injected daily with PBS (control) or LPS for 4 days. Weight was recorded prior to initiation of treatment or prior to death. Data are expressed in grams, and they represent mean ± sem.
P < 0.05 (LPS treated vs. control; n=9).
Inflammation-induced elevations in circulating WBC counts are increased in P2Y12 null mice
Considering that inflammatory conditions may alter the number of WBCs circulating in blood [24, 25], hematology studies were performed on animal blood samples collected after 4 days of LPS, LPS plus clopidogrel, clopidogrel alone, or vehicle controls (Fig. 1). LPS treatment produced increased total WBC (Fig. 1A) and neutrophil counts (Fig. 1B) in WT and KO mice compared with controls (P<0.01). However, the number of WBCs and neutrophils was significantly higher in LPS-treated P2Y12 KO mice compared with LPS-treated WT mice (P<0.05 and P<0.01, respectively; Fig. 1A and B), suggesting an increased level of inflammation in KO mice compared with their WT counterpart. Furthermore, significant alterations in lymphocyte counts were only observed in the KO mice exposed to LPS plus clopidogrel compared with those treated with clopidogrel alone (P<0.05; Fig. 1C). It is interesting to note that platelet count was lower in healthy P2Y12 null mice compared with healthy WT and that LPS exposure similarly decreased the number of circulating platelets in both groups (data not shown).
Figure 1. Inflammation-induced elevation in circulating WBC counts is increased in P2Y12 null mice.
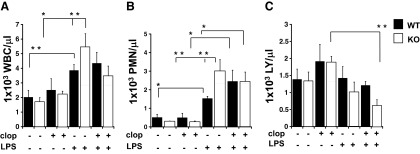
Blood samples were collected by cardiac puncture in 3.8% sodium citrate (10:1) and hematology studies performed. Graphs show count of WBCs (A) neutrophil (PMN; B), and lymphocytes (LY; C) in WT (black) and P2Y12 KO (white) mice. The groups analyzed were: LPS, LPS plus clopidogrel (clop), clopidogrel alone, or vehicle control. Values are expressed as 1 × 10³ cells/μL, mean ± sem; *P < 0.01 and **P < 0.05 treated versus untreated and WT versus KO (n=6).
Inflammation-induced increases in plasma cytokines are enhanced in P2Y12 KO mice following LPS treatment
Cytokine levels in plasma samples were also tested as a direct indicator of inflammatory responses. Figure 2 shows the concentration of the following cytokines that were detected in our system: TNF-α, IFN-γ, IL-10, IL-6, IL-4, and KC. The increase in all of the cytokine levels was higher in LPS-treated KO animals compared with LPS-treated WT mice (P<0.01; LPS-treated KO vs. LPS-treated WT; Fig. 2). These data indicate that the P2Y12 receptor plays a key role in the regulation of cytokine production in LPS-treated animals. Interestingly, clopidogrel treatment had differential effects that were cytokine-specific. Clopidogrel alone significantly reduced plasma levels of KC (P<0.05) in WT animals compared with controls but had no effect on the other cytokines measured under these experimental conditions. In LPS plus clopidogrel animals, plasma levels of TNF-α and IL-4 were reduced compared with LPS treatment alone in KO mice (P<0.01). Conversely, IFN-γ levels were enhanced in LPS plus clopidogrel KO mice but not in LPS plus clopidogrel WT mice (P<0.05). Furthermore, clopidogrel increased plasma IL-6 significantly in LPS-treated WT mice (P<0.01), but the increase did not reach significance in KO mice.
Figure 2. Inflammation-induced increases in plasma cytokines are elevated in P2Y12 KO mice following LPS treatments.

Plasma samples obtained from each animal were used for detection levels of TNF-α, IFN-γ, IL-10, IL-6, IL-4, and KC in WT (black) and KO (white) mice. The groups analyzed were: LPS, LPS plus clopidogrel, clopidogrel alone, or vehicle control. Values are expressed as pg/ml, mean ± sem; *P < 0.01 and **P < 0.05 (n=6).
LPS treatments caused splenomegaly and accumulation of immune cells in the spleen
To evaluate further the difference in systemic inflammation between WT and KO mice, we investigated possible changes in the spleen following LPS exposure. When animals were treated with LPS, spleen weight of WT animals increased by 1.73 ± 0.1-fold, whereas for KO mice, the increase was 4.3 ± 0.1-fold (P<0.05; KO vs. WT). Hence, splenomegaly was more severe in P2Y12 KO challenged with LPS than in WT mice. On the contrary, when animals were treated with clopidogrel only and LPS plus clopidogrel, splenomegaly was higher in WT mice compared with the KO mice (P<0.05). Data are shown in Table 2, expressed as mg/g animal weight.
Table 2. LPS Treatment Caused Splenomegaly.
| Control | Clopidogrel | LPS | LPS + clopidogrel | |
|---|---|---|---|---|
| WT | 0.5 ± 0.1 | 0.40 ± 0.02 | 1.0 ± 0.1a | 1.5 ± 0.1a |
| KO | 0.23 ± 0.04 | 0.54 ± 0.12 | 1.0 ± 0.2a | 1.0 ± 0.1a |
Spleen weight was analyzed in WT and KO animals, untreated or treated with clopidogrel, LPS, and LPS plus clopidogrel. Data are expressed in mg/g weight.
P < 0.05 (LPS treated vs. control; LPS plus clopidogrel vs. clopidogrel only; n=9).
Next, we analyzed the cells extracted from the spleen to explore immune cell content. The number of neutrophils and lymphocytes of WT and KO with LPS, LPS plus clopidogrel, clopidogrel alone, or vehicle control is shown in Fig. 3A and B. Interestingly, neutrophil count was increased significantly in both groups following LPS exposure compared with untreated animals (Fig. 3A; P<0.05, treated vs. untreated WT; P<0.01, treated vs. untreated KO). However, the cell count was much lower in healthy KO compared with WT (P<0.05; WT vs. KO). In WT and KO, clopidogrel treatment alone caused an increase in neutrophil count (P<0.05) but had no significant effect on spleen lymphocytes. As an exception from this rule, LPS plus clopidogrel treatment did decrease spleen lymphocyte numbers in the KO mice compared with LPS-treated animals (P<0.05).
Figure 3. LPS treatments caused splenomegaly and accumulation of immune cells in the spleen.

Cells isolated from the spleen were analyzed, and graphs show neutrophil (A) and lymphocyte (B) count in LPS, LPS plus clopidogrel, clopidogrel alone, or vehicle control WT (black) and P2Y12 KO mice (white). *P < 0.01 and **P < 0.05 treated versus untreated and WT versus KO (n=6). (C) Representative flow cytometry histograms (left) showing CD11b, CD25, and CD69 staining in WT, KO, WT plus clopidogrel, and KO plus clopidogrel of LPS-treated (black line) and untreated (gray line) spleens. GMFI values of WT (black bars) and KO (white bars) are plotted on the right. *P < 0.01 and **P < 0.05 treated versus untreated and WT versus KO (n=6). Isotype controls were 2.3 ± 0.3 for PE-labeled (CD11b), 35 ± 8 for APC-labeled (CD25), and 11 ± 3 for APC-labeled (CD69). FL2/4-H, Fluorescence 2/4-height. (D) Percentage values of CD11b+CD14+ cells in WT (black bars) and KO (white bars) are plotted for controls, clopidogrel, LPS, and LPS plus clopidogrel animals analyzed in WT and KO (n=6). Negative control was 5 ± 1%.
To complement the results obtained by our hematology studies, we evaluated the cell dynamics in our experimental system using flow cytometry. To assess parameters allowing us to characterize immune response broadly, we used four markers: CD11b, CD14, CD25, and CD69. CD11b (α-M integrin) is expressed on practically all myeloid cells, including neutrophils and monocytes/macrophages, as well as on NK cells and activated lymphocytes [26–29]; CD14 is a coreceptor for LPS, which is highly expressed on macrophages and to a lesser extent, on monocytes and neutrophils [30, 31]; and CD25 is an α-chain of the IL-2R, which is expressed on activated lymphocytes, DCs, and monocytes/macrophages [32–36]. CD69 is a disulfide-linked homodimer with two chains constitutively phosphorylated, which is expressed after activation on T and B lymphocytes and NK cells [37, 38]. Therefore, labeling for CD11b, CD25, or CD69 defines activated immune cells, and double-labeling CD11b and CD14 defines macrophages. Figure 3C, left, shows representative images of flow cytometry histograms for murine samples of animals treated with LPS (black line) and without (gray line) for LPS-treated WT and KO, before and after clopidogrel exposure. In Fig. 3C, right, changes in GMFI values of CD11b, CD25, and CD69 are shown for WT (black bars) and KO (white bars) animals. Results indicate that in LPS-challenged KO, CD11b levels were significantly higher than in KO mice that were not treated with clopidogrel (Fig. 3C, top right; P<0.05), whereas no significant change was observed between LPS-treated and untreated WT. Interestingly, when KO mice were exposed to LPS plus clopidogrel, CD11b expression decreased significantly compared with the LPS only-treated KO ones (P<0.01). In WT (black bars) and KO (white bars) mice, CD25 expression was increased significantly in response to LPS (P<0.01), although the levels of CD25 were augmented in KO LPS-treated animals compared with LPS-treated WT mice (P<0.05). Clopidogrel treatment decreased LPS-stimulated CD25 expression in WT mice (P<0.05) but not KO mice. CD69 expression (Fig. 3C, bottom right) was also determined and was increased significantly in LPS-treated mice compared with untreated animals in WT and KO mice (P<0.01; LPS-treated vs. untreated mice). Clopidogrel exposure, alone or in conjunction with LPS, did not alter CD69 expression in WT mice. On the contrary, clopidogrel alone elevated CD69 expression in the spleen of KO mice (P<0.05), which was not augmented in the presence of LPS. In Fig. 3D, CD11b+CD14+ cells are analyzed. The percentage of double-positive cells was plotted, showing that no difference was noted between treated and untreated groups, with or without clopidogrel exposure (Fig. 3D). Collectively, these data show that the lack of the P2Y12 receptor caused an increase in lymphocyte activation but not in macrophage accumulation in the spleen upon LPS treatment. Furthermore, clopidogrel-alone treatments could alter the cellular phenotype of P2Y12 KO mice, but no change was noted in the WT group, suggesting that the lack of P2Y12 may cause the clopidogrel-active and -inactive metabolite to bind to other receptors. Interestingly, in LPS-treated P2Y12 KO mice, CD11b and CD25 were increased compared with LPS plus clopidogrel-treated WT, suggesting that the drug may have P2Y12-independent effects.
LPS treatments alter cell content in the bone marrow of P2Y12 KO mice
We also investigated the possible changes in cell content in bone marrow. First, we performed cell counts of WBCs (Fig. 4A), discovering that the number of neutrophils decreased significantly in WT animals upon LPS treatment (P<0.05), whereas no change was observed in the KO. However, it is important to note that the number of neutrophils in healthy, untreated KO was significantly lower (P<0.05) than that in healthy WT. Lymphocyte content decreased in WT (P<0.01) and KO (P<0.05) when mice were treated with LPS. Interestingly, clopidogrel treatment increased lymphocyte numbers in WT and KO compared with control animals (P<0.01). The addition of clopidogrel to LPS-treated animals had no significant effect on lymphocyte numbers.
Figure 4. LPS treatments also alter cell content in the bone marrow of P2Y12 KO mice.

Cells isolated from the bone marrow were analyzed, and graphs show neutrophil (A) and lymphocyte (B) count in WT (black) and P2Y12 KO mice (white) for control, clopidogrel, LPS, and LPS plus clopidogrel. *P < 0.01 and **P < 0.05 treated versus untreated and WT versus KO (n=6). (C) Representative flow cytometry histograms (left) showing CD11b, CD25, and CD69 staining in WT, KO, WT plus clopidogrel, and KO plus clopidogrel of LPS-treated (black line) and untreated (gray line) bone marrow samples. GMFI values of WT (black bars) and KO (white bars) are plotted on the right. *P < 0.01 and **P < 0.05 treated versus untreated and WT versus KO (n=6). Isotype controls were 7.5 ± 0.3 for PE-labeled (CD11b), 84 ± 9 for APC-labeled (CD25), and 28 ± 6 for APC-labeled (CD69). (D) Percentage values of CD11b+CD14+ cells in WT (black bars) and KO (white bars) are plotted for controls, clopidogrel, LPS, and LPS plus clopidogrel animals analyzed in WT and KO (n=6). Negative control was 5 ± 1%.
To characterize cell content in the bone marrow further, we labeled for CD11b or CD25 to define activated immune cells or CD69 for activated T and B lymphocytes and NK cells and double-labeling CD11b and CD14 for macrophages. Figure 4C, left, shows representative images of flow cytometry histograms for WT, WT plus clopidogrel, KO, and KO plus clopidogrel murine samples of untreated animals (gray line) and LPS-treated ones (black line). In Fig. 4C, right, changes in GMFI values of CD11b, CD25, and CD69 are shown for WT (black bars) and KO (white bars) animals. Results indicate that CD11b levels were not different among groups (Fig. 4C, top right), whereas for CD25 expression (Fig. 4C, middle right), GMFI values were increased significantly in LPS-treated mice compared with vehicle control for WT (P<0.05; black bars) and KO (P<0.01; white bars), although this increase was higher in LPS-treated KO compared with WT (P<0.05). In the LPS plus clopidogrel group, CD25 expression was decreased in KO but not in WT mice (P<0.01) compared with their LPS-only counterparts, whereas it caused a decrease in the GMFI of LPS plus clopidogrel-treated WT animals compared with the LPS-KO group (P<0.01). CD69 expression (Fig. 4C, bottom right) was elevated in KO mice treated with clopidogrel compared with untreated ones (P<0.05). Interestingly, clopidogrel treatment could elevate CD69 expression in the bone marrow of LPS-treated KO compared with the clopidogrel or LPS-alone groups (P<0.05). The drug was also able to increase CD69 expression in LPS-treated WT compared with clopidogrel only-exposed animals (P<0.05) but not significantly when compared with LPS only-treated WT. In Fig. 4D, CD11b+CD14+ cells are analyzed. The percentage of double-positive cells was plotted, showing that no significant difference was noted between untreated and LPS-treated mice for WT and KO (Fig. 4D). However, clopidogrel treatment increased the number of double-positive cells in WT and KO mice (P<0.01; clopidogrel treated vs. untreated). This elevated expression was also observed in clopidogrel plus LPS KO mice and was significantly higher than clopidogrel and LPS-treated KO mice (P<0.05; LPS vs. clopidogrel plus LPS-treated mice). These data show that the lack of the P2Y12 receptor caused an augmented activation in lymphocyte but no effect on macrophage accumulation in the bone marrow. Furthermore, clopidogrel treatment was able to influence cell content in WT and P2Y12 KO animals, suggesting off-target effects for the active metabolites, as well as the possibility of effects of other metabolites considered previously inactive. Similarly to what was observed in spleen cell content, in LPS-treated P2Y12 KO mice, CD25 was increased compared with LPS plus clopidogrel-treated WT, suggesting that the drug may have P2Y12-independent effects.
Lung injury is increased in LPS-treated P2Y12 null mice
To assess the functional consequence of the observed increase in the parameters of inflammation, we analyzed whether P2Y12 KO or blockade could alter LPS -induced ALI (n=6). When animals were treated with LPS, lung weight of KO and WT animals increased significantly (P<0.05 LPS-treated KO vs. untreated KO), as shown in Table 3. Then, representative images of the lung section (H&E staining) were analyzed (Fig. 5A), showing that cell infiltration in the lungs was higher in LPS-exposed KO mice compared with the WT. LPS plus clopidogrel treatments did not alter cell infiltration compared with LPS only-exposed animals in WT and KO. Likewise, histology scores (Fig. 5B), based on the alveolar capillary congestion, hemorrhage, infiltration, and aggregation of neutrophils in the airspace or the vessel wall and thickness of the alveolar wall, were significantly higher in the LPS-treated KO group compared with the LPS-treated WT group (P<0.05 KO vs. WT). Neutrophil infiltration was analyzed using MPO measurements and representative images, and fluorescence means are shown in Fig. 5C and D, respectively. These data confirm H&E findings, where neutrophil infiltration was higher in LPS-treated KO mice compared with inflamed WT (P<0.05). Interestingly LPS-treated KO MPO values were higher than in the LPS plus clopidogrel KO group, suggesting that clopidogrel was able to alter inflammation in spite of P2Y12 KO. Furthermore, MPO levels were higher in LPS-treated KO compared with LPS plus clopidogrel WT, suggesting that the drug may have P2Y12-independent effects.
Table 3. LPS Treatment Altered Lung Weight.
| Control | Clopidogrel | LPS | LPS + clopidogrel | |
|---|---|---|---|---|
| WT | 0.5 ± 0.1 | 0.5 ± 0.2 | 1.1 ± 0.2a | 1.3 ± 0.2a |
| KO | 0.6 ± 0.1 | 0.9 ± 0.1 | 1.8 ± 0.6a | 1.4 ± 0.1 |
Lung weight was analyzed in WT and KO animals, untreated or treated with clopidogrel, LPS, and LPS plus clopidogrel. Data are expressed in mg/g weight.
P < 0.05 (LPS treated vs. control; n=9).
Figure 5. Pulmonary injury is increased in LPS-treated P2Y12 null mice compared with treated WT mice.
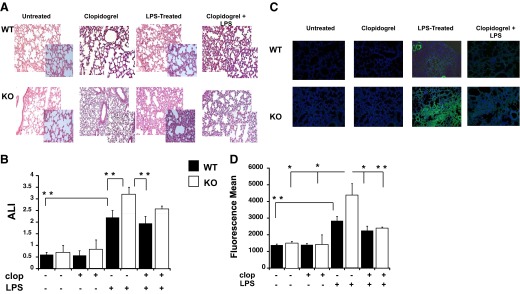
(A) Photomicrographs of H&E-stained tissue sections obtained 4 days after LPS treatment. Representative images of lung-tissue specimens were obtained from LPS, LPS plus clopidogrel, clopidogrel alone, or vehicle control-treated WT and KO mice (original magnification, 20× and 40×; n=6). (B) The ALI score, based on alveolar capillary congestion, hemorrhage, infiltration, or aggregation of neutrophils in the airspace or the vessel wall and thickness of the alveolar wall, was assessed in WT (black bars) and KO (white bars) untreated, clopidogrel, LPS, and clopidogrel plus LPS-treated mice. **P < 0.05 treated versus untreated and WT versus KO (n=6). (C) Representative images of MPO staining (MPO, green; nucleus, blue; original magnification, 20×) for LPS, LPS plus clopidogrel, clopidogrel alone, or vehicle control WT and KO mice. (D) Fluorescence mean of MPO staining values. *P < 0.01 and **P < 0.05 (n=3).
DISCUSSION
The thienopyridines class of antiplatelet drugs was designed to prevent platelet activation by antagonizing the P2Y12 receptor and thereby, preventing thrombus formation [1]. Furthermore, recent studies have shown that clopidogrel was able to affect inflammatory responses in a number of animal models [6, 8, 13–16]. The effects on inflammation observed in these studies may be a result of clopidogrel-active metabolites or off-target effects of other metabolites generated. To evaluate this possibility, we investigated LPS-induced systemic inflammation in P2Y12 KO mice, with or without clopidogrel treatments. Overall, our results show that following LPS treatment, inflammation was more severe in P2Y12 KO mice compared with treated WT animals in terms of higher cytokine levels in plasma and splenomegaly and changes in cellular components in spleen and bone marrow. Also, lung injury appeared to be augmented in inflamed KO compared with WT. Clopidogrel treatments were able to alter the inflammatory state in WT and P2Y12 KO mice, indicating that clopidogrel effects may be a result of off-target effects of its metabolites rather than a P2Y12 blockade.
Following LPS treatment, the spleen of KO mice became much more enlarged than in WT mice. The main cause of splenomegaly is likely to be an increase in the immune cell count, as confirmed by the higher number of neutrophils and lymphocytes detected in the spleen. It has been shown previously that such an increase happens in the course of inflammation [39]. Interestingly, the number of neutrophils in the spleen of healthy KO mice was significantly lower than that in WT animals. The cellular content also appeared to be different in the healthy bone marrow of KO mice compared with healthy WT, indicating that the P2Y12 receptor may have an important effect on cell composition in both organs. When animals were challenged with LPS, the lymphocyte content appeared to be most affected in both spleen and bone marrow of KO, but the macrophage population was not altered. This effect could be platelet-mediated, as these cells have altered functions in KO mice. However, as previous studies suggested that lymphocytes express the P2Y12 receptor [11, 12], the lack of this receptor could impact lymphocyte content directly rather than through functions of other cells. It would be interesting to study whether the individual lymphocyte subsets are affected by the lack of a P2Y12 receptor.
Also, the number of circulating WBCs was increased in LPS-treated KO compared with LPS-treated WT. This could be responsible for the cytokine levels that were increased drastically in LPS-treated KO mice compared with LPS-treated WT mice. IL-10 concentration follows the increase of proinflammatory cytokines, such as TNF-α and IFN-γ, likely as a regulatory function to counteract excessive proinflammatory responses, as it has been shown previously [40, 41]. Indeed, although IL-10 is considered anti-inflammatory, its level is typically increased in the course of Th1 and Th17 inflammation [42–47]. Interestingly, IL-4 was also increased in P2Y12 null mice, although it is thought to generally play an anti-inflammatory role [48, 49] and be diminished during inflammation when IFN-γ is increased [50]. However, in mouse models of colitis, increases in the levels of IL-4 and other Th2-type cytokines were observed and were shown to be related to pathogenesis, most likely at the later stages of the disease and/or of the disease type that is similar to the human ulcerative colitis [42, 47, 51, 52].
Our study shows that repeated LPS treatment increases lung injury in KO mice compared with that in WT animals. These data are in contrast with previous data that focused on P2Y12 null mice during leukotriene E4-induced pulmonary inflammation [6] and showed that the lack of a P2Y12 receptor could protect against inflammation. This disparity may depend on the different inflammation models used and indicates that further experiments need to be carried out to determine the effects of P2Y12 KO during inflammation. Furthermore, previous data have shown that in a rat model of LPS-induced systemic inflammation, clopidogrel treatments were able to decrease inflammation levels [14, 17]. In our experiments, clopidogrel treatments did not alter the inflammatory state in WT animals. Differences may depend on using repeated LPS doses compared with a single dose [14, 17].
To distinguish between effects as a result of P2Y12 KO and the ones as a result of clopidogrel treatment, we treated KO mice with clopidogrel in the same inflammatory model. Interestingly, treatments with this drug also altered the inflammatory response of P2Y12 KO mice, in terms of spleen and bone marrow cell content and lung injury. To our knowledge, no previous studies evaluated the effects of thienopyridine in P2Y12 KO mice. Our data suggest that the active and the inactive metabolites may have an unspecific target that alters the inflammatory response, as WT and KO inflammatory conditions were altered following clopidogrel treatments. Bone marrow and spleen appeared to be the most influenced organs, as changes in cell content were noted not only during inflammation but also when animals were treated with clopidogrel only. Data from our group indicate that prasugrel metabolites could alter neutrophil activation, although these cells did not express the P2Y12 receptor [53], suggesting that other metabolites, generated by drug metabolism, may alter cell functions; hence, clopidogrel could have P2Y12-independent effects. Finally, the number of platelets was the same following LPS treatments in WT and KO mice. Hence, it is unlikely that the observed effects are dependent on the platelet number. Instead, they are likely to be mediated by immune cells. Considering also that P2Y12 KO increases spleen and bone marrow cell content and lung injury to a higher level than does clopidogrel treatment, we can hypothesize that thienopyridines may have effects that are independent of the P2Y12 receptor.
In conclusion, our study shows that the P2Y12 KO receptor could enhance LPS-induced inflammation. This finding is in contrast with some previous data presenting clopidogrel treatments as playing a protective role during inflammation. The observed disparity suggests that the lack of a P2Y12 receptor may have different implications at different stages of inflammation. Furthermore, our findings underline that the P2Y12 receptor could be involved in regulation of cellular composition even in healthy animals, thus modifying their responsiveness to inflammation. Finally, as clopidogrel treatment could alter responses in P2Y12 KO mice, clopidogrel metabolites are likely to have an off-target effect on other receptors that need to be investigated further.
ACKNOWLEDGMENTS
This work was supported by Research Grants HL93231 and HL118593 (to S.P.K.), RO1 HL111552 (to L.E.K.), and HL103197 (to M.C.R.) from the U.S. National Institutes of Health.
Footnotes
- ALI
- acute lung injury
- APC
- allophycocyanin
- GMFI
- geometric mean of fluorescence intensity
- KC
- keratinocyte-derived chemokine
- KO
- knockout
- WBC
- white blood cell
AUTHORSHIP
E.L. designed and conducted experiments, analyzed data, and wrote the manuscript. E.L. and M.C.R. performed the animal model. L.Y. performed experiments. L.E.K. and A.Y.T. designed experiments and interpreted the results. S.P.K. provided overall direction, designed experiments, and analyzed data.
DISCLOSURES
The authors declare no conflict of interests.
REFERENCES
- 1. Kim S., Kunapuli S. P. (2011) P2Y12 receptor in platelet activation. Platelets 22, 54–58 [DOI] [PubMed] [Google Scholar]
- 2. Quinton T. M., Kim S., Jin J., Kunapuli S. P. (2005) Lipid rafts are required in Gα(i) signaling downstream of the P2Y12 receptor during ADP-mediated platelet activation. J. Thromb. Haemost. 3, 1036–1041 [DOI] [PubMed] [Google Scholar]
- 3. Nagy B., Jr., Jin J., Ashby B., Reilly M. P., Kunapuli S. P. (2011) Contribution of the P2Y12 receptor-mediated pathway to platelet hyperreactivity in hypercholesterolemia. J. Thromb. Haemost. 9, 810–819 [DOI] [PMC free article] [PubMed] [Google Scholar]
- 4. Morel O., El Ghannudi S., Hess S., Reydel A., Crimizade U., Jesel L., Radulescu B., Wiesel M. L., Gachet C., Ohlmann P. (2012) The extent of P2Y12 inhibition by clopidogrel in diabetes mellitus patients with acute coronary syndrome is not related to glycaemic control: roles of white blood cell count and body weight. Thromb. Haemost. 108, 338–348 [DOI] [PubMed] [Google Scholar]
- 5. Bura A., Bachelot-Loza C., Ali F. D., Aiach M., Gaussem P. (2006) Role of the P2Y12 gene polymorphism in platelet responsiveness to clopidogrel in healthy subjects. J. Thromb. Haemost. 4, 2096–2097 [DOI] [PubMed] [Google Scholar]
- 6. Paruchuri S., Tashimo H., Feng C., Maekawa A., Xing W., Jiang Y., Kanaoka Y., Conley P., Boyce J. A. (2009) Leukotriene E4-induced pulmonary inflammation is mediated by the P2Y12 receptor. J. Exp. Med. 206, 2543–2555 [DOI] [PMC free article] [PubMed] [Google Scholar]
- 7. Bunyavanich S., Boyce J. A., Raby B. A., Weiss S. T. (2012) Gene-by-environment effect of house dust mite on purinergic receptor P2Y12 (P2RY12) and lung function in children with asthma. Clin. Exp. Allergy 42, 229–237 [DOI] [PMC free article] [PubMed] [Google Scholar]
- 8. Bhavaraju K., Mayanglambam A., Rao A. K., Kunapuli S. P. (2010) P2Y(12) antagonists as antiplatelet agents—recent developments. Curr. Opin. Drug Discov. Devel. 13, 497–506 [PubMed] [Google Scholar]
- 9. Close S. L. (2012) Pharmacogenetics and pharmacogenomics of thienopyridines: clinically relevant? Fundam. Clin. Pharmacol. 26, 19–26 [DOI] [PubMed] [Google Scholar]
- 10. Brandon E. F., Raap C. D., Meijerman I., Beijnen J. H., Schellens J. H. (2003) An update on in vitro test methods in human hepatic drug biotransformation research: pros and cons. Toxicol. Appl. Pharmacol. 189, 233–246 [DOI] [PubMed] [Google Scholar]
- 11. Diehl P., Olivier C., Halscheid C., Helbing T., Bode C., Moser M. (2010) Clopidogrel affects leukocyte dependent platelet aggregation by P2Y12 expressing leukocytes. Basic Res. Cardiol. 105, 379–387 [DOI] [PubMed] [Google Scholar]
- 12. Wang L., Jacobsen S. E., Bengtsson A., Erlinge D. (2004) P2 receptor mRNA expression profiles in human lymphocytes, monocytes and CD34+ stem and progenitor cells. BMC Immunol. 5, 16. [DOI] [PMC free article] [PubMed] [Google Scholar]
- 13. Winning J., Claus R. A., Pletz M. W., Bauer M., Losche W. (2011) Adenosine diphosphate receptor antagonist clopidogrel sulfate attenuates LPS-induced systemic inflammation in a rat model. Shock 36, 317. [DOI] [PubMed] [Google Scholar]
- 14. Liu Y., Gao X. M., Fang L., Jennings N. L., Su Y., Q X., Samson A. L., Kiriazis H., Wang X. F., Shan L., Sturgeon S. A., Medcalf R. L., Jackson S. P., Dart A. M., Du X. J. (2011) Novel role of platelets in mediating inflammatory responses and ventricular rupture or remodeling following myocardial infarction. Arterioscler. Thromb. Vasc. Biol. 31, 834–841 [DOI] [PubMed] [Google Scholar]
- 15. Boilard E., Nigrovic P. A., Larabee K., Watts G. F., Coblyn J. S., Weinblatt M. E., Massarotti E. M., Remold-O'Donnell E., Farndale R. W., Ware J., Lee D. M. (2010) Platelets amplify inflammation in arthritis via collagen-dependent microparticle production. Science 327, 580–583 [DOI] [PMC free article] [PubMed] [Google Scholar]
- 16. Garcia A. E., Mada S. R., Rico M. C., Dela Cadena R. A., Kunapuli S. P. (2011) Clopidogrel, a P2Y12 receptor antagonist, potentiates the inflammatory response in a rat model of peptidoglycan polysaccharide-induced arthritis. PLoS One 6, e26035. [DOI] [PMC free article] [PubMed] [Google Scholar]
- 17. Hagiwara S., Iwasaka H., Hasegawa A., Oyama M., Imatomi R., Uchida T., Noguchi T. (2011) Adenosine diphosphate receptor antagonist clopidogrel sulfate attenuates LPS-induced systemic inflammation in a rat model. Shock 35, 289–292 [DOI] [PubMed] [Google Scholar]
- 18. Foster C. J., Prosser D. M., Agans J. M., Zhai Y., Smith M. D., Lachowicz J. E., Zhang F. L., Gustafson E., Monsma F. J., Jr., Wiekowski M. T., Abbondanzo S. J., Cook D. N., Bayne M. L., Lira S. A., Chintala M. S. (2001) Molecular identification and characterization of the platelet ADP receptor targeted by thienopyridine antithrombotic drugs. J. Clin. Invest. 107, 1591–1598 [DOI] [PMC free article] [PubMed] [Google Scholar]
- 19. Nagano I., Takao T., Nanamiya W., Takemura T., Nishiyama M., Asaba K., Makino S., De Souza E. B., Hashimoto K. (1999) Differential effects of one and repeated endotoxin treatment on pituitary- adrenocortical hormones in the mouse: role of interleukin-1 and tumor necrosis factor-α. Neuroimmunomodulation 6, 284–292 [DOI] [PubMed] [Google Scholar]
- 20. Kang S., Lee S. P., Kim K. E., Kim H. Z., Memet S., Koh G. Y. (2009) Toll-like receptor 4 in lymphatic endothelial cells contributes to LPS-induced lymphangiogenesis by chemotactic recruitment of macrophages. Blood 113, 2605–2613 [DOI] [PubMed] [Google Scholar]
- 21. Nunez N. P., Oh W. J., Rozenberg J., Perella C., Anver M., Barrett J. C., Perkins S. N., Berrigan D., Moitra J., Varticovski L., Hursting S. D., Vinson C. (2006) Accelerated tumor formation in a fatless mouse with type 2 diabetes and inflammation. Cancer Res. 66, 5469–5476 [DOI] [PubMed] [Google Scholar]
- 22. Chen F., Liu Z., Wu W., Rozo C., Bowdridge S., Millman A., Van Rooijen N., Urban J. F., Jr., Wynn T. A., Gause W. C. (2012) An essential role for TH2-type responses in limiting acute tissue damage during experimental helminth infection. Nat. Med. 18, 260–266 [DOI] [PMC free article] [PubMed] [Google Scholar]
- 23. Perl M., Chung C. S., Lomas-Neira J., Rachel T. M., Biffl W. L., Cioffi W. G., Ayala A. (2005) Silencing of Fas, but not caspase-8, in lung epithelial cells ameliorates pulmonary apoptosis, inflammation, and neutrophil influx after hemorrhagic shock and sepsis. Am. J. Pathol. 167, 1545–1559 [DOI] [PMC free article] [PubMed] [Google Scholar]
- 24. Arnold V., Balkow S., Staats R., Matthys H., Luttmann W., Virchow J. C., Jr., (2000) Increase in perforin-positive peripheral blood lymphocytes in extrinsic and intrinsic asthma. Am. J. Respir. Crit. Care Med. 161, 182–186 [DOI] [PubMed] [Google Scholar]
- 25. Daniel L., Fakhouri F., Joly D., Mouthon L., Nusbaum P., Grunfeld J. P., Schifferli J., Guillevin L., Lesavre P., Halbwachs-Mecarelli L. (2006) Increase of circulating neutrophil and platelet microparticles during acute vasculitis and hemodialysis. Kidney Int. 69, 1416–1423 [DOI] [PubMed] [Google Scholar]
- 26. Vetvicka V., Thornton B. P., Ross G. D. (1996) Soluble β-glucan polysaccharide binding to the lectin site of neutrophil or natural killer cell complement receptor type 3 (CD11b/CD18) generates a primed state of the receptor capable of mediating cytotoxicity of iC3b-opsonized target cells. J. Clin. Invest. 98, 50–61 [DOI] [PMC free article] [PubMed] [Google Scholar]
- 27. Pickl W. F., Majdic O., Kohl P., Stockl J., Riedl E., Scheinecker C., Bello-Fernandez C., Knapp W. (1996) Molecular and functional characteristics of dendritic cells generated from highly purified CD14+ peripheral blood monocytes. J. Immunol. 157, 3850–3859 [PubMed] [Google Scholar]
- 28. Nielsen H. V., Christensen J. P., Andersson E. C., Marker O., Thomsen A. R. (1994) Expression of type 3 complement receptor on activated CD8+ T cells facilitates homing to inflammatory sites. J. Immunol. 153, 2021–2028 [PubMed] [Google Scholar]
- 29. Griffin J. D., Spertini O., Ernst T. J., Belvin M. P., Levine H. B., Kanakura Y., Tedder T. F. (1990) Granulocyte-macrophage colony-stimulating factor and other cytokines regulate surface expression of the leukocyte adhesion molecule-1 on human neutrophils, monocytes, and their precursors. J. Immunol. 145, 576–584 [PubMed] [Google Scholar]
- 30. Zhang D. E., Hetherington C. J., Gonzalez D. A., Chen H. M., Tenen D. G. (1994) Regulation of CD14 expression during monocytic differentiation induced with 1 α,25-dihydroxyvitamin D3. J. Immunol. 153, 3276–3284 [PubMed] [Google Scholar]
- 31. Nasu N., Yoshida S., Akizuki S., Higuchi Y., Setoguchi M., Yamamoto S. (1991) Molecular and physiological properties of murine CD14. Int. Immunol. 3, 205–213 [DOI] [PubMed] [Google Scholar]
- 32. Zhou L. J., Tedder T. F. (1995) A distinct pattern of cytokine gene expression by human CD83+ blood dendritic cells. Blood 86, 3295–3301 [PubMed] [Google Scholar]
- 33. Vazquez A., Auffredou M. T., Gerard J. P., Delfraissy J. F., Galanaud P. (1987) Sequential effect of a high molecular weight B cell growth factor and of interleukin 2 on activated human B cells. J. Immunol. 139, 2344–2348 [PubMed] [Google Scholar]
- 34. Scheibenbogen C., Keilholz U., Richter M., Andreesen R., Hunstein W. (1992) The interleukin-2 receptor in human monocytes and macrophages: regulation of expression and release of the α and β chains (p55 and p75). Res. Immunol. 143, 33–37 [DOI] [PubMed] [Google Scholar]
- 35. Pilon C., Levast B., Meurens F., Le Vern Y., Kerboeuf D., Salmon H., Velge-Roussel F., Lebranchu Y., Baron C. (2009) CD40 engagement strongly induces CD25 expression on porcine dendritic cells and polarizes the T cell immune response toward Th1. Mol. Immunol. 46, 437–447 [DOI] [PubMed] [Google Scholar]
- 36. Ledbetter J. A., Imboden J. B., Schieven G. L., Grosmaire L. S., Rabinovitch P. S., Lindsten T., Thompson C. B., June C. H. (1990) CD28 ligation in T-cell activation: evidence for two signal transduction pathways. Blood 75, 1531–1539 [PubMed] [Google Scholar]
- 37. Borrego F., Robertson M. J., Ritz J., Pena J., Solana R. (1999) CD69 is a stimulatory receptor for natural killer cell and its cytotoxic effect is blocked by CD94 inhibitory receptor. Immunology 97, 159–165 [DOI] [PMC free article] [PubMed] [Google Scholar]
- 38. Testi R., D'Ambrosio D., De Maria R., Santoni A. (1994) The CD69 receptor: a multipurpose cell-surface trigger for hematopoietic cells. Immunol. Today 15, 479–483 [DOI] [PubMed] [Google Scholar]
- 39. Tolosano E., Fagoonee S., Hirsch E., Berger F. G., Baumann H., Silengo L., Altruda F. (2002) Enhanced splenomegaly and severe liver inflammation in haptoglobin/hemopexin double-null mice after acute hemolysis. Blood 100, 4201–4208 [DOI] [PubMed] [Google Scholar]
- 40. Forsberg G., Hernell O., Hammarstrom S., Hammarstrom M. L. (2007) Concomitant increase of IL-10 and pro-inflammatory cytokines in intraepithelial lymphocyte subsets in celiac disease. Int. Immunol. 19, 993–1001 [DOI] [PubMed] [Google Scholar]
- 41. Latifi S. Q., O'Riordan M. A., Levine A. D. (2002) Interleukin-10 controls the onset of irreversible septic shock. Infect. Immun. 70, 4441–4446 [DOI] [PMC free article] [PubMed] [Google Scholar]
- 42. Spencer D. M., Veldman G. M., Banerjee S., Willis J., Levine A. D. (2002) Distinct inflammatory mechanisms mediate early versus late colitis in mice. Gastroenterology 122, 94–105 [DOI] [PubMed] [Google Scholar]
- 43. McGeachy M. J., Bak-Jensen K. S., Chen Y., Tato C. M., Blumenschein W., McClanahan T., Cua D. J. (2007) TGF-β and IL-6 drive the production of IL-17 and IL-10 by T cells and restrain T(H)-17 cell-mediated pathology. Nat. Immunol. 8, 1390–1397 [DOI] [PubMed] [Google Scholar]
- 44. Jankovic D., Kullberg M. C., Feng C. G., Goldszmid R. S., Collazo C. M., Wilson M., Wynn T. A., Kamanaka M., Flavell R. A., Sher A. (2007) Conventional T-bet(+)Foxp3(−) Th1 cells are the major source of host-protective regulatory IL-10 during intracellular protozoan infection. J. Exp. Med. 204, 273–283 [DOI] [PMC free article] [PubMed] [Google Scholar]
- 45. Ghoreschi K., Laurence A., Yang X. P., Tato C. M., McGeachy M. J., Konkel J. E., Ramos H. L., Wei L., Davidson T. S., Bouladoux N., Grainger J. R., Chen Q., Kanno Y., Watford W. T., Sun H. W., Eberl G., Shevach E. M., Belkaid Y., Cua D. J., Chen W., O'Shea J. J. (2010) Generation of pathogenic T(H)17 cells in the absence of TGF-β signalling. Nature 467, 967–971 [DOI] [PMC free article] [PubMed] [Google Scholar]
- 46. Gerosa F., Nisii C., Righetti S., Micciolo R., Marchesini M., Cazzadori A., Trinchieri G. (1999) CD4(+) T cell clones producing both interferon-γ and interleukin-10 predominate in bronchoalveolar lavages of active pulmonary tuberculosis patients. Clin. Immunol. 92, 224–234 [DOI] [PubMed] [Google Scholar]
- 47. Dieleman L. A., Palmen M. J., Akol H., Bloemena E., Pena A. S., Meuwissen S. G., Van Rees E. P. (1998) Chronic experimental colitis induced by dextran sulphate sodium (DSS) is characterized by Th1 and Th2 cytokines. Clin. Exp. Immunol. 114, 385–391 [DOI] [PMC free article] [PubMed] [Google Scholar]
- 48. Yssel H., Groux H. (2000) Characterization of T cell subpopulations involved in the pathogenesis of asthma and allergic diseases. Int. Arch. Allergy Immunol. 121, 10–18 [DOI] [PubMed] [Google Scholar]
- 49. Colavita A. M., Reinach A. J., Peters S. P. (2000) Contributing factors to the pathobiology of asthma. The Th1/Th2 paradigm. Clin. Chest Med. 21, 263–277, viii [DOI] [PubMed] [Google Scholar]
- 50. Feghali C. A., Wright T. M. (1997) Cytokines in acute and chronic inflammation. Front. Biosci. 2, d12–d26 [DOI] [PubMed] [Google Scholar]
- 51. Kanai T., Kawamura T., Dohi T., Makita S., Nemoto Y., Totsuka T., Watanabe M. (2006) TH1/TH2-mediated colitis induced by adoptive transfer of CD4+CD45RBhigh T lymphocytes into nude mice. Inflamm. Bowel Dis. 12, 89–99 [DOI] [PubMed] [Google Scholar]
- 52. Dohi T., Fujihashi K., Rennert P. D., Iwatani K., Kiyono H., McGhee J. R. (1999) Hapten-induced colitis is associated with colonic patch hypertrophy and T helper cell 2-type responses. J. Exp. Med. 189, 1169–1180 [DOI] [PMC free article] [PubMed] [Google Scholar]
- 53. Liverani E., Rico M. C., Garcia A. E., Kilpatrick L. E., Kunapuli S. P. (2013) Prasugrel metabolites inhibit neutrophil functions. J. Pharmacol. Exp. Ther. 344, 231–243 [DOI] [PMC free article] [PubMed] [Google Scholar]