

Abstract
q-Space diffusion MRI (QSI) was used to study the spinal cords of Long Evans shaker (les) rats, a model of dysmyelination, and their age-matched controls at different maturation stages. Diffusion was measured parallel and perpendicular to the fibers of the spinal cords of the two groups and at different diffusion times. The results showed that QSI is able to detect the dysmyelination process that occurs in this model in the different stages of the disease. The differences in the diffusion characteristics of the spinal cords of the two groups were found to be larger when the diffusion time was increased from 22 to 100 ms. We found that the radial mean displacement is a much better parameter than the QSI fractional anisotropy (FA) to document the differences between the two groups. We observed that the degree of myelination affects the diffusion characteristics of the tissues, but has a smaller effect on FA. All of the extracted diffusion parameters that are affected by the degree of myelination are affected in a diffusion time-dependent fashion, suggesting that the terms apparent anisotropy, apparent fractional anisotropy and even apparent root-mean-square displacement (rmsD) are more appropriate.
Keywords: myelin, diffusion MRI, spinal cords, Long Evans shaker, q-space diffusion, QSI
INTRODUCTION
The development of a non-invasive imaging methodology that is both sensitive and specific to white matter (WM) pathologies would be very valuable for the diagnosis, characterization and follow-up of different WM-associated disorders of the central nervous system (CNS). A more specific MRI methodology towards WM-associated diseases may allow us to follow and to better evaluate the effectiveness of treatments for such diseases.
Diffusion tensor MRI (DTI) has been widely used to study and follow WM disorders [1]. In most diffusion studies of neuronal tissues to date, the data have been analyzed using the well-known Stejskal–Tanner equation [2], which assumes the existence of a single unrestricted diffusing component and therefore, in biological tissues, provides a population-averaged apparent diffusion coefficient. When using low diffusion weighting (low b values or low q values), only a single apparent diffusion coefficient is generally observed for water in neuronal tissues. However, when using high diffusion weighting (high b values or high q values), at sufficiently long diffusion times, the water signal decay is found to be non-monoexponential [3–8]. In these cases, the data cannot be analyzed by a monoexponential function and different approaches are required to analyze the data. q-Space analysis, which has been suggested by Callaghan et al. [9] and Cory and Garroway [10], constitutes one such approach for the analysis of such data. q-Space diffusion MRS was first used by King et al. [11,12] to study diffusion in the CNS. Kuchel and coworkers used this approach to study diffusion in red blood cells [13–15] and we extended this approach to the imaging of the CNS [16–25]. q-Space analysis is performed by Fourier transformation of the signal decay with respect to the q value (defined as γδG/2π, where γ is the gyromagnetic ratio, δ is the gradient pulse duration and G is the pulsed gradient strength) to obtain the displacement distribution profile of molecules in the system, according to Equation [1]:
| (1) |
In this equation, EΔ(q) represents the echo decay as a function of q, R is the net displacement vector (R = r − r0) and is the displacement probability. The displacement distribution profile obtained can be quantified using two parameters: the displacement as calculated from the full width at half-maximum (FWHM) of the displacement profile, and the probability for zero displacement extracted from the intensity of the displacement profile, all for a certain diffusion time [10]. Kurtosis is another parameter that has recently been added to describe restricted diffusion. This value reflects the deviation from a Gaussian distribution and has been suggested to be a suitable measure of a tissue’s microstructure (26).
Despite the fact that water diffusion anisotropy is widely used to study CNS pathologies and tractography, the relative contribution of different structural components of neuronal tissues to this observed anisotropy is still debated [27]. Various structural components of the WM tissue may contribute to the anisotropy observed, including myelin sheaths, axonal membranes, microtubules and neurofilaments [27–29]. Beaulieu and Allen [28,29] suggested that myelin is not a necessary determinant for diffusion anisotropy, following a study in which a similar magnitude of diffusion anisotropy was observed in both nonmyelinated and myelinated garfish nerves [28].
Ono et al. [30] examined the diffusion anisotropy in jimpy and twitcher mice, which are animal models for dysmyelination and demyelination, respectively. This study demonstrated that the diffusion anisotropy of optic nerves of jimpy mice did not differ significantly when compared with age-matched control mice. However, in twitcher mice, it was found that the diffusion anisotropy was reduced significantly in the optic and trigeminal nerves when compared with their controls. Gulani et al. [31] studied the diffusion in the spinal cord of myelin-deficient (md) rats and concluded that, although myelination is not a prerequisite for diffusion anisotropy, it does influence the magnitude of the observed anisotropy. Song et al. [32] used shiverer mice to monitor the effect of dysmyelination on the observed anisotropy in WM tracts using DTI. They found that shiverer mice, in which the primary pathology is the reduction in myelin, have lower diffusion fractional anisotropy (FA) relative to their wild-type controls, again demonstrating the relative importance of myelin to the observed anisotropy in WM. In the latter case, an increase in the radial diffusivity (Dr or D⊥) was observed with no change in the axial diffusivity (Da or D∥) [32]. Recently, Tyszka et al. [33] have demonstrated that both radial and axial diffusivities are increased in shiverer mice brains when compared with their age-matched controls. The aforementioned studies, which deal with the influence of myelin on the MR diffusion characteristics, were acquired with relatively low b values (bmax < 1500 s/mm2) and relatively short diffusion times.
Biton et al. [23] evaluated the effect of myelin on the diffusion characteristics in spinal cords of md rats, using high-b-value q-space diffusion MRI (QSI). In their first study, it was found that the mean displacements, both parallel and perpendicular to the fiber direction in the spinal cord, were higher in the md spinal cords when compared with their controls [23]. However, the difference in the FA values computed from these data for both groups was not statistically significant [23]. Subsequently, it was demonstrated that the lack of myelin affects the diffusion characteristics of WM in the excised spinal cords in a diffusion time-dependent manner [24]. It was found that, at long diffusion times, the difference between FA values computed from the QSI data for the two groups was, indeed, statistically significant [24]. This was reinforced by Bar-Shir et al. [25], who examined the MRI diffusion characteristics in the WM of excised brains of md rats by DTI and QSI. Very recently, high-b-value diffusion MRI has been used to study maturation in a model of shaking (sh) pup canine [34].
The main objective of the present work was to study the diffusion characteristics during maturation of the spinal cords of Long Evans shaker (les) rats and their age-matched controls using QSI at different diffusion times. The aims were to characterize this model of WM disorder and to evaluate the contribution of myelin to the observed water diffusion anisotropy at different diffusion times. The les rat is an autosomal-recessive dysmyelinating mutant that has practically no myelin in mature animals [35] as a result of a mutation in the myelin basic protein (MBP) gene [36]. The les spinal cords were examined ex vivo in three different age groups and for different diffusion times. The results from the les groups were compared with those from their age-matched controls and the QSI images were compared with the histological findings.
MATERIALS AND METHODS
Sample preparation
This study was approved by the Animal Care Committee of the School of Veterinary Medicine of the University of Wisconsin-Madison. Eighteen les rats and their age-matched controls at 20, 33 and 180 days of age (n = 3 in each of the control and les groups for each age group) were used in this study. Control and les rats were perfused with 0.1 mM phosphate-buffered saline, followed by paraformaldehyde (PFA) buffered in 0.1 mm phosphate-buffered saline (4% PFA). Following perfusion, spinal cords were excised and stored in 4% PFA. Twenty-four hours before the MR experiments, the samples were immersed in phosphate-buffered saline solution in order to remove the PFA. The samples were then inserted into 5-mm NMR tubes filled with Fluorinert (Sigma, Saint Louis, MI, USA), with their long axis parallel to the z direction (the B0 direction) of the magnet. The temperature was maintained at 25 ± 0.2 °C throughout the experiments.
Diffusion MRI experiments
MRI experiments were performed on a wide-bore 8.4-T NMR spectrometer (Bruker, Karlsruhe, Germany) equipped with a micro5 imaging probe (Bruker, Karlsruhe, Germany) capable of producing pulse gradients of up to 190 G/cm in each of the three directions. Diffusion experiments were conducted using a stimulated echo diffusion imaging pulse sequence with the following parameters: TR = 2000 ms; TE = 30 ms; δ = 2 ms; field of view, 0.48 × 0.48 cm2; matrix dimensions, 64 × 48 (reconstructed to a 64 × 64 matrix); three slices, 1.35 mm thick, with a 0.65-mm gap were collected. Three different Δ values of 22, 50 and 100 ms were used, each in two directions, perpendicular (x,⊥) and parallel (z,∥) to the long axis of the fibers of the spinal cord. The diffusion gradient g was incremented in 16 steps for both directions from 50 to 1175 mT/m, resulting in maximal b values of 8300, 19368 and 39132 s/mm2 when Δ was set to 22, 50 and 100 ms, respectively, and a maximal q value of 1000 cm−1. The signal-to-noise ratios (SNR) for qmin were 123 and 108 for the 50- and 100-ms datasets, respectively. As a result of SNR constraints for the parallel direction (z,∥), only data with Δ values of 22 and 50 ms were analyzed.
Data analysis
The signal decay was analyzed according to the q-space approach. For each pixel, we performed a Fourier transformation of the signal decay with respect to q values, which produced a displacement distribution profile [16]. The displacement, which was calculated from the FWHM, was extracted for each pixel and used to construct displacement maps. It should be noted that all q-space displacement values reported here are 0.425 times the FWHM of the displacement distribution profile [10,16]. For the quantitative analysis, a region of interest (ROI) which encompasses nearly the entire WM of the spinal cord was used (see Fig. 1C for ROI definition). Statistical analysis was performed using Student’s t-test and p ≤ 0.05 was taken as a statistically significant change. The FA from the QSI data (FA-QSI) of the root-mean-square displacement (rmsD) was calculated according to the following equation:
| (2) |
where rmsD is the root-mean-square displacement for each diffusion direction, perpendicular (rmsDx = rmsDy = rmsD⊥) and parallel (rmsDz = rmsD∥) to the long axis of the spinal cord. <rmsD> is the average of the root-mean-square displacements.
Figure 1.

(A) Displacement maps extracted from the q-space diffusion MRI (QSI) data of 33-day-old representative control (top row) and Long Evans shaker (les) (bottom row) spinal cords at three diffusion times (columns). Diffusion was measured perpendicular to the long axis of the spinal cord. (B) Definition of the white matter region of interest used to perform quantitative analyses.
Immunohistochemistry
Following dissection, spinal cord tissue was post-fixed overnight in 4% PFA, followed by sucrose cryoprotection. Tissue was cut into 20-μm free-floating sections and incubated with rabbit anti-MBP (1 : 1000, EMD Millipore, Billerica, MA, USA) overnight. Colorimetric immunolabeling was performed according to standard protocols using diaminobenzidine to visualize labeling. Images were taken on a Nikon E800 microscope (New York, NY, USA) equipped with a SPOT RT digital camera (Diagnostic Instruments Inc., Sterling, MI, USA) using Metamorph software (Molecular devices, Sunnyvale, CA, USA).
Electron microscopy
Control and les spinal cords were post-fixed overnight in 2.5% buffered glutaraldehyde following perfusion. For resin embedding, the tissue was post-fixed in 1% osmium tetraoxide and dehydrated in a series of ethanol concentrations. Propylene oxide was used as a transitional fluid for resin infiltration. Ultrathin sections were cut and mounted on copper grids (Electron Microscopy Sciences, Hatfield, PA, USA) and stained with uranyl acetate, followed by lead citrate. Images were captured on a Hitachi 7600 transmission electron microscope (Tokyo, Japan) housed at the Wisconsin Veterinary Diagnostics Laboratory at University of Wisconsin-Madison.
RESULTS
Figure 1 shows displacement maps extracted from the QSI of 33-day-old representative control and les spinal cords, acquired with diffusion times of 22, 50 and 100 ms. The QSI data were collected with diffusion measured perpendicular to the long axis of the spinal cords. Figure 1B shows the ROI definition used for the quantitative analysis of the q-space parameters (presented in Figs 2–6). Figure 2 shows the average of the rmsD values when diffusion was measured perpendicular to the fiber direction (rmsD⊥) for the control spinal cords in each of the three age groups (20, 33 and 180 days) and at different diffusion times. For each of the three age groups, the rmsD⊥ values increased with an increase in the diffusion time. In the control young age groups of 20 and 33 days, the increase in rmsD⊥ was largest and was found to be about 15–18%. Even in the 180-day-old spinal cords, rmsD⊥ increased with diffusion time. However, in the latter case, the percentage increase was found to be only 7.0%. These increases are much smaller than those expected from the Einstein equation. Increasing the diffusion time from 22 to 100 ms should result, in the case of Gaussian diffusion, in more than doubling of the rmsD. It should be noted that rmsD⊥ of the control spinal cords at a diffusion time of 22 ms was close to the resolution limits of our diffusion measurements. However, the same trend was observed when the rmsD⊥ values at diffusion times of 50 and 100 ms were compared. Here, a 40% increase in rmsD⊥ is expected based on the Einstein equation; however, increases of less than 10% were observed. Here again, the smallest increase in rmsD⊥ was observed for the 180-day-old control rat spinal cords. It is important to note that the rmsD⊥ values at a diffusion time of 50 ms were all well beyond the resolution limit of our q-space diffusion measurements.
Figure 2.
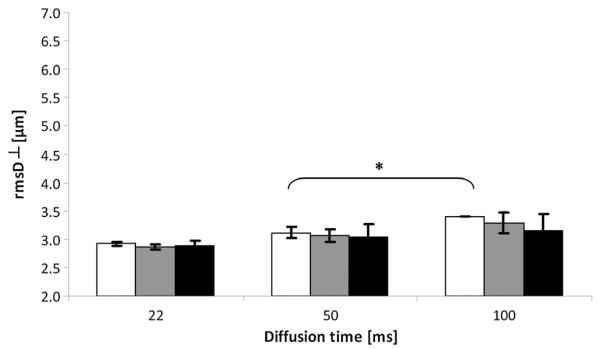
Average displacement values obtained from q-space diffusion MRI (QSI) data for white matter of control spinal cords at three diffusion times and for three age groups. Diffusion was measured perpendicular to the long axis of the spinal cords (root-mean-square displacement, rmsD⊥). White, gray and black columns represent 20-, 33- and 180-day-old groups, respectively. p values were calculated for the same age group between diffusion times and also between each age group and the youngest (20-day-old) age group within the same diffusion time. *p < 0.05. Error bars represent standard deviations.
Figure 6.

Average perpendicular root-mean-square displacement (rmsD⊥) values obtained from the q-space diffusion MRI (QSI) data for white matter of control (white columns) and Long Evans shaker (les) (black columns) spinal cords. Data are shown for the three age groups (20, 33 and 180 days) for control and les spinal cords at diffusion times of 22 ms (A) and 100 ms (B). *p < 0.05, **p < 0.005, ***p < 0.0005. Error bars represent standard deviations.
Figure 3 shows a similar dataset for the les spinal cords. As with the control group, at longer diffusion times, larger displacement values were extracted for all age groups of the les group. However, the increase in the rmsD⊥ values between the 22- and 100-ms diffusion times was much more pronounced in the les group when compared with the control spinal cords. We also observed that, as opposed to the displacement characteristics in the control group, in the les group, large differences between the rmsD⊥ values were found for both the youngest (20-day-old) and oldest (180-day-old) age groups. For the 20- and 180-day-old les spinal cords, the increases in the rmsD⊥ values were 67% and 90%, respectively. The 33-day-old les spinal cord showed the smallest increase in rmsD⊥ with an increase in diffusion time. In this case, the mean displacement increased by 56%. Here again, all of these increases, although much larger than those observed for the control groups, were smaller than the increase in rmsD⊥ expected from the Einstein equation. It should be noted that, in the les group, the rmsD⊥ values, even at the shorter diffusion time, were all higher than 3.1 μm, which is higher than the resolution limit of the present q-space diffusion measurements.
Figure 3.
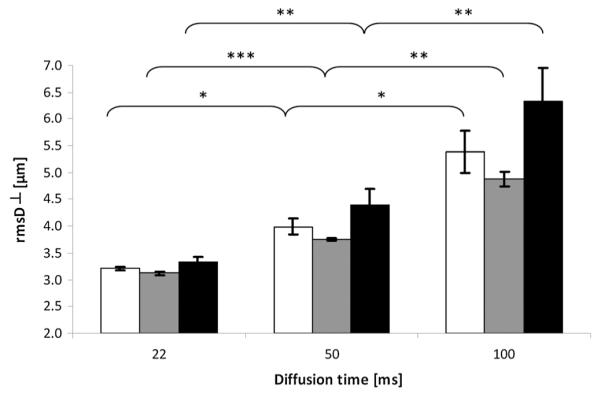
Average displacement values obtained from q-space diffusion MRI (QSI) data for white matter of Long Evans shaker (les) spinal cords at three diffusion times and for three age groups. Diffusion was measured perpendicular to the long axis of the spinal cords (root-mean-square displacement, rmsD⊥). White, gray and black columns represent 20-, 33- and 180-day-old groups, respectively. p values were calculated for the same age group between diffusion times and also between each age group and the youngest (20-day-old) age group within the same diffusion time. *p < 0.05, **p < 0.005, ***p < 0.0005. Error bars represent standard deviations.
Figure 4 shows the mean displacements of the control and les groups for diffusion measured parallel to the long axis of the spinal cord rmsD∥. As expected, the rmsD∥ values extracted here were larger than those extracted under the same conditions when diffusion was measured perpendicular to the long axis of the spinal cords (rmsD⊥). In both the control and les groups, larger displacement values were obtained for each age group when using a diffusion time of 50 ms in comparison with a shorter diffusion time of 22 ms. In the control group, it was observed that the difference between the rmsD∥ values for the two diffusion times was largest for the 33-day-old group of spinal cords, i.e. 68%. For the 20- and 180-day-old groups, the differences were 56% and 54%, respectively. When diffusion was measured parallel to the long axis of the spinal cord, in the les group, there was a somewhat larger increase in the water rmsD∥ as the diffusion time was increased. For the les group, however, the largest increase in rmsD∥ was found for the 180-day-old group. The differences were found to be 63%, 75% and 79% for the 20-, 33- and 180-day-old les groups, respectively. The increases in rmsD∥ in both groups were, as expected, very similar, close or even slightly higher than those expected from the Einstein equation.
Figure 4.

Average displacement values obtained from q-space diffusion MRI (QSI) data for white matter of control (A) and Long Evans shaker (les) (B) spinal cords at two diffusion times and for three age groups. Diffusion was measured parallel to the long axis of the spinal cords (root-mean-square displacement, rmsD∥). White, gray and black columns represent 20-, 33- and 180-day-old groups, respectively. p values were calculated for the same age group between diffusion times and also between each age group and the youngest (20-day-old) age group within the same diffusion time. *p < 0.05, **p < 0.005, ***p < 0.0005. Error bars represent standard deviations.
Figure 5 shows a comparison of the FA values of the rmsD obtained from the QSI data (FA-QSI) in WM of control and les groups. The data are shown for all age groups, but only for two diffusion times, i.e. 22 and 50 ms. In all cases, larger FA-QSI values were found for controls compared with their age-matched les spinal cords. The differences were usually not statistically significant, although a similar trend was seen in the different age groups. These FA-QSI values were found to increase with an increase in diffusion time, and with the maturation of the rats, in both groups.
Figure 5.

Fractional anisotropy values obtained from the q-space diffusion MRI data (FA-QSI) for white matter of control (white columns) and Long Evans shaker (les) (black columns) spinal cords. Data are shown for 20-day-old (A), 33-day-old (B) and 180-day-old (C) spinal cords of the control and les groups at two diffusion times.
Figure 6 shows a comparison between the rmsD⊥ values of control and les spinal cords in each age group when the diffusion time was set to 22 ms (Fig. 6A) or 100 ms (Fig. 6B). The data show that the rmsD⊥ values were smaller for all ages in the control groups and at both diffusion times. The differences between the two groups under the experimental conditions used in the present study, however, were found to be more pronounced and more statistically significant when longer diffusion times were used. The most pronounced differences were found for the oldest age group.
In Fig. 7, light and electron microscopy of the spinal cords of 1-month-old control and les rats illustrate the myelin deficit in the mutant rat. The global lack of myelin in the les spinal cord is clearly seen in the MBP immunolabeling (Fig. 7A,E), where the control rat (Fig. 7A) showed dense labeling of the WM in contrast with the les cord (Fig. 7E) in which MBP-positive myelin was absent. Conformation of the lack of myelin in les was seen in 1-μm sections from the ventral column, where no myelinated axons were present in les (Fig. 7F) in contrast with the control (Fig. 7B). On electron microscopy, this clear difference in myelination was seen in both transverse (Fig. 7C,G) and longitudinal (Fig. 7D,H) sections. However, a close comparison between Figs 7C and 7G shows that the axonal membranes are still present in many axons.
Figure 7.
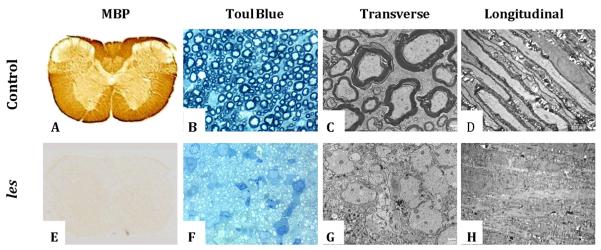
Representative images of myelin basic protein (MBP) immunolabeling (A, E), toluidine blue-labeled 1-μm section (B, F), and transverse (C, G; bars, 2 μm) and longitudinal (D, H; bars, 10 μm) electron microscopy of 1-month-old control (A–D) and Long Evans shaker (les) (E–H) rat spinal cords.
DISCUSSION
In the present study, we used QSI at different diffusion times to examine in vitro, for the first time, the diffusion characteristics of the spinal cords of the les rat, a model of dysmyelination, and their age-matched controls at different stages of maturation and disease. We examined three age groups of 20, 33 and 180 days at different diffusion times of 22, 50 and 100 ms. Both the radial and axial rmsDs (rmsD⊥ and rmsD∥, respectively) were evaluated, from which FA-QSI was computed.
We found that the experimental parameters used to collect the diffusion data affected the results obtained. When the signal decay is not monoexponential, we can use the q-space approach to analyze the data. In such cases, higher diffusion weighting (high b or q values) makes the measurements more sensitive to slowly diffusing molecules, and hence a smaller rmsD should be extracted. In addition, an increase in the diffusion time should result in an increase in rmsD if the molecules are not completely restricted. This is valid only in cases in which all the rmsD values are beyond the resolution limit of the diffusion MR experiment. This implies that the two parameters that determine the magnitude of the b values may have contrasting effects on the observed rmsD. Therefore, it seems more intuitive to monitor rmsD as a function of q at different diffusion times.
According to the Einstein equation, for free diffusing molecules, rmsD should increase as the square root of the diffusion time. We did, indeed, find some increase in rmsD⊥ with diffusion time. However, the magnitude of this effect varied and was different for the les and control groups and for the different age groups. We observed that this effect was small in the control spinal cords when diffusion was measured perpendicular to the fiber direction and was even smaller in the older age group. In the control group, these increases in rmsD⊥ with an increase in diffusion time were smaller than those expected from the Einstein equation. Even if we used, as starting point, the rmsD⊥ values obtained for the control rat spinal cords at a diffusion time of 50 ms, values which were higher than the resolution limits of the present study, we observed an increase of less than 10% instead of the 40% expected when the diffusion time is increased by a factor of two.
In comparison, the mean displacements of the les spinal cords, which were higher than those of the controls, increased more significantly with an increase in the diffusion time. For the 180-day-old les spinal cords, this increase was even more prominent and was close to that expected from the Einstein equation. This is probably the result of the absence of myelin in the les spinal cords, which allows for less restricted diffusion compared with the control spinal cords. For rmsD∥, a dramatic increase was found, as expected, following an increase in the diffusion time from 22 to 50 ms. This increase in rmsD∥ was somewhat larger for the les group relative to the controls, but was not, as expected, different from the expectations from the Einstein equation. Inspection of the data for the les and control groups showed that the differences in the rmsD values of the control and les spinal cords were larger when a long diffusion time of about 100 ms was used. These results are in line with previous studies on md rats [24,25].
The behavior of rmsD of the les and control groups as a function of age was found to be different. In the control spinal cords, we found a small decrease in rmsD⊥ with an increase in age and a larger increase in rmsD∥ for all diffusion times. This is probably a result of normal maturation, which is accompanied by, interalia, normal myelination that results in a reduction in radial diffusivity and an increase in axonal diffusivity, and hence an increase in FA. In the les groups, we found an increase in rmsD∥ with age, similar to the control groups, but the increase was even larger. However, the reason here must be different and may be attributed to the combination of a reduction in restricting barriers, an increase in the total fraction of free water and a smaller axon density, as seen in the histological and electron microscopy images presented in Fig. 7. Interestingly, when diffusion was measured perpendicular to the long axis of the spinal cords, a minimum was found for an age of 33 days. It seems that the diffusion characteristics of the les spinal cords are a manifestation of a ‘competition’ between two contradictory factors: maturation accompanied by myelination and disease progression accompanied by dysmyelination. At the age of 20 days, the control and les rats are both at an early stage of maturation and the amount of myelin is relatively small. Thus, the hindrance and restriction to diffusion is relatively small and, consequently, relatively large displacement values are observed even when diffusion is measured perpendicular to the fiber direction. In the les rats at an age of 33 days, the disease is in a more advanced state and begins to affect the normal process of myelination; however, the rats are more mature. Accordingly, the radial rmsD values of the water molecules in the les spinal cords at this age are smaller than in spinal cords of 20- and 180-day-old rats, implying that, in the 33-day-old les rats, there is relatively more hindrance or restriction to diffusion. This could be a result of myelination, which is still competing to some extent with the les pathology. In addition, in the 33-day-old les spinal cord, the axonal membrane is still intact in many of the axons, as shown in Fig. 7G. The data show that, at the age of 180 days, however, the displacement values are large, even somewhat larger than those of the 20-day-old les spinal cords. This is a result of a much reduced hindrance and restriction, caused by a lack of myelin in 180-day-old les rats. At this point, the disease ‘wins’ over the maturation process and myelination is severely reduced. It is also important to note that the increase in rmsD⊥ with an increase in diffusion is larger in les than in control spinal cords, but is still somewhat smaller than that which would be expected from Gaussian diffusion. Again, this may originate from the fact that, as shown in Figs 7C and 7G, despite the disappearance of most of the myelin, the axonal membranes seem to be intact in many axons which, in turn, may impose some restriction. Nevertheless it seems that, in the case of the les group, exchange may now be more important. For rmsD∥, the change with an increase in diffusion time was almost equal to that which was expected from the Einstein equation, an expected result as restriction is only marginal in this direction.
An interesting result of this study is that the FA index (i.e. FA-QSI) is an inferior index compared with the perpendicular radial mean displacement for distinguishing between the control and les groups (see Figs 5 and 6). Larger FA values were found, as expected, for controls when compared with les spinal cords. These FA values increased with an increase in diffusion time and with the maturation of the rats, and were found to be smaller in les rats compared with the controls. For the controls, these results were expected, implying that the more aged spinal cords are more myelinated, showing a larger restriction. It is interesting to note that the differences between the two groups were less significant when FA values were used instead of radial rmsD. Indeed, if the pathology causes an increase in the displacement in both directions, the changes in FA would be suppressed. Our results show that the radial rmsD is the best index to follow the les pathology for all age groups. These results are in line with those of several recent studies in other models of dysmyelination [24,25,33,34], but differ from the results obtained by Song et al. [32], where no changes were observed in axial diffusivity. To conclude, our study shows that high q-value diffusion measurements provide a useful means to distinguish between les and control spinal cords. QSI measurements with longer diffusion times which allow the water molecules to experience more barriers are even more useful for distinguishing between the groups. The radial rmsD is the most suitable index to follow les pathology in all ages. The extracted indices and the differences in these indices between the two groups depend on the diffusion time, and therefore it seems more appropriate to use the terms apparent FA and apparent mean displacement, especially when high q- or b-value diffusion data are analyzed [24].
Acknowledgements
I.D.D. was supported by grants from the Oscar Rennebohm Foundation and the Elser Doolittle Foundation. Y.C. and D.A. thank the US–Israel Binational Foundation (BSF, grant number 2003353), Jerusalem, Israel.
Abbreviations used
- CNS
central nervous system
- DTI
diffusion tensor MRI
- FA
fractional anisotropy
- FWHM
full width at half-maximum
- les
Long Evans shaker
- MBP
myelin basic protein
- md
myelin-deficient
- PFA
paraformalde-hyde
- QSI
q-space diffusion MRI
- rmsD
root-mean-square displacement
- ROI
region of interest
- SNR
signal-to-noise ratio
- WM
white matter
REFERENCES
- 1.Jones DK, editor. Diffusion MRI, Theory, Methods and Applications. Oxford University Press; Oxford: 2011. [Google Scholar]
- 2.Stejskal EO, Tanner JE. Spin diffusion measurements: spin echoes in the presence of a time dependent field gradient. J. Chem. Phys. 1965;42:288–292. [Google Scholar]
- 3.Niendorf T, Dikhuizen RM, Norris DG, van Lookeren Campagne M, Nicolay K. Biexponential diffusion attenuation in various states of brain tissue: implications to diffusion-weighted imaging. Magn. Reson. Med. 1996;36:847–857. doi: 10.1002/mrm.1910360607. [DOI] [PubMed] [Google Scholar]
- 4.Assaf Y, Cohen Y. Non mono-exponential attenuation of the water and N-acetyl-aspartate signals due to diffusion in brain tissue. J. Magn. Reson. 1998;131:69–85. doi: 10.1006/jmre.1997.1313. [DOI] [PubMed] [Google Scholar]
- 5.Pfeuffer J, Provencher SW, Gruetter R. Water diffusion in rat brain in vivo as detected at very large b values is multi-compartmental. MAGMA. 1998;8:98–108. doi: 10.1007/BF02590526. [DOI] [PubMed] [Google Scholar]
- 6.Mulkern RV, Gudbjartsson H, Westin CF, Zengingonul HP, Gartner W, Guttmann CRG, Robertson RL, Kyriakos W, Schwartz R, Holtzman D, Jolesz FA, Maier SE. Multi-component apparent diffusion coefficients in human brain. NMR Biomed. 1999;12:51–62. doi: 10.1002/(sici)1099-1492(199902)12:1<51::aid-nbm546>3.0.co;2-e. [DOI] [PubMed] [Google Scholar]
- 7.Clark CA, Le-Bihan D. Water diffusion compartmentation and anisotropy at high b values in the human brain. Magn. Reson. Med. 2000;44:852–859. doi: 10.1002/1522-2594(200012)44:6<852::aid-mrm5>3.0.co;2-a. [DOI] [PubMed] [Google Scholar]
- 8.Assaf Y, Cohen Y. Assignment of the water slow diffusing component in CNS using q-space diffusion MRS: implications to fiber tract imaging. Magn. Reson. Med. 2000;43:191–199. doi: 10.1002/(sici)1522-2594(200002)43:2<191::aid-mrm5>3.0.co;2-b. [DOI] [PubMed] [Google Scholar]
- 9.Callaghan PT, MacGowan D, Packer KJ, Zelaya FO. High resolution q-space imaging in porous materials. J. Magn. Reson. 1990;90:177–182. [Google Scholar]
- 10.Cory DG, Garroway AN. Measurement of translational displacement probabilities by NMR – an indicator of compartmentation. Magn. Reson. Med. 1990;14:435–444. doi: 10.1002/mrm.1910140303. [DOI] [PubMed] [Google Scholar]
- 11.King MD, Houseman J, Roussel SA, Van Bruggen N, Williams SR, Gadian DG. Q-space imaging of the brain. Magn. Reson. Med. 1994;32:707–713. doi: 10.1002/mrm.1910320605. [DOI] [PubMed] [Google Scholar]
- 12.King MD, Houseman J, Gadian DG, Connelly A. Localized q-space imaging of the mouse brain. Magn. Reson. Med. 1997;38:930–937. doi: 10.1002/mrm.1910380612. [DOI] [PubMed] [Google Scholar]
- 13.Kuchel PW, Coy A, Stilbs P. NMR “diffusion diffraction” of water revealing alignment of erythrocytes in a magnetic field and their dimensions and membrane transport characteristics. Magn. Reson. Med. 1997;37:637–643. doi: 10.1002/mrm.1910370502. [DOI] [PubMed] [Google Scholar]
- 14.Torres AM, Michniewicz RJ, Chapman BE, Young GAR, Kuchel PW. Characterization of erythrocyte shapes and sizes by NMR diffusion-diffraction of water: correlation with electron micrographs. Magn. Reson. Imaging. 1998;16:423–434. doi: 10.1016/s0730-725x(98)00005-8. [DOI] [PubMed] [Google Scholar]
- 15.Torres AM, Taurins AT, Regan DG, Chapman BE, Kuchel PW. Assignments of coherence features in NMR q-space plots to particular diffusion modes in erythrocyte suspensions. J. Magn. Reson. 1999;138:135–143. doi: 10.1006/jmre.1998.1701. [DOI] [PubMed] [Google Scholar]
- 16.Assaf Y, Mayk A, Cohen Y. Displacement imaging of spinal cord using q-space diffusion-weighted MRI. Magn. Reson. Med. 2000;44:713–722. doi: 10.1002/1522-2594(200011)44:5<713::aid-mrm9>3.0.co;2-6. [DOI] [PubMed] [Google Scholar]
- 17.Nossin-Manor R, Duvdevani R, Cohen Y. q-Space high b value diffusion MRI of hemi-crush in rat spinal cord: evidence for spontaneous regeneration. Magn. Reson. Imaging. 2002;20:231–241. doi: 10.1016/s0730-725x(02)00470-8. [DOI] [PubMed] [Google Scholar]
- 18.Cohen Y, Assaf Y. High b-value q-space analysis diffusion-weighted MRS and MRI in neuronal tissues – a technical review. NMR Biomed. 2002;15:516–542. doi: 10.1002/nbm.778. [DOI] [PubMed] [Google Scholar]
- 19.Assaf Y, Ben-Bashat D, Chapman J, Peled S, Biton IE, Kafri M, Segev Y, Hendler T, Korczyn AD, Graif M, Cohen Y. High b-value q-space analyzed diffusion weighted MRI: application to multiple sclerosis. Magn. Reson. Med. 2002;47:115–126. doi: 10.1002/mrm.10040. [DOI] [PubMed] [Google Scholar]
- 20.Assaf Y, Mayk A, Eliash S, Speizer Z, Cohen Y. Hypertension and neuronal degeneration in excised rat spinal cord studied by high b-value q-space diffusion magnetic resonance imaging. Exp. Neurol. 2003;184:726–736. doi: 10.1016/S0014-4886(03)00274-7. [DOI] [PubMed] [Google Scholar]
- 21.Nossin-Manor R, Duvdevani R, Cohen Y. Effect of experimental parameters on high b-value q-space MR images of excised rat spinal cord. Magn. Reson. Med. 2005;54:96–104. doi: 10.1002/mrm.20519. [DOI] [PubMed] [Google Scholar]
- 22.Biton IE, Mayk A, Kidron D, Assaf Y, Cohen Y. Improved detectability of experimental allergic encephalomyelitis in excised swine spinal cords by high b-value q-space DWI. Exp. Neurol. 2005;195:437–446. doi: 10.1016/j.expneurol.2005.06.011. [DOI] [PubMed] [Google Scholar]
- 23.Biton IE, Duncan ID, Cohen Y. High b-value q-space diffusion MRI in myelin deficient rat spinal cords. Magn. Reson. Imaging. 2006;24:161–166. doi: 10.1016/j.mri.2005.10.029. [DOI] [PubMed] [Google Scholar]
- 24.Biton IE, Duncan ID, Cohen Y. q-Space diffusion of myelin-deficient spinal cords. Magn. Reson. Med. 2007;58:993–1000. doi: 10.1002/mrm.21389. [DOI] [PubMed] [Google Scholar]
- 25.Bar-Shir A, Duncan ID, Cohen Y. QSI and DTI of excised brains of the myelin-deficient rat. Neuroimage. 2009;48:109–116. doi: 10.1016/j.neuroimage.2009.06.019. [DOI] [PubMed] [Google Scholar]
- 26.Lu H, Jensen JH, Ramani A, Helpern JA. Three dimensional characterization of non-gaussian water diffusion in humans using diffusion kurtosis imaging. NMR Biomed. 2006;19:236–247. doi: 10.1002/nbm.1020. [DOI] [PubMed] [Google Scholar]
- 27.Beaulieu C. The basis of anisotropic water diffusion in the nervous system—a technical review. NMR Biomed. 2002;15:435–455. doi: 10.1002/nbm.782. [DOI] [PubMed] [Google Scholar]
- 28.Beaulieu C, Allen PS. Determinants of anisotropic water diffusion in nerves. Magn. Reson. Med. 1994;31:394–400. doi: 10.1002/mrm.1910310408. [DOI] [PubMed] [Google Scholar]
- 29.Beaulieu C, Allen PS. An in vitro evaluation of the effects of local magnetic-susceptibility-induced gradients on anisotropic water diffusion in nerve. Magn. Reson. Med. 1996;36:39–44. doi: 10.1002/mrm.1910360108. [DOI] [PubMed] [Google Scholar]
- 30.Ono J, Harada K, Takahashi M, Maeda M, Ikenaka K, Sakurai K, Sakai N, Kagawa T, Fritzzieroth B, Nagai T, Nihei A, Hashimoto S, Okada S. Differentiation between dysmyelination and demyelination using magnetic resonance diffusional anisotropy. Brain Res. 1995;671:141–148. doi: 10.1016/0006-8993(94)01335-f. [DOI] [PubMed] [Google Scholar]
- 31.Gulani V, Webb AG, Duncan ID, Lauterbur PC. Apparent diffusion tensor measurements in myelin-deficient rat spinal cords. Magn. Reson. Med. 2001;45:191–195. doi: 10.1002/1522-2594(200102)45:2<191::aid-mrm1025>3.0.co;2-9. [DOI] [PubMed] [Google Scholar]
- 32.Song SK, Sun S, Ramsbottom MJ, Chang C, Russell J, Cross AH. Dysmyelination revealed through MRI as increased radial (but unchanged axial) diffusion of water. Neuroimage. 2002;17:1429–1436. doi: 10.1006/nimg.2002.1267. [DOI] [PubMed] [Google Scholar]
- 33.Tyszka JM, Readhead C, Bearer EL, Paulter RG, Jacobs RE. Statistical diffusion tensor histology reveals regional dysmyelination effects in the shiverer mouse mutant. Neuroimage. 2006;21:1058–1065. doi: 10.1016/j.neuroimage.2005.08.037. [DOI] [PMC free article] [PubMed] [Google Scholar]
- 34.Wu YC, Field AS, Duncan ID, Samsonov AA, Kondo Y, Tudorascu D, Alexander AL. High b-value and diffusion tensor imaging in a canine model of dysmyelination and brain maturation. Neuroimage. 2011;58:829–837. doi: 10.1016/j.neuroimage.2011.06.067. [DOI] [PMC free article] [PubMed] [Google Scholar]
- 35.Kwiecien JM, O’Connor LT, Goetz BD, Delaney KH, Fletch AL, Duncan ID. Morphological and morphometric studies of the dysmyelinating mutant, the Long Evans shaker rat. J. Neurocytol. 1998;27:581–591. doi: 10.1023/a:1006922227791. [DOI] [PubMed] [Google Scholar]
- 36.O’Connor LT, Goetz BD, Kwiecien JM, Delaney KH, Fletch AL, Duncan ID. Insertion of a retrotransposon in Mbp disrupts mRNA splicing in a new rat mutant. J. Neurosci. 1999;19:3404–3413. doi: 10.1523/JNEUROSCI.19-09-03404.1999. [DOI] [PMC free article] [PubMed] [Google Scholar]