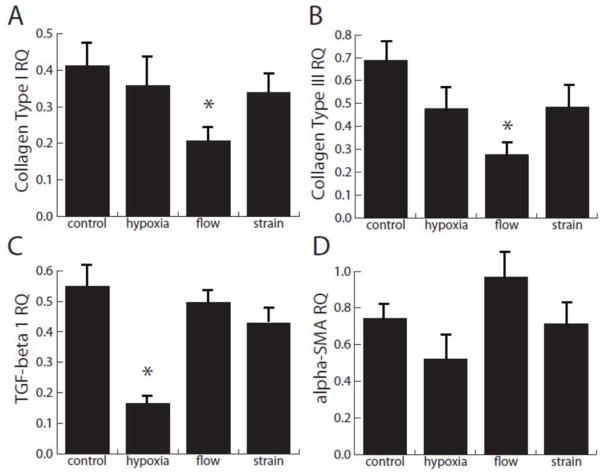
Figure 3.
Quantification of message levels of cardiac fibroblasts at a position approximately 250 μm from the MSC injection site. Four markers of the fibroblast to myofibroblast transition were measured and compared to initial control levels. * denotes significance from the control test condition; all levels are significant from initial levels except αSMA in response to flow.

