

Abstract
The neural mechanisms that produce hallucinations and other psychotic symptoms remain unclear. Previous research suggests that deficits in predictive signals for learning, such as prediction error signals, may underlie psychotic symptoms, but the mechanism by which such deficits produce psychotic symptoms remains to be established. We used model-based fMRI to study sensory prediction errors in human patients with schizophrenia who report daily auditory verbal hallucinations (AVHs) and sociodemographically matched healthy control subjects. We manipulated participants' expectations for hearing speech at different periods within a speech decision-making task. Patients activated a voice-sensitive region of the auditory cortex while they experienced AVHs in the scanner and displayed a concomitant deficit in prediction error signals in a similar portion of auditory cortex. This prediction error deficit correlated strongly with increased activity during silence and with reduced volumes of the auditory cortex, two established neural phenotypes of AVHs. Furthermore, patients with more severe AVHs had more deficient prediction error signals and greater activity during silence within the region of auditory cortex where groups differed, regardless of the severity of psychotic symptoms other than AVHs. Our findings suggest that deficient predictive coding accounts for the resting hyperactivity in sensory cortex that leads to hallucinations.
Introduction
Promising brain markers for schizophrenia have been identified, but how brain abnormalities lead to the core psychotic symptoms of the disorder, such as hallucinations and delusions, is still unknown (Nature Editorial, 2010). Most patients with schizophrenia experience auditory hallucinations in the form of speech—auditory verbal hallucinations (AVHs). Hallucinations, in contrast with delusions, are typically intermittent events lasting a few seconds (Sommer et al., 2008). These temporal features have afforded the design of imaging studies that capture AVH events during external silence. These studies have identified increased activity during AVHs in the auditory cortex and other brain regions involved in speech perception (Sommer et al., 2008; Hoffman et al., 2011; Jardri et al., 2011). Given that stimulation of sensory cortices induces subjective percepts in the corresponding sensory modality (Penfield and Perot, 1963), this increased activity in the auditory cortex is thought to represent a downstream determinant of AVH percepts. However, the upstream neural mechanisms that lead to this increased activity, and thus the mechanisms that produce AVHs, remain unknown.
A growing body of work suggests that disruptions in predictive signals that support learning underlie psychotic symptoms (Fletcher and Frith, 2009). A ubiquitous feature of neural systems is their ability to predict statistical regularities in the environment based on prior experience (Friston, 2010). By encoding predictions and minimizing deviations from these predictions [i.e., by minimizing prediction errors (PEs)], neural systems may attenuate responses to predictable, and thus redundant, events. The updating of predictions, in turn, yields a dynamic internal model of events in the external world and, ultimately, beliefs about their causes. Because predictive codes may drive neural activity in sensory systems (Egner et al., 2010; Keller et al., 2012), subjective perception (Shergill et al., 2003), and belief formation (Friston and Kiebel, 2009), disruptions in predictive coding may underlie the abnormal percepts and false beliefs that define hallucinations and delusions (Friston, 2005; Fletcher and Frith, 2009). Furthermore, in the case of hallucinations, disruptions in such a system for prediction-based attenuation of sensory activity could potentially explain the excess activity of sensory cortex reported in symptom-capturing studies. Recent findings in schizophrenia studies support abnormalities in PE signals for reward (Murray et al., 2008; Gradin et al., 2011) that relate to delusion propensity (Corlett et al., 2007), but mechanistic evidence on how disruptions in predictive coding may produce psychotic symptoms is lacking.
Here we used fMRI to identify disruptions in predictive coding in patients with active AVHs while they performed a speech decision-making task that manipulated the probability of speech stimuli. Our primary hypothesis was that patients with AVHs would have deficient sensory PEs in auditory cortex. In an attempt to link predictive mechanisms to the downstream neural process underlying AVHs, we further assessed whether PE deficits were associated with excess activity of auditory cortex during silence. Finally, because abnormalities in brain structure within the auditory cortex have been consistently linked to AVH (Palaniyappan et al., 2012; Modinos et al., 2013), we assessed whether reduced volumes of this region correlated with the functional deficit in PEs.
Materials and Methods
Participants
Twenty volunteers (10 patients with active, frequent AVHs, 3 females; 10 healthy control subjects, 3 females) recruited from the Columbia University Medical Center community gave written consent to participate in this study, according to the Institutional Review Board of the New York State Psychiatric Institute and the Department of Psychiatry of Columbia University. Patients with schizophrenia or schizoaffective disorder who lacked significant comorbidity were referred from clinicians. Diagnosis was established using the Structured Clinical Interview for the Diagnostic and Statistical Manual of Mental Disorders, 4th edition (Steinberg, 1993), followed by a consensus conference involving at least two psychiatrists. Patients reported AVHs occurring several times per day, every day, in the 2 weeks before the study, without concomitant hallucinations in other modalities. Control subjects had no history of AVH or any psychotic symptoms and had no current psychiatric disorders. None of the participants had a history of neurological disorders, hearing impairment, or active drug use disorders.
Speech decision-making task
We used a low-demand auditory task in which participants simply had to respond to inquiries about the absence or presence of speech percepts (i.e., whether they heard any voices or not) on each trial (Fig. 1A). Sound stimuli (speech stimuli, non-speech stimuli, or no stimuli) were presented in the absence of scanner noise, before scanning periods of image acquisition within a sparse-sampling sequence. Participants were told that they would hear voices on some trials. The question “did you hear any voices?” prompted a response at the end of each trial. Participants were instructed to respond to the question via button press if they heard voices during that trial, regardless of the type or presumed origin of the voices, and to withhold the response if they did not hear voices. Patients with AVHs signaled some blank trials as speech positive (i.e., speech percept without a corresponding stimulus), which we designated as AVH trials. The remaining trials were speech, non-speech, or blank trials (i.e., no percept or stimulus). Approximately 1 h before the scanning session, participants underwent a practice session. Participants were trained for at least 15 min on the task on a computer outside of the scanner until they reached 100% accuracy on 10 consecutive trials. We used a task involving a single perceptual alternative (i.e., speech vs no-speech decisions) to enhance the neural representation of predictive signals associated with a single percept [Summerfield and Koechlin, 2008; in our task, speech predictions (Ps) and PEs], and because the simplicity of the task makes it suitable to study patients with cognitive deficits.
Figure 1.

Schematic of the speech decision-making task and yoked sparse-sampling fMRI sequence. A, Trial types (speech, non-speech, blank, and AVH; top) are defined based on the external stimuli and the subjective percepts reported by participants after each volume acquisition cluster (bottom). The timeline indicates presentation of stimuli before image acquisition. Following image acquisition, participants are asked to indicate whether they heard voices or not on that trial (red rectangles indicate question periods; +/− signs indicate responses). B, The scatterplots show a lack of significant group differences in discrimination accuracy on speech trials (left) and in prediction effects on accuracy (right). Whisker plots indicate group mean and SEM. C, Contrast maps (t statistic and effect size in Cohen's d) depict increased activation in the left auditory cortex during AVH trials compared with blank trials in the nine patients who reported hallucinations in the scanner (peak MNI coordinates: −63, −31, −2 mm; Brodmann area 22). D, Scatterplot of individual contrast estimates in the left auditory region from the voxelwise analysis.
Stimuli.
Trials containing speech stimuli, non-speech stimuli, or no stimuli were arranged pseudo-randomly. Seventy unique speech stimuli consisting of sentences (e.g., “look at you,” “he said so”) were recorded so that speech features relevant to AVHs [Stephane et al., 2003; content: derogatory/neutral, related/unrelated to patient; linguistic features: second/third person, low/high linguistic complexity; acoustic features: male/female gender of speaker, one/several speakers, high/low (60/50 dB) volume, and low/high clarity] were manipulated independently across trials. Non-speech stimuli were obtained from a publicly available database (www.freesounds.org). All stimuli were digitized at a 16 bit/44.1 kHz sampling rate and were volume balanced with Adobe Audition CS5.5. Speech and non-speech stimuli were matched on mean duration (mean ± SD duration, 2.28 ± 1.18 s) and mean amplitude. Stimuli were presented with E-Prime 1.1 through a forward projection system, and delivered binaurally via magnet-compatible, piezoelectric headphones (Resonance Technology Inc.) at 60 dB.
Task structure.
Each trial lasted 16 s. Visually, each trial included a 13 s fixation crosshair followed by a 3 s question, “did you hear any voices?,” both of which were printed in white on a black screen. No scanning took place during this 3 s question (while button responses were recorded) or in the first 7 s of each trial. Intermittent scanning periods (sparse sampling) started at 7 s into the trial and lasted for 6 s. Sound stimuli were presented in the absence of scanner noise (mean ± SD, 4 ± 0.175 s; normal distribution) before scanning periods of image acquisition. Four 12 min blocks each contained 45 trials, for a total of 180 trials presented over 52 min. Blocks with low probability of speech (0.11) alternated with blocks with high probability of speech (0.66) in a counterbalanced order across participants (Fig. 2A, blockwise prediction). The probability of non-speech trials was constant across blocks (0.08). At the end of each block, participants were asked to rate a series of questions, each on a 10-point visual analog scale, regarding their emotional state and the features of speech percepts heard throughout the block.
Figure 2.

Model-based analysis of individual fROI signals. A, Model-fitting and model-derived time series of Ps and PEs for a representative individual. By minimizing differences between the actual and predicted signal (top), our algorithm provides trial-by-trial estimates of P and PE (bottom). Note the approximate correspondence between the blockwise P manipulated by the task and the model-based P estimate. B, BOLD signal from an fROI in the auditory cortex of a representative individual is plotted as a function of PEs (left) and as a function of trial type (right). C, Individual best-fitting parameters by group. Nonzero speech predictions at the beginning of the task (P0, t(19) = 4.78, p = 10−5) reflect that participants in both groups (t(18)= −0.46, p = 0.65, two-sample t test) expected to hear speech, accordingly with task instructions. D, Individual PE effects by group in fROI-based analyses. E, Voxelwise regression of PE time series shows PE signals in auditory cortex for each participant (overlaid on a coronal view of individual T1-weighted images).
We intentionally did not ask patients to signal the onset of AVHs with a button press so as to avoid potential confounds related to planning and execution of the motor response. Instead, we inquired about speech percepts after each brief scanning period. A psychiatrist (G.H.) debriefed patients immediately after scanning to corroborate the experience of AVHs and to estimate the approximate number of AVH episodes in the scanner. The debriefing session served to confirm that all participants had understood the task instructions. Hallucinators further identified the following two separate sources of speech percepts during the task: voice recordings (speech stimuli) and voices recognized as their typical AVH.
Image acquisition
Images were acquired on a GE Healthcare Signa 3T whole-body scanner using an 8-channel, phased-array head coil. T1-weighed sagittal localizing images were followed by an inversion recovery prepared fast spoiled gradient recalled (IR-FSPGR) image (TI = 500 ms, TR = 4.7 ms, TE = 1.3 ms, FOV = 25 cm, matrix = 256 × 256, acceleration factor = 2, 180 slices, slice thickness = 1 mm, providing voxel dimensions of 0.9 × 0.9 × 1.0 mm.). EPI series with an effective resolution of 3.5 × 3.5 × 3.5 mm and whole-brain coverage (TR = 2000 ms, TE = 28 ms, 77° flip angle, single excitation per image, slice thickness = 3.5 mm, FOV = 22.4 cm, matrix = 64 × 64, no skip) were acquired in a sparse-sampling sequence (four series, three volumes per cluster, intercluster interval = 10 s) that minimizes brain activation induced by scanner noise (Schmidt et al., 2008). A single high-resolution EPI volume (same parameters as the EPI series except TR = 6000 ms, TE = 29.1 ms, double excitation per image, matrix = 128 × 128) was additionally acquired for image coregistration.
Data analysis
Functional images.
Image processing and analyses were conducted with SPM8 and MATLAB code. Preprocessing included manual reorientation, coregistration of high-resolution anatomical FSPGR and high-resolution functional EPI volumes, realignment of EPI series, and coregistration to high-resolution EPI, normalization into MNI space, resampling to 3 × 3 × 3 mm3, and spatial smoothing with a 6 × 6 × 6 mm3 full-width at half-maximum (FWHM) Gaussian kernel. Images were corrected for motion by covarying six motion parameters (three rotation and three translation parameters). T1 decay artifacts were corrected by including volume-specific intercepts for the three volumes within each acquisition cluster of the sparse-sampling sequence (Schmidt et al., 2008). Each set of three residualized volumes were then averaged within each cluster, producing one image per trial that underwent global-intensity normalization (Z-normalization across voxels) to remove low-frequency drift.
Preprocessed images entered a general linear model (GLM) in SPM8. No convolution with a hemodynamic response function (HRF) was required because each preprocessed image captured the BOLD signal peak corresponding to one trial; thus, our approach did not require strong assumptions regarding the HRF shape. We used two separate first-level models, GLM1 and GLM2, and two second-level models, each based on one of the first-level models. The first-level GLM1 consisted of a regressor for each trial type (speech, non-speech, blank, and AVH) and four block-specific intercepts. Planned contrasts included [AVH versus blank] and [all stimuli (speech and non-speech) versus blank]. First-level GLM2 had four block-specific intercepts and two regressors corresponding to model-derived estimates (see next paragraph) for speech PE and P time series for each stimulus type [i.e., four regressors: PE during speech trials (positive PEs), P during speech trials, PE during blank trials (negative PEs), and P during blank trials]. Note that, following the reinforcement learning literature, PE signals were modeled separately for speech and blank trials to account for possible differences in positive versus negative PEs.
Two separate second-level, mixed-effects models tested (1) group effects of the contrast (AVH vs blank) from GLM1 within the hallucinator subgroup (i.e., patients with AVHs in the scanner) in a one-sample t test, and (2) group effects of the regression coefficients (β values) corresponding to positive and negative PEs from GLM2 in a group-by-PE-sign ANOVA, respectively. Planned contrasts for the ANOVA included main effects of group (to test the primary hypothesis of group differences in PE signals), main effects of PE sign (positive PEs, negative PEs), and the interaction of group × PE sign. We implemented the GLM2-based ANOVA using a full factorial design in SPM8 (but note that the main effects of group reported here were also observed in a flexible factorial design and in a two-sample t test testing group differences in averaged positive and negative PE β values).
All voxelwise analyses covered all voxels in the brain. Result maps were thresholded at a height of p = 0.005 and to the extent of five adjacent voxels; a false discovery rate (FDR) procedure for topological inference was used to correct for multiple comparisons at the cluster level (Chumbley and Friston, 2009). Findings presented throughout the article are thus significant at p ≤ 0.05, FDR corrected, unless otherwise specified. Note that result maps indicate both the test statistic and effect size.
Model fitting.
Functionally defined regions of interest (fROIs) of the auditory cortex that were responsive to auditory stimuli were defined bilaterally for each participant based on the contrast (all stimuli vs blank). We used a predictive-coding algorithm based on a delta rule implementation analogous to that used in reinforcement-learning models (Egner et al., 2010) to fit the fMRI signal in these fROIs (for a similar approach, see Gläscher and Büchel, 2005). We fit this model to fMRI signal rather than to choice behavior because, unlike in reinforcement learning, sensory learning in the current context is not necessarily associated with overt changes in choice behavior. This algorithm models PEs as the difference between the actual speech input (0 for no speech, 1 for speech) and the predicted speech input [from lowest expectation (p = 0) to highest expectation of speech (p = 1)], and it updates predictions on each trial, t, based on a learning rate, α. Since predictive coding suggests that population responses in the sensory cortex should reflect a summation of activity related to representational units (P) and error units (PE), the algorithm assumes that neural activity Y is a weighted sum of P and PE (Egner et al., 2010).
We estimated the best-fitting solution for the unknown parameters (w1, w2, α, P(t = 0)) for each participant by minimizing the root mean square difference between the predicted signal Y and the actual fMRI signal (comprising 180 time points, corresponding to the number of trials). To ensure noncircularity and to reduce noise in this procedure, the mean best-fitting α for the group was then used to estimate the individual time series of P and PE entered into the first-level model GLM2 (Daw, 2011) for voxelwise analysis. Thus, with this procedure we obtained a single α value that was input into the algorithm to generate P and PE regressors, which were in turn regressed against BOLD signals to obtain statistical maps of P- and PE-related activations. We used a feature detection model that simply modeled signal as passive responses to stimuli (presence vs absence of speech, one unknown parameter) for comparison. We used the Akaike Information Criterion (AIC) for model comparison, as it is appropriate to compare models with different number of parameters (Akaike, 1974).
Anatomical images.
Anatomical analyses used the voxel-based morphometry (VBM) toolbox in SPM8 (http://dbm.neuro.uni-jena.de/vbm/). Image preprocessing included correction for intensity bias, tissue segmentation based on tissue probability maps, denoising, DARTEL normalization, correction for local warping during normalization, and spatial smoothing with a 10 × 10 × 10 mm3 FWHM Gaussian kernel. Although VBM does not provide a direct measure of cortical volume, the “modulated” images of gray matter obtained with this procedure can be interpreted as indexes of the relative amount of gray matter or “volume” in different brain regions, after correcting for brain size.
ROI-based analyses.
We extracted β values from significant clusters (ROI) in the whole-brain, voxelwise analyses of between-group effects described above and used the mean β value across voxels within the significant clusters to produce pairwise correlations and partial correlations between functional effects (PE β values and P β values from GLM2 and β values for blank trials in GLM1), anatomical effects, and clinical measures, as well as mediation analyses. We tested the Cook (1979) distance to assess the influence of potential outliers on the resulting effects from the above-mentioned analyses.
Results
Patients and control subjects were matched sociodemographically (Table 1) and had comparably low motion in the scanner (group differences in cumulative sum for each of six motion parameters, all p > 0.09; mean ± SEM motion for the group: 0.41 ± 0.05 mm translation and 0.007 ± 0.001° rotation).
Table 1.
Sociodemographic and clinical characteristics of the sample
| Participant | Age (years) | Sex | Ethnicity | SES | FSIQ-4 | FSIQ-2 | Handedness | Antipsychotic medication dose (mg/d) |
|---|---|---|---|---|---|---|---|---|
| Patient 1 | 44 | F | AA | 49 | 109 | 109 | R | Ziprasidone (160) |
| Patient 2 | 27 | M | H | 57 | 109 | 118 | R | Olanzapine (30) |
| Patient 3 | 53 | M | H | 45 | 104 | 114 | R | None (0) |
| Patient 4 | 54 | M | C | 35 | 100 | 108 | RL | Risperidone (0.5) |
| Patient 5 | 41 | M | O | 27 | 88 | 98 | R | Aripiprazole (5) |
| Patient 6 | 44 | M | AA | 38 | NRa | NRa | R | Aripiprazole (10) |
| Patient 7 | 42 | M | O | 34 | 100 | 102 | R | Aripiprazole (15) |
| Patient 8 | 41 | F | C | 54 | 115 | 120 | L | Quetiapine (600) |
| Patient 9 | 27 | F | AA | 48 | 105 | 111 | L | Aripiprazole (7.5) |
| Patient 10 | 34 | M | C | 60 | 108 | 119 | R | Olanzapine (15)b |
| Control 1 | 29 | M | C | 45 | 123 | 122 | R | None (0) |
| Control 2 | 34 | M | AA | 29 | 106 | 116 | R | None (0) |
| Control 3 | 27 | M | C | 66 | 129 | 141 | R | None (0) |
| Control 4 | 32 | F | H | 60 | 125 | 131 | R | None (0) |
| Control 5 | 47 | M | O | 51 | 119 | 120 | R | None (0) |
| Control 6 | 38 | M | O | 37 | 120 | 113 | R | None (0) |
| Control 7 | 48 | M | AA | 17 | 99 | 94 | R | None (0) |
| Control 8 | 43 | F | AA | 29 | 85 | 88 | R | None (0) |
| Control 9 | 32 | F | H | 63 | 123 | 119 | R | None (0) |
| Control 10 | 37 | M | AA | 55 | 105 | 106 | R | None (0) |
| Between group statistic (p value) | 1.07c (0.3) | 0d (1) | 0.68d (1) | −0.07c (0.94) | −2.04c (0.06) | −1.19c (0.25) | 3.07d (0.21) | 3.08c (0.006) |
SES, Socioeconomic status (averaged self and family Hollingshead Index of Social Status); FSIQ-4, full-scale IQ test assessed with four subtests of the Wechsler Abbreviated Scale of Intelligence; FSIQ2, full-scale IQ test assessed with two subtests of the Wechsler Abbreviated Scale of Intelligence; F, female; M, male; AA, African American; H, Hispanic; C, Caucasian; O, others; R, right-handedness; L, left-handedness; RL, ambidexterity (as determined with the Edinburgh Handedness Inventory); NR, not reliable.
aIQ testing was not reliable due to significant interference by psychopathology.
bPlus risperidone, 1.5 mg/d.
ct statistic.
dFisher's exact test.
Clinical characteristics of patients
All patients reported chronic, severe AVHs occurring several times per day, every day, despite prolonged treatment with antipsychotic medication (Table 1). None of the patients had hallucinations in modalities other than auditory, and all had a stable diagnosis of schizophrenia (n = 8) or schizoaffective disorder (n = 2), with a mean illness duration of 16 years. Nine patients were treated with atypical antipsychotic medications, and one patient was not receiving antipsychotic medication. All were outpatients. In the prescanning interviews, patients reported hearing clearly one or several voices, mostly conversing voices referring to the patients and addressing them in the second person, which they attributed to an external or internal source in a similar percentage of cases. Hallucinated speech contained derogatory or negative content in most cases, alternating with complimenting voices in some cases, and had variable degrees of linguistic complexity. Patients typically held a delusional belief about the causes of the voices (e.g., they were caused by extraterrestrials or spirits), and these experiences substantially affected their behavior. The postscanning debriefing session indicated that the characteristics of AVHs experienced in the scanner were representative of the usual AVHs reported by patients. Patients had a mean score of 26 on the auditory hallucination subscale of the Psychotic Symptom Rating Scales (PSYRATS-AH) (Haddock et al., 1999), and low scores on the Hamilton scales of anxiety and depression (means of 5 and 7, respectively). Their mean scores on the positive and negative symptom subscales of the positive and negative syndrome scale (PANSS; Kay et al., 1987) were 19 and 22, respectively (Table 2).
Table 2.
Clinical characteristics of the AVH patient group
| Clinical characteristics | Rangea | Mean (SEM) |
|---|---|---|
| PANSS positive scale | ||
| P1. Delusions | 1–7 | 3.8 (0.3) |
| P2. Conceptual disorganization | 1–7 | 2.6 (0.4) |
| P3. Hallucinatory behavior | 1–7 | 5.3 (0.2) |
| P4. Excitement | 1–7 | 1.2 (0.2) |
| P5. Grandiosity | 1–7 | 1.3 (0.2) |
| P6. Suspiciousness/persecution | 1–7 | 3.1 (0.4) |
| P7. Hostility | 1–7 | 1.6 (0.2) |
| Total | 7–49 | 18.9 (0.8) |
| PANSS negative scale, total | 7–49 | 22.3 (1.8) |
| PANSS general psychopathology scale, total | 16–112 | 32.7 (1.9) |
| PANSS total | 30–210 | 73.9 (3.2) |
| PSYRATS-AH Scale | ||
| 1. Frequency | 0–4 | 3.2 (0.3) |
| 2. Duration | 0–4 | 1.9 (0.3) |
| 3. Location | 0–4 | 2.2 (0.4) |
| 4. Loudness | 0–4 | 1.5 (0.2) |
| 5. Beliefs about origin of voices | 0–4 | 2.5 (0.3) |
| 6. Amount of negative content | 0–4 | 1.9 (0.3) |
| 7. Degree of negative content | 0–4 | 2.5 (0.3) |
| 8. Amount of distress | 0–4 | 2.4 (0.2) |
| 9. Intensity of distress | 0–4 | 2.3 (0.3) |
| 10. Disruption to life | 0–4 | 1.9 (0.2) |
| 11. Controllability | 0–4 | 2.4 (0.5) |
| Total | 0–44 | 24.7 (1.3) |
aIndicates the range of possible scores for each item or scale, not the range of scores obtained in the current sample.
Performance on the speech decision-making task
Task performance did not differ between groups, as follows: on average, patients and control subjects correctly identified the presence of speech in 96% and 90% of the speech trials, respectively (median: 99% and 99%, respectively; t(18) = 1.12, p = 0.28; Fig. 1B), and responded correctly in 83% and 91% of all stimulus trials (including speech and non-speech trials: median: 82% and 99%; t(18) = −1.44, p = 0.17), respectively. Performance based on the difference between the probability of hits (i.e., the correct detection of speech in trials in which speech was presented) minus the probability of false alarms (incorrect detection of speech in trials in which speech was not presented) was also comparable between the groups (t(18) = −1.98, p = 0.063), although note that this index underestimates performance in patients by considering AVH trials as incorrect responses. Speech predictability had no effect on response accuracy in either group (p > 0.1), suggesting that both groups performed the task at ceiling levels. All subjective ratings were also comparable between groups (all p ≥ 0.1), including ratings on the loudness of speech percepts.
Activation in the auditory cortex during hallucinations (GLM1-based analysis)
Patients underwent 20.6 ± 7.8 AVH trials (mean ± SEM), whereas control subjects underwent none. The number of AVH trials correlated strongly with scores on the “frequency” item of the PSYRATS-AH (Spearman's ρ = 0.89, p = 6 × 10⁻⁴), indicating that AVH trials likely reflected actual AVH events rather than incorrect responses reflecting false alarms. One of the 10 patients experienced no AVH events in the scanner.
In the hallucinator subgroup of patients who had experienced AVHs in the scanner, only the left superior temporal sulcus displayed greater activation during AVH trials compared with blank trials (p = 0.001, uncorrected; p = 0.05, small volume corrected using a 10 mm sphere around the MNI coordinates [x, y, z]: −68, −36, 8 mm, the peak of AVH effects in auditory cortex; Horga et al., 2011; Fig. 1C,D). This effect fell within the regions showing greater activation to speech stimuli than to non-speech stimuli, indicating that voice-selective regions of the auditory cortex are involved in AVHs (Horga et al., 2011). The posterior thalamus and the ventral tegmental area activated less during AVH trials than during blank trials.
Predictive coding explains activations in the auditory cortex
We fitted a predictive-coding model to the averaged signal within fROIs of the auditory cortex that were responsive to auditory stimuli (Materials and Methods; Fig. 2). The best-fitting learning rate, α, for the group was 0.24 (mean ± SEM α values: 0.24 ± 0.01 in patients; 0.24 ± 0.04 in control subjects; t(18) = −0.05, p = 0.96). The predictive-coding model accounted on average for 27% of the variance in the fROI signals (mean r2 = 0.3 in patients; mean r2 = 0.23 in control subjects), while a feature detection model, which explained the signal based only on responses to stimuli, accounted for 19% of this variance (mean r2 = 0.22 in patients; mean r2 = 0.15 in control subjects; Fig. 2B). An analysis of the ROI signal only for blank trials showed that the predictive-coding model accounted on average for 18% of the individual variance (mean r2 = 0.18 in patients; mean r2 = 0.18 in control subjects), whereas the feature detection model accounted for none of this variance, indicating the existence of predictive signals in the auditory cortex even in the absence of external stimuli. Model selection based on the AIC also favored the predictive-coding model over the feature detection model in 19 of the 20 participants (mean [AICPC − AICFD] = −17.05; the feature detection model was 10−4 times as likely as the predictive-coding model). These results together provide compelling evidence that a model of auditory perception that entails learning to optimize stimulus predictions explains activations in the auditory cortex that go beyond passive responses to external inputs.
We used AIC to compare variants of the predictive-coding model. The predictive-coding model was superior to a variant with separate learning rates for positive and negative PEs (α+ and α−), and to another variant that modeled the predicted signal as a weighted sum of speech PE, speech prediction, and speech input. Similarly, model selection favored the original predictive-coding model over a variant that considered AVH events as speech input. Finally, an additional analysis confirmed that activations in the auditory cortex bilaterally, but not activations in other regions of the brain, were indeed PEs, as defined in Equation 1. Consistent with this definition, a conjunction analysis confirmed that the auditory cortices showed effects of both speech stimuli (the actual input) and speech P (the predicted input; p < 0.001, corrected) that were opposite in sign but similar in magnitude (mean ± SEM β value for speech stimuli and speech P, respectively: 0.34 ± 0.06 and −0.3 ± 0.06 in patients; 0.42 ± 0.08 and −0.38 ± 0.07 in control subjects; both p > 0.05, paired t tests of absolute β values).
Deficit in prediction error signaling in the auditory cortex in patients (GLM2-based analysis)
Using the group mean of the best-fitting parameters (α = 0.24, P0 = 0.1), we generated individual time series of speech predictions and PEs for each participant. We identified BOLD signals tracking PEs in the auditory cortex of all 20 participants (Fig. 2E). We then modeled PEs for speech trials (positive PEs) and blank trials (negative PEs) in a group × PE sign ANOVA. Our main finding was that patients, compared with control subjects, had weaker PE signals in the superior temporal sulcus and middle temporal gyrus within the right auditory cortex (p = 0.04, corrected; 102 adjacent voxels; Fig. 3). No other brain regions displaying PE signals showed significant differences between patients and control subjects in either direction in a whole-brain, voxelwise analysis.
Figure 3.

Voxelwise analyses of PE signals. From left to right, Regions of the auditory cortex in which activity tracks PEs in patients, control subjects, and both. Patients show weaker PE signals in the right auditory cortex (peak MNI coordinates: 69, −31, −8 mm; Brodmann areas 21–22). Color maps represent t statistic and effect size in Cohen's d.
The magnitude of the PE deficit in patients did not correlate with performance on the task, or any clinical, neuropsychological, or socioeconomic variables (ROI-based correlations with mean PE β values within the significant cluster of group differences, all p > 0.32), including duration of illness (p = 0.88) and severity of AVHs, as measured by the PSYRATS-AH total score, the PANSS, the reported number of AVHs in the postscanning debriefing session, or the number of AVH trials in the scanner. The timing of PE signals was equivalent in patients and control subjects (no significant group × volume effects on the mean PE β values from the auditory fROI were apparent in a repeated-measures ANOVA, p = 0.24), suggesting that PEs in patients were abnormal in magnitude rather than in timing. We also detected strong PE signals across all nine hallucinators in the voxels within the auditory cortex fROI where AVH effects were strongest for each patient (at least 2 SDs above the participant mean, AVH t(8) = 3.29, p = 0.011; PE t(8) = 6.02, p = 0.0003; interaction t(8) = −1.97, p = 0.083).
Bilateral regions of the auditory cortex showed both positive PEs during speech trials and negative PEs during blank trials in a conjunction analysis including all participants (p < 0.001, corrected); the main effect of PE sign (positive, negative) was not significant in these regions, indicating that PE signals in the auditory cortex were signed (i.e., activations increased with more positive PEs for positive and negative PEs alike). However, the main effect of PE sign across all participants was significant in the anterior cingulate, in a region extending from the midbrain to the medial thalamus, in the ventral striatum, and in the right inferior parietal cortex (p ≤ 0.002, corrected). Of these, only in the anterior cingulate did patients have smaller differences between positive and negative PEs than control subjects (group × PE sign interaction; p = 0.05, corrected).
Prediction signals and their relationship to prediction errors
Speech prediction signals across all participants were apparent in a distributed set of cortical and subcortical regions, including the posterior and perigenual anterior cingulate cortices, dorsolateral prefrontal cortex (DLPFC) bilaterally (Brodmann area 46), fusiform and parahippocampal cortices, striatum, and lateral thalamus (p < 0.001, corrected). Prediction signals in bilateral DLPFC and cingulate cortices were common to both groups (p < 0.001, uncorrected; Fig. 4). Compared with control subjects, patients had weaker speech prediction signals in right parahippocampal-hippocampal regions extending caudally to the fusiform gyrus, and rostrally to the lateral thalamus, left lateral thalamus-hippocampus, and left ventral striatum (Fig. 4A). The magnitude of the deficit in prediction signals across these three functional clusters and participants correlated positively with the magnitude of the deficit in PE signals in the right auditory cortex (Fig. 4A), although this difference disappeared after controlling for group (p = 0.57). Prediction signals in the regions of the bilateral DLPFC that had P effects in both groups also correlated with PE signals in the right auditory cortex, even after controlling for group (r = 0.56, p = 0.014; Fig. 4B). This interrelation of predictions and PEs is expected given that their computation depends on one another (see Eq. 2), and corroborates previous reports indicating an interdependence between frontal predictions and sensory PEs (Summerfield et al., 2006; Rahnev et al., 2011).
Figure 4.

Differential and common effects of prediction signals between groups. A, Regions with weaker P signals in patients relative to control subjects (all p < 0.037, corrected). The scatterplot shows a positive correlation between pooled prediction signals from the latter analysis and PE signals in the right auditory ROI (from the significant cluster of group differences shown in Fig. 3). B, Common prediction signals in bilateral portions of the DLPFC across groups, and correlation between prediction signals in this region and PE signals in the right auditory cortex.
Effects of medication on prediction error signaling
Given that antipsychotic medications typically ameliorate AVHs, we expected that antipsychotic medications would normalize the PE deficit. Indeed, patients receiving higher doses of antipsychotic medication had more normal PE signals in the auditory cortex (Fig. 5A). Although this analysis cannot conclusively exclude the possible confounding effects of medication (and does not account for the reasons for dose prescription), it does suggest that the patients driving the PE deficit were those with lower doses of medication and, therefore, that medication did not explain the PE deficit detected in patients.
Figure 5.
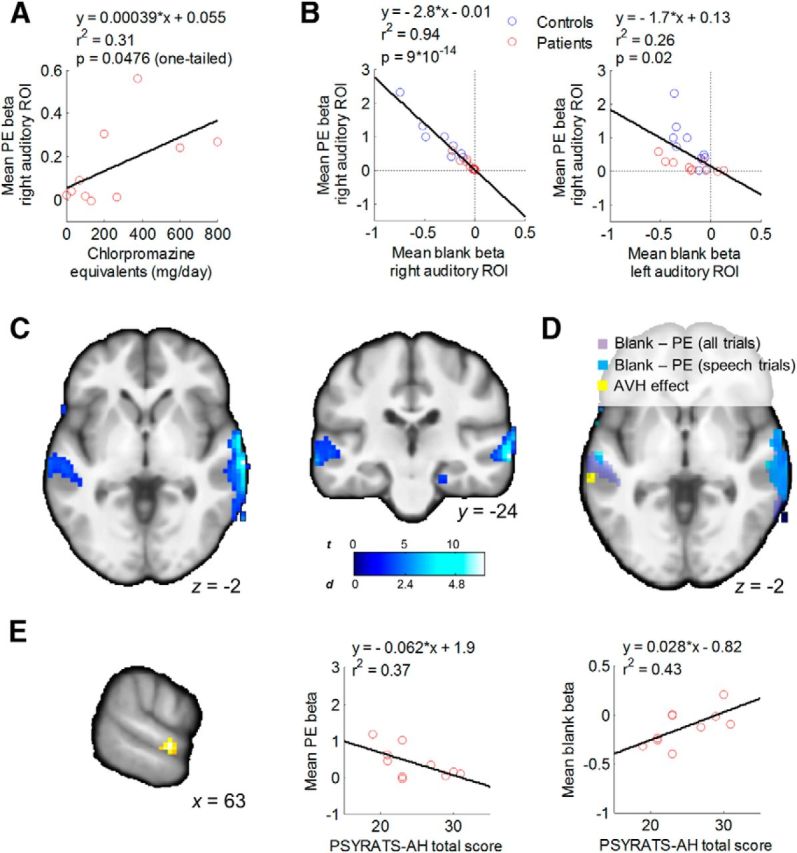
Deficient PEs account for individual differences in activity of the auditory cortex during silence. A, Correlation between PE deficit in patients and dose of antipsychotic medication. B, Correlations between the PE deficit in the right auditory cortex and activity during blank trials in the same region (left), and a contralateral region showing increased activation during AVH in patients (right; Fig. 1C). These effects remained after controlling for group (r2 = 0.92, p = 10−12, and r2 = 0.33, p = 0.009, respectively, in the right and left auditory cortex). C, D, Voxelwise regression analyses that localize the effect of the PE deficit on blank trial activity to the auditory cortex bilaterally but not to other regions. E, Conjunction of correlations between AVH severity and both PE magnitude and activity during blank trials in the right auditory cortex within patients. Scatterplots indicating the direction of the pairwise relationships between the corresponding β values from the cluster (left) and AVH severity are shown (middle and right).
Prediction error deficit and faulty attenuation of activity in the auditory cortex
Compared with control subjects, patients showed increased activity during silence (β for blank trials in GLM1; see Materials and Methods) in the right but not left auditory cortex (right: t(18) = 2.77, p = 0.013; left: t(18) = 0.19, p = 0.85; based on ROIs from Figs. 3 and 1C, respectively). This finding suggests that patients have increased baseline activity in the (right) auditory cortex even in the absence of AVH percepts, consistent with prior findings of increased activity in right auditory cortex preceding left-lateralized activations during AVHs (Hoffman et al., 2011).
Supporting our hypothesis, participants with weaker PE signals in the right auditory cortex had greater activity during blank trials in left and right auditory cortices (Fig. 5B), even when PE signals were estimated for speech trials only (right: r2 = 0.8, p = 10−8; left: r2 = 0.14, p = 0.09) and after controlling for chlorpromazine equivalents (right: r2 = 0.8, p = 10−7; left: r2 = 0.27, p = 0.022, partial correlation). A voxelwise analysis confirmed this effect (p ≤ 0.05, corrected; Fig. 5C,D).
Given the coexistence of deficits in prediction and PE signals in patients, either prediction or PE deficits could potentially mediate the effects of the other on auditory activation during silence. A mediation analysis suggested that the PE deficit mediated the effect of the prediction deficit on bilateral auditory activity during blank trials (mean ± SE ab path coefficient = −0.69 ± 0.25, p = 0.005, Sobel test), but not the other way around (0.05 ± 0.03, p = 0.1). Together, these analyses suggest that a neural phenotype of AVH consisting of increased activity of the auditory cortex in the absence of external auditory stimuli is strongly associated with a deficit in PE signaling within the auditory cortex.
Neural correlates of hallucination severity across patients
Even though we failed to detect the expected correlation between the magnitude of the PE deficit and AVH severity at the a priori threshold, we further explored whether patients with more severe AVH had both increased activity during silence and more deficient PEs within the observed region of deficient PEs in the right auditory cortex in patients. Testing the conjunction of the three corresponding effects at p = 0.05 and five adjacent voxels, we found a cluster of voxels within this region of right auditory cortex that exhibited the expected correlations with PSYRATS-AH total scores, as follows: a positive correlation with activity during blank trials and a negative correlation with PE magnitude (t(8) = 2.96, p = 0.009, uncorrected; and t(8) = 3.66, p = 0.003, uncorrected, respectively; Fig. 5E). Furthermore, this conjunction effect persisted after adjusting for the severity of positive symptoms other than hallucinations (total PANSS-P score excluding the hallucination item P3; p = 0.034 and p = 0.018, respectively). Although these results need to be regarded as preliminary, they provide tentative support for the notion that deficient prediction errors and the subsequent increase in activity during silence in auditory cortex are related specifically to AVHs.
Anatomical abnormalities associated with prediction error deficit
Giving further validity to our findings, a VBM analysis showed that participants with smaller volume of the right superior temporal sulcus and middle temporal gyrus had greater PE deficits (Fig. 6). Controlling for volume in this region, however, did not eliminate the between-group difference in PE signals in the right auditory cortex (p = 0.005). Thus, the functional deficit in PE signaling was related to a decreased volume of a neighboring region of the auditory cortex but likely was not the consequence of only local volume abnormalities. A between-group comparison did not reveal significant differences in gray matter volume.
Figure 6.

Structure–function correlation. Maps show a correlation between gray matter volume in the right auditory cortex and the functional deficit in PEs in a similar region of the auditory cortex (significant cluster in the group comparison from Fig. 3). The scatterplot shows this relationship across participants using averaged data from the significant cluster in the VBM analysis. This relationship remained (r2 = 0.36, p = 0.007) after removing an outlier point corresponding to the VBM measure for one healthy participant (Cook's distance = 1.63).
Discussion
Our findings support the hypothesis that deficient predictive coding underlies psychotic symptoms in schizophrenia (Friston, 2005; Fletcher and Frith, 2009). Patients with active AVHs displayed weaker sensory PE signals in the right auditory cortex compared with control subjects. This weakening in PE signals was not better explained by behavioral, neuropsychological, or sociodemographic variables, or by illness duration or medication status. Patients displayed AVH-related increases in the activation of the left auditory cortex, within voice-selective regions along the superior temporal sulcus and gyrus (Belin et al., 2000). Increased activity of this and other regions of the auditory cortex in the absence of external auditory stimuli, a neural phenotype linked to AVHs, correlated strongly with the magnitude of the deficit in PE signals across individuals. We additionally found tentative support for a specific correlation between hallucination severity and both deficient PEs and excess activity within the auditory region in which patients displayed the PE deficit. Finally, our structure–function findings relate this predictive-coding deficit to a widely replicated anatomical marker of AVH consisting of volume reduction of the auditory cortex.
Our results are consistent with previous findings supporting predictive-coding models of sensory functioning (Rao and Ballard, 1999; Summerfield et al., 2006; Summerfield and Koechlin, 2008; Keller and Hahnloser, 2009; Egner et al., 2010; Meyer and Olson, 2011; Zelano et al., 2011; Keller et al., 2012; Todorovic and de Lange, 2012). Speech PEs accounted for ∼30% of the variance in auditory cortex signals from both patients and healthy individuals, and for ∼20% of this variance during silence. Because none of the signal variance during silence can be explained by passive or attention-amplified responses to stimuli, these findings emphasize the role of predictive coding in the auditory system.
Critically, the current study uncovered deficient PE signals in the auditory cortex of actively hallucinating patients with schizophrenia. Our results are consistent with previous studies showing deficient predictive mechanisms in schizophrenia. In particular, event-related potential (ERP) studies have shown that the normal dampening of auditory response to self-generated speech is reduced in patients with schizophrenia (Ford et al., 2001), especially in those with frequent hallucinations (Heinks-Maldonado et al., 2007). Because efference copies of motor commands herald the sensory consequences of self-generated actions, making them predictable, self-uttered speech is more predictable than non-self-uttered or distorted speech. These ERP findings have thus been taken to suggest a dysfunction of the efference copy system that contributes to a misperception of self-generated thoughts as hallucinations. Favoring this interpretation, a behavioral study (Shergill et al., 2005) showed that the normal attenuation of self-generated forces is diminished in patients with schizophrenia, suggesting a dysfunction in their ability to predict the sensory consequences of their actions. However, such ERP and behavioral findings may reflect a more general impairment in predictive-coding mechanisms, regardless of whether sensory predictions originate in the motor system (i.e., efference copies of self-generated actions) or in nonmotor systems, as in the current study (predictions in our task were based on recent sensory experience in the auditory modality, not on self-generated actions). Because mismatch negativity (MMN), an auditory ERP to unexpected stimuli, and oddball responses can both be explained as indexes of (motor-independent) sensory PEs (Schindel et al., 2011; Wacongne et al., 2012), an interpretation in terms of a general dysfunction in predictive coding could reconcile a large body of longstanding findings showing robust deficits in MMN (Umbricht and Krljes, 2005) and oddball effects (Jeon and Polich, 2001; Kiehl et al., 2005) in schizophrenia. Our findings of a dose-dependent normalization of the PE deficit with antipsychotic medication and the correlation between this deficit and a state-dependent, functional phenotype of AVH (i.e., increased activity in the auditory cortex in the absence of external stimuli), as well as with severity of AVH further suggest that deficient predictive coding might represent a state marker, and potentially a pathophysiological mechanism, of psychotic symptoms.
Dose-dependent normalization of PEs in patients treated with antipsychotic medications that act via blockade of D2 receptors may suggest a role of dopamine in predictive coding. Further supporting this role, patients had abnormal P signals in mesolimbic areas, such as the ventral striatum, which are densely innervated by dopaminergic neurons. While in reinforcement learning dopaminergic neurons encode reward PEs (Tobler et al., 2005), in predictive coding dopamine is hypothesized to modulate PEs (Friston, 2010). Dopamine may exert this modulation by influencing GABA release in the thalamus and other regions (Mrzljak et al., 1996; Florán et al., 2004). Thus, aberrant dopaminergic transmission in schizophrenia patients (Frank, 2008; Howes et al., 2012) could potentially alter the inhibitory signals required for PE signaling in a way that could be rescued with dopamine-blocking medications.
We hypothesized that impaired predictive-coding mechanisms for the attenuation of sensory activity may explain the excess activity in the auditory cortex during silence reported in AVH-capturing studies (Cleghorn et al., 1990; Silbersweig et al., 1995; Diederen et al., 2010; Hoffman et al., 2011; Horga et al., 2011). Building on these studies, we found that this excess activity during silence correlated strongly with the magnitude of the PE deficit across participants. We also found preliminary evidence for a correlation between both excess activity and PE deficits in auditory cortex with severity of hallucinations but not of other psychotic symptoms. Our findings are further compatible with a model of pathogenesis in which deficient PEs mediate the effects of abnormal predictive coding on activations in voice-selective regions of the auditory cortex. Presumably, weakening of feedforward PEs from lower to higher levels of the auditory pathway could explain sustained levels of cortical activation leading to hallucinatory percepts, regardless of sensory inputs. In particular, weakening of negative PEs, which should normally attenuate sensory activity in the absence of stimuli, might be responsible for this attenuation to fail. This model assumes that such input-independent hyperactivity of the auditory cortex is a downstream process that ultimately causes subjective percepts in the auditory modality. In favor of this assumption, direct stimulation of the superior temporal cortex induces complex auditory percepts, commonly voices (Penfield and Perot, 1963). Also, partial epileptic seizures affecting the lateral temporal lobe sometimes present with speech percepts (Michelucci et al., 2000). Moreover, converging evidence indicates that activity in the auditory cortex represents subjective aspects of auditory percepts (Kilian-Hütten et al., 2011; Mesgarani and Chang, 2012).
Our working model of AVH may accommodate previous findings in the literature, including the reduction of gray matter volume in the auditory cortex associated with AVH (Palaniyappan et al., 2012; Modinos et al., 2013). Our finding that decreases in gray matter volume correlated with but did not fully explain the PE deficit in the auditory cortex suggests that volume loss in this region may represent activity-dependent neural adaptations secondary to deficient predictive signals. This interpretation is consistent with the observation that progressive loss of gray matter in the temporal cortex occurs at relatively early stages of schizophrenia (Vita et al., 2012). Nonetheless, volume loss could possibly reflect abnormalities in cortical feedback contributing to deficient PEs at the onset of clinical psychosis or even at preclinical stages, as structural deficits of the temporal cortex have been identified at those stages (Leung et al., 2011; Cullen et al., 2013).
We considered alternative interpretations for our findings. First, contrary to our hypothesis, hallucination events could have caused the observed disruption in PEs. However, the absence of a significant correlation between the number of AVH trials and the PE effects across participants, and the absence of a significant interaction between AVH and PE effects within patients, weigh against this interpretation. Second, a persistently heightened expectancy for speech could potentially cause AVHs. However, this hypothesis would predict patients to have increased speech prediction at the beginning of the task (P0), stronger negative PEs, and weaker positive PEs than control subjects, and reduced baseline activity in auditory cortex, all contrary to our observations.
Our study has several limitations. Our modest sample size increases the risk of false-negative findings (other than the main hypothesized effects, which we detected) and of effect size inflation. The absence of a control group of patients without AVH precluded definitive conclusions into the specificity of predictive-coding deficits to AVH as opposed to other psychotic symptoms. Nonetheless, our dimensional approach correlating PE deficits to interindividual variability in two robust neurobiological markers of AVH and to AVH severity specifically links predictive-coding deficits to AVH and, in addition, places PE deficits at a central crossroad along the neurobiological pathway leading to AVH.
Our study supports the idea that deficient predictive coding may be a core pathophysiological mechanism underlying psychotic symptoms (Friston, 2005; Fletcher and Frith, 2009). Different etiological factors of psychosis may produce neural anomalies (including impairments in precision coding or inhibitory prediction signals) that are distinct but that nevertheless converge in abnormally weak PE signals and reduced updating of internal predictions based on sensory evidence. Individuals with such an internal model of the environment, which relies more heavily on prior expectations and less on sensory evidence, may thus perceive voices in the absence of corresponding stimuli and hold false beliefs about their origin despite evidence for the contrary.
Footnotes
This work was supported in part by National Institute of Mental Health Grants MH089582 and K02-74677, National Institutes of Health Grant 2KL2RR024157-06, and grants from the Alicia Koplowitz Foundation of Spain, the Italian Academy for Advanced Studies in America at Columbia University, and the Brain and Behavior Research Foundation (formerly the National Alliance for Research on Schizophrenia and Depression). We thank Tiago V. Maia, Anna B. Konova, Daniel C. Javitt, Christoph Kellendonk, and Holly Moore for discussions and comments on preliminary findings; Zhishun Wang, Pengwei Wang, and Feng Liu for technical support; and Nidhi Parashar for assistance with data collection.
The authors declare no competing financial interests.
References
- Akaike H. New look at statistical-model identification. IEEE Trans Automat Contr. 1974;19:716–723. doi: 10.1109/TAC.1974.1100705. [DOI] [Google Scholar]
- Belin P, Zatorre RJ, Lafaille P, Ahad P, Pike B. Voice-selective areas in human auditory cortex. Nature. 2000;403:309–312. doi: 10.1038/35002078. [DOI] [PubMed] [Google Scholar]
- Chumbley JR, Friston KJ. False discovery rate revisited: FDR and topological inference using Gaussian random fields. Neuroimage. 2009;44:62–70. doi: 10.1016/j.neuroimage.2008.05.021. [DOI] [PubMed] [Google Scholar]
- Cleghorn JM, Garnett ES, Nahmias C, Brown GM, Kaplan RD, Szechtman H, Szechtman B, Franco S, Dermer SW, Cook P. Regional brain metabolism during auditory hallucinations in chronic schizophrenia. Br J Psychiatry. 1990;157:562–570. doi: 10.1192/bjp.157.4.562. [DOI] [PubMed] [Google Scholar]
- Cook RD. Influential observations in linear-regression. J Am Stat Assoc. 1979;74:169–174. doi: 10.1080/01621459.1979.10481634. [DOI] [Google Scholar]
- Corlett PR, Murray GK, Honey GD, Aitken MR, Shanks DR, Robbins TW, Bullmore ET, Dickinson A, Fletcher PC. Disrupted prediction-error signal in psychosis: evidence for an associative account of delusions. Brain. 2007;130:2387–2400. doi: 10.1093/brain/awm173. [DOI] [PMC free article] [PubMed] [Google Scholar]
- Cullen AE, De Brito SA, Gregory SL, Murray RM, Williams SC, Hodgins S, Laurens KR. Temporal lobe volume abnormalities precede the prodrome: a study of children presenting antecedents of schizophrenia. Schizophr Bull. 2013;39:1318–1327. doi: 10.1093/schbul/sbs128. [DOI] [PMC free article] [PubMed] [Google Scholar]
- Daw ND. Trial-by-trial data analysis using computational models. In: Delgado MR, Phelps EA, Robbins TW, editors. Decision making, affect, and learning: attention and performance XXIII. Oxford, UK: Oxford UP; 2011. pp. 3–38. [Google Scholar]
- Diederen KM, Neggers SF, Daalman K, Blom JD, Goekoop R, Kahn RS, Sommer IE. Deactivation of the parahippocampal gyrus preceding auditory hallucinations in schizophrenia. Am J Psychiatry. 2010;167:427–435. doi: 10.1176/appi.ajp.2009.09040456. [DOI] [PubMed] [Google Scholar]
- Egner T, Monti JM, Summerfield C. Expectation and surprise determine neural population responses in the ventral visual stream. J Neurosci. 2010;30:16601–16608. doi: 10.1523/JNEUROSCI.2770-10.2010. [DOI] [PMC free article] [PubMed] [Google Scholar]
- Fletcher PC, Frith CD. Perceiving is believing: a Bayesian approach to explaining the positive symptoms of schizophrenia. Nat Rev Neurosci. 2009;10:48–58. doi: 10.1038/nrn2536. [DOI] [PubMed] [Google Scholar]
- Florán B, Florán L, Erlij D, Aceves J. Activation of dopamine D4 receptors modulates [3H]GABA release in slices of the rat thalamic reticular nucleus. Neuropharmacology. 2004;46:497–503. doi: 10.1016/j.neuropharm.2003.10.004. [DOI] [PubMed] [Google Scholar]
- Ford JM, Mathalon DH, Heinks T, Kalba S, Faustman WO, Roth WT. Neurophysiological evidence of corollary discharge dysfunction in schizophrenia. Am J Psychiatry. 2001;158:2069–2071. doi: 10.1176/appi.ajp.158.12.2069. [DOI] [PubMed] [Google Scholar]
- Frank MJ. Schizophrenia: a computational reinforcement learning perspective. Schizophr Bull. 2008;34:1008–1011. doi: 10.1093/schbul/sbn123. [DOI] [PMC free article] [PubMed] [Google Scholar]
- Friston K. The free-energy principle: a unified brain theory? Nat Rev Neurosci. 2010;11:127–138. doi: 10.1038/nrn2787. [DOI] [PubMed] [Google Scholar]
- Friston K, Kiebel S. Predictive coding under the free-energy principle. Philos Trans R Soc Lond B Biol Sci. 2009;364:1211–1221. doi: 10.1098/rstb.2008.0300. [DOI] [PMC free article] [PubMed] [Google Scholar]
- Friston KJ. Hallucinations and perceptual inference. Behav Brain Sci. 2005;28:764–766. doi: 10.1017/S0140525X05290131. [DOI] [Google Scholar]
- Gläscher J, Büchel C. Formal learning theory dissociates brain regions with different temporal integration. Neuron. 2005;47:295–306. doi: 10.1016/j.neuron.2005.06.008. [DOI] [PubMed] [Google Scholar]
- Gradin VB, Kumar P, Waiter G, Ahearn T, Stickle C, Milders M, Reid I, Hall J, Steele JD. Expected value and prediction error abnormalities in depression and schizophrenia. Brain. 2011;134:1751–1764. doi: 10.1093/brain/awr059. [DOI] [PubMed] [Google Scholar]
- Haddock G, McCarron J, Tarrier N, Faragher EB. Scales to measure dimensions of hallucinations and delusions: the psychotic symptom rating scales (PSYRATS) Psychol Med. 1999;29:879–889. doi: 10.1017/S0033291799008661. [DOI] [PubMed] [Google Scholar]
- Heinks-Maldonado TH, Mathalon DH, Houde JF, Gray M, Faustman WO, Ford JM. Relationship of imprecise corollary discharge in schizophrenia to auditory hallucinations. Arch Gen Psychiatry. 2007;64:286–296. doi: 10.1001/archpsyc.64.3.286. [DOI] [PubMed] [Google Scholar]
- Hoffman RE, Pittman B, Constable RT, Bhagwagar Z, Hampson M. Time course of regional brain activity accompanying auditory verbal hallucinations in schizophrenia. Br J Psychiatry. 2011;198:277–283. doi: 10.1192/bjp.bp.110.086835. [DOI] [PMC free article] [PubMed] [Google Scholar]
- Horga G, Parellada E, Lomeña F, Fernández-Egea E, Mané A, Font M, Falcón C, Konova AB, Pavia J, Ros D, Bernardo M. Differential brain glucose metabolic patterns in antipsychotic-naive first-episode schizophrenia with and without auditory verbal hallucinations. J Psychiatry Neurosci. 2011;36:312–321. doi: 10.1503/jpn.100085. [DOI] [PMC free article] [PubMed] [Google Scholar]
- Howes OD, Kambeitz J, Kim E, Stahl D, Slifstein M, Abi-Dargham A, Kapur S. The nature of dopamine dysfunction in schizophrenia and what this means for treatment. Arch Gen Psychiatry. 2012;69:776–786. doi: 10.1001/archgenpsychiatry.2012.169. [DOI] [PMC free article] [PubMed] [Google Scholar]
- Jardri R, Pouchet A, Pins D, Thomas P. Cortical activations during auditory verbal hallucinations in schizophrenia: a coordinate-based meta-analysis. Am J Psychiatry. 2011;168:73–81. doi: 10.1176/appi.ajp.2010.09101522. [DOI] [PubMed] [Google Scholar]
- Jeon YW, Polich J. P300 asymmetry in schizophrenia: a meta-analysis. Psychiatry Res. 2001;104:61–74. doi: 10.1016/S0165-1781(01)00297-9. [DOI] [PubMed] [Google Scholar]
- Kay SR, Fiszbein A, Opler LA. The positive and negative syndrome scale (PANSS) for schizophrenia. Schizophr Bull. 1987;13:261–276. doi: 10.1093/schbul/13.2.261. [DOI] [PubMed] [Google Scholar]
- Keller GB, Hahnloser RH. Neural processing of auditory feedback during vocal practice in a songbird. Nature. 2009;457:187–190. doi: 10.1038/nature07467. [DOI] [PubMed] [Google Scholar]
- Keller GB, Bonhoeffer T, Hübener M. Sensorimotor mismatch signals in primary visual cortex of the behaving mouse. Neuron. 2012;74:809–815. doi: 10.1016/j.neuron.2012.03.040. [DOI] [PubMed] [Google Scholar]
- Kiehl KA, Stevens MC, Celone K, Kurtz M, Krystal JH. Abnormal hemodynamics in schizophrenia during an auditory oddball task. Biol Psychiatry. 2005;57:1029–1040. doi: 10.1016/j.biopsych.2005.01.035. [DOI] [PMC free article] [PubMed] [Google Scholar]
- Kilian-Hütten N, Valente G, Vroomen J, Formisano E. Auditory cortex encodes the perceptual interpretation of ambiguous sound. J Neurosci. 2011;31:1715–1720. doi: 10.1523/JNEUROSCI.4572-10.2011. [DOI] [PMC free article] [PubMed] [Google Scholar]
- Leung M, Cheung C, Yu K, Yip B, Sham P, Li Q, Chua S, McAlonan G. Gray matter in first-episode schizophrenia before and after antipsychotic drug treatment. Anatomical likelihood estimation meta-analyses with sample size weighting. Schizophr Bull. 2011;37:199–211. doi: 10.1093/schbul/sbp099. [DOI] [PMC free article] [PubMed] [Google Scholar]
- Mesgarani N, Chang EF. Selective cortical representation of attended speaker in multi-talker speech perception. Nature. 2012;485:233–236. doi: 10.1038/nature11020. [DOI] [PMC free article] [PubMed] [Google Scholar]
- Meyer T, Olson CR. Statistical learning of visual transitions in monkey inferotemporal cortex. Proc Natl Acad Sci U S A. 2011;108:19401–19406. doi: 10.1073/pnas.1112895108. [DOI] [PMC free article] [PubMed] [Google Scholar]
- Michelucci R, Passarelli D, Pitzalis S, Dal Corso G, Tassinari CA, Nobile C. Autosomal dominant partial epilepsy with auditory features: description of a new family. Epilepsia. 2000;41:967–970. doi: 10.1111/j.1528-1157.2000.tb00280.x. [DOI] [PubMed] [Google Scholar]
- Modinos G, Costafreda SG, van Tol MJ, McGuire PK, Aleman A, Allen P. Neuroanatomy of auditory verbal hallucinations in schizophrenia: a quantitative meta-analysis of voxel-based morphometry studies. Cortex. 2013;49:1046–1055. doi: 10.1016/j.cortex.2012.01.009. [DOI] [PubMed] [Google Scholar]
- Mrzljak L, Bergson C, Pappy M, Huff R, Levenson R, Goldman-Rakic PS. Localization of dopamine D4 receptors in GABAergic neurons of the primate brain. Nature. 1996;381:245–248. doi: 10.1038/381245a0. [DOI] [PubMed] [Google Scholar]
- Murray GK, Corlett PR, Clark L, Pessiglione M, Blackwell AD, Honey G, Jones PB, Bullmore ET, Robbins TW, Fletcher PC. Substantia nigra/ventral tegmental reward prediction error disruption in psychosis. Mol Psychiatry. 2008;13:239, 267–276. doi: 10.1038/sj.mp.4002058. [DOI] [PMC free article] [PubMed] [Google Scholar]
- Nature Editorial. A decade for psychiatric disorders. Nature. 2010;463:9. doi: 10.1038/463009a. [DOI] [PubMed] [Google Scholar]
- Palaniyappan L, Balain V, Radua J, Liddle PF. Structural correlates of auditory hallucinations in schizophrenia: a meta-analysis. Schizophr Res. 2012;137:169–173. doi: 10.1016/j.schres.2012.01.038. [DOI] [PubMed] [Google Scholar]
- Penfield W, Perot P. The brain's record of auditory and visual experience. A final summary and discussion. Brain. 1963;86:595–696. doi: 10.1093/brain/86.4.595. [DOI] [PubMed] [Google Scholar]
- Rahnev D, Lau H, de Lange FP. Prior expectation modulates the interaction between sensory and prefrontal regions in the human brain. J Neurosci. 2011;31:10741–10748. doi: 10.1523/JNEUROSCI.1478-11.2011. [DOI] [PMC free article] [PubMed] [Google Scholar]
- Rao RP, Ballard DH. Predictive coding in the visual cortex: a functional interpretation of some extra-classical receptive-field effects. Nat Neurosci. 1999;2:79–87. doi: 10.1038/4580. [DOI] [PubMed] [Google Scholar]
- Schindel R, Rowlands J, Arnold DH. The oddball effect: perceived duration and predictive coding. J Vis. 2011;11(2):17, 1–9. doi: 10.1167/11.2.17. [DOI] [PubMed] [Google Scholar]
- Schmidt CF, Zaehle T, Meyer M, Geiser E, Boesiger P, Jancke L. Silent and continuous fMRI scanning differentially modulate activation in an auditory language comprehension task. Hum Brain Mapp. 2008;29:46–56. doi: 10.1002/hbm.20372. [DOI] [PMC free article] [PubMed] [Google Scholar]
- Shergill SS, Bays PM, Frith CD, Wolpert DM. Two eyes for an eye: the neuroscience of force escalation. Science. 2003;301:187. doi: 10.1126/science.1085327. [DOI] [PubMed] [Google Scholar]
- Shergill SS, Samson G, Bays PM, Frith CD, Wolpert DM. Evidence for sensory prediction deficits in schizophrenia. Am J Psychiatry. 2005;162:2384–2386. doi: 10.1176/appi.ajp.162.12.2384. [DOI] [PubMed] [Google Scholar]
- Silbersweig DA, Stern E, Frith C, Cahill C, Holmes A, Grootoonk S, Seaward J, McKenna P, Chua SE, Schnorr L. A functional neuroanatomy of hallucinations in schizophrenia. Nature. 1995;378:176–179. doi: 10.1038/378176a0. [DOI] [PubMed] [Google Scholar]
- Sommer IE, Diederen KM, Blom JD, Willems A, Kushan L, Slotema K, Boks MP, Daalman K, Hoek HW, Neggers SF, Kahn RS. Auditory verbal hallucinations predominantly activate the right inferior frontal area. Brain. 2008;131:3169–3177. doi: 10.1093/brain/awn251. [DOI] [PubMed] [Google Scholar]
- Steinberg M. Structured clinical interview for DSM-IV dissociative disorders (SCID-D)/Marlene Steinberg. Washington, DC: American Psychiatric; 1993. [Google Scholar]
- Stephane M, Thuras P, Nasrallah H, Georgopoulos AP. The internal structure of the phenomenology of auditory verbal hallucinations. Schizophr Res. 2003;61:185–193. doi: 10.1016/S0920-9964(03)00013-6. [DOI] [PubMed] [Google Scholar]
- Summerfield C, Koechlin E. A neural representation of prior information during perceptual inference. Neuron. 2008;59:336–347. doi: 10.1016/j.neuron.2008.05.021. [DOI] [PubMed] [Google Scholar]
- Summerfield C, Egner T, Greene M, Koechlin E, Mangels J, Hirsch J. Predictive codes for forthcoming perception in the frontal cortex. Science. 2006;314:1311–1314. doi: 10.1126/science.1132028. [DOI] [PubMed] [Google Scholar]
- Tobler PN, Fiorillo CD, Schultz W. Adaptive coding of reward value by dopamine neurons. Science. 2005;307:1642–1645. doi: 10.1126/science.1105370. [DOI] [PubMed] [Google Scholar]
- Todorovic A, de Lange FP. Repetition suppression and expectation suppression are dissociable in time in early auditory evoked fields. J Neurosci. 2012;32:13389–13395. doi: 10.1523/JNEUROSCI.2227-12.2012. [DOI] [PMC free article] [PubMed] [Google Scholar]
- Umbricht D, Krljes S. Mismatch negativity in schizophrenia: a meta-analysis. Schizophr Res. 2005;76:1–23. doi: 10.1016/j.schres.2004.12.002. [DOI] [PubMed] [Google Scholar]
- Vita A, De Peri L, Deste G, Sacchetti E. Progressive loss of cortical gray matter in schizophrenia: a meta-analysis and meta-regression of longitudinal MRI studies. Transl Psychiatry. 2012;2:e190. doi: 10.1038/tp.2012.116. [DOI] [PMC free article] [PubMed] [Google Scholar]
- Wacongne C, Changeux JP, Dehaene S. A neuronal model of predictive coding accounting for the mismatch negativity. J Neurosci. 2012;32:3665–3678. doi: 10.1523/JNEUROSCI.5003-11.2012. [DOI] [PMC free article] [PubMed] [Google Scholar]
- Zelano C, Mohanty A, Gottfried JA. Olfactory predictive codes and stimulus templates in piriform cortex. Neuron. 2011;72:178–187. doi: 10.1016/j.neuron.2011.08.010. [DOI] [PMC free article] [PubMed] [Google Scholar]