

Abstract
It is widely believed that sensory systems are optimized for processing stimuli occurring in the natural environment. However, it remains unknown whether this principle applies to the vestibular system, which contributes to essential brain functions ranging from the most automatic reflexes to spatial perception and motor coordination. Here we quantified, for the first time, the statistics of natural vestibular inputs experienced by freely moving human subjects during typical everyday activities. Although previous studies have found that the power spectra of natural signals across sensory modalities decay as a power law (i.e., as 1/fα), we found that this did not apply to natural vestibular stimuli. Instead, power decreased slowly at lower and more rapidly at higher frequencies for all motion dimensions. We further establish that this unique stimulus structure is the result of active motion as well as passive biomechanical filtering occurring before any neural processing. Notably, the transition frequency (i.e., frequency at which power starts to decrease rapidly) was lower when subjects passively experienced sensory stimulation than when they actively controlled stimulation through their own movement. In contrast to signals measured at the head, the spectral content of externally generated (i.e., passive) environmental motion did follow a power law. Specifically, transformations caused by both motor control and biomechanics shape the statistics of natural vestibular stimuli before neural processing. We suggest that the unique structure of natural vestibular stimuli will have important consequences on the neural coding strategies used by this essential sensory system to represent self-motion in everyday life.
Keywords: natural stimuli, power law, preneuronal processing
Introduction
Understanding the neural coding strategies used by the brain to process incoming sensory input remains an important but largely unsolved problem in systems neuroscience. It is generally assumed that sensory systems efficiently process natural stimuli using coding strategies that are adapted to the statistics of the environment in which the organism lives (Attneave, 1954; Laughlin, 1981; Barlow, 2001; Simoncelli and Olshausen, 2001). However, it is not known whether a comparable coding strategy is used by the vestibular system, which processes head in space motion and thus plays a vital role in the stabilization of gaze, control of balance and posture, as well as perception of spatial orientation and motion. Accordingly, here we quantified the statistics of the vestibular signals experienced during natural self-motion.
The vestibular system is phylogenetically the oldest part of the inner ear and highly conserved across evolution (Wallman et al., 1982). The vestibular sensors detect head movement in six dimensions (three axes of translation and three axes of rotation) to encode self-motion information during everyday life (Angelaki and Cullen, 2008; Cullen, 2011, 2012). There are two distinct types of sensors: the otolith organs, which sense translation, and the semicircular canals, which sense rotation. The self-motion responses of afferents from both types of sensors have been typically characterized using artificial stimuli (e.g., sinusoids, bandpass noise) that were constrained to one dimension (e.g., a rotation about the vertical axis or fore-aft translation) (Goldberg, 2000; Cullen and Roy, 2004; Sadeghi et al., 2007; Massot et al., 2011; Jamali et al., 2013). Over the physiologically relevant frequency range, peripheral semicircular canal and otolith afferents encode angular velocity and linear acceleration, respectively, and their response sensitivity increases with increasing frequency (Baird et al., 1988; Fernández et al., 1988; Goldberg, 2000). Importantly, however, a major limitation of using artificial stimuli is that one then cannot test whether vestibular neurons are adapted to the statistical properties of the input to which they are normally exposed (Simoncelli and Olshausen, 2001).
To make progress toward testing whether the vestibular system efficiently processes natural input, here we characterized, for the first time, the structure of self-motion signals that are experienced by human subjects during typical everyday activities. In all six dimensions, probability distributions deviated from normality because of relatively long tails that reached intensities as high as 450 deg/s and 5.5 G. Further, we found that spectral power decreased slowly for low (∼<5 Hz) and rapidly for higher frequencies. Thus, the statistical structure of natural vestibular stimuli differs from that reported in other sensory modalities, where the spectrum is instead inversely proportional to a given power of frequency (i.e., follows a power law) (for review, see Simoncelli and Olshausen, 2001). Moreover, we show that this unique structure results from the combined effects of active movements and body biomechanics, which alter environmental stimuli before any neural processing. We discuss the implications for the neural coding strategies used by the vestibular system to process these signals.
Materials and Methods
Subjects.
We recorded the head movements of 8 human subjects (4 male, 4 female; age, 22–34 years) while they performed everyday active movements (i.e., self-generated motion) and experienced passive motion (i.e., generated by external sources). All were in good physical condition, and none had a history of visual or vestibular defects. All experimental protocols were approved by McGill University's Human Ethics Committee, and subjects signed consent forms before the study.
Head movement recordings.
Head movements were recorded using a micro-electromechanical systems (MEMS) module (iNEMO platform, STEVAL-MKI062V2, STMicroelectronics). This MEMS module combines three linear accelerometers (recording linear accelerations along the fore-aft, interaural, and vertical axes) and three gyroscopes (recording angular velocity about pitch, roll, and yaw). However, to extend the velocity range to ±2000 deg/s, we augmented the MEMS module with a STEVAL-MKI107V2 three axis gyroscope. The data from the six sensors were sampled at 100 Hz and recorded wirelessly on a microSD card. The MEMS module, the battery and the microSD card were regrouped in an extremely light (64 g) and small (35 × 35 × 15 mm) enclosure. This enclosure was comfortably attached to the top of the subject's head by means of head and chin bands that were specially designed to prevent enclosure movement. The plane spanned by the fore-aft and interaural axes of the MEMS module was set parallel to the subject's Frankfurt plane (i.e., the plane passing through the inferior margin of the orbit to the external auditory meatus). During active movement, a second MEMS module was also attached to a tightly laced shoe over the dorsal surface of the right foot. We expressed the signals recorded from the two MEMS modules to be along the three cardinal axes of translation (fore-aft, lateral, and vertical).
Experimental conditions and procedures.
Each subject was asked to perform activities in a random order. We segregated activities into two groups: active movements that involve self-generated motion (e.g., locomotion) and passive movements in which motion was caused by external sources. Active movements consisted of the following: walking, going up and down the stairs, running at a comfortable speed, running through the woods, sprinting, jumping forward, jumping up and down, hopping on one foot, playing soccer, biking on a city street, and biking on a grassy field. Passive movements consisted of riding the city subway seated, riding the city subway standing up, riding a city bus seated and, riding a city bus standing up. Each activity typically lasted 2 min. Subjects were instructed to perform all active movements as they would under normal conditions. In the walking task, subjects navigated a busy sidewalk in downtown Montreal for at least two city blocks. The sprinting, jumping forward, and jumping up tasks all took place on grass fields. Subjects were instructed to perform to the maximum extent of their capabilities (i.e., as fast, far, or high as they could, respectively). The first running task (i.e., “running: pavement”) took place on a 400 m athletic track. In the second running task (i.e., “running: woods”) subjects ran out of trail (uphill/downhill loop through the woods) in Mont Royal park (Montreal). We initially performed experiments in which the subjects were able to freely move their head during passive movements. The resulting power spectra were lower than that of active movements for all axes of motion except for yaw rotations for which they were comparable (data not shown). We hypothesized that this was because subjects were prone to making active yaw head movements even during passive activities (e.g., turning the head while sitting in a car). Thus, subjects wore a neck brace (Miami J Cervical Collar, BSN Medical) during passive movements to suppress active head on body motion. Comparison of power spectra obtained during passive motion with and without the neck brace revealed no significant differences for all axes of motion, except for yaw rotations for which there was a marked reduction in overall power (data not shown), confirming our hypothesis that subjects were indeed prone to making active head on body movements during passive motion.
Data analysis.
The angular velocity data recorded from the gyroscopes were projected onto the semicircular canal planes (left anterior–right posterior [LARP], right anterior–left posterior [RALP], and yaw) using the rotation matrix as follows:
 |
with θ = 45 deg and γ = 18 deg (Della Santina et al., 2005).
Power spectral densities (PSD function, MATLAB, MathWorks, RRID:nlx_153890) were obtained using Welch's average periodogram with nfft = 512 and a Bartlett window (512 ms duration). Probability distributions were obtained using binwidths of 0.01 G (G = 9.8 m/s2) and 10 deg/s for linear acceleration and angular velocity, respectively. Deviation from normality was quantified by the excess kurtosis defined as follows:
 |
where μ and σ are the mean and SD of the data X, respectively, and <…> is the average.
We fitted the power spectrum with a power law over both the low- and high-frequency ranges. The low-frequency range was set from 0.2 Hz to 2 Hz, whereas the high-frequency range was set from 10 Hz to 30 Hz. These ranges correspond to those used in neurophysiological studies (Massot et al., 2012). In some cases, we found that the power spectrum reached the MEMS module's noise level, which was determined by recording signals for 15 min while the MEMS module was not moving, within the high-frequency range. In these cases, the high-frequency range was shifted to the left of the highest frequency for which the signal power was greater than noise power and was kept constant on a logarithmic scale. The transition frequency was determined as the frequency at which the two power law fits intersect.
Statistical significance was determined using sign rank Wilcoxon test. Results are reported (and plotted) as mean ± SEM, and the level of statistical significance was set at p < 0.05.
Results
Statistics of natural self-motion signals
We characterized the natural statistics of vestibular stimulation experienced by human subjects during typical everyday activities (e.g., walking, running, riding in a vehicle). Measurements of translational motion along as well as rotational motion about the fore-aft, lateral, and vertical axes were made using a MEMS module that was mounted on the subject's head (see Materials and Methods and Fig. 1A). Eight subjects experienced self-motion during the activities listed in Figure 1B. To describe the statistical properties of stimuli activating each of the three semicircular canals, the measured rotational angular velocity signals were projected onto the corresponding semicircular canal planes. As comparable results were obtained for LARP and RALP rotations as well as for interaural and fore-aft translations, we only show time series and spectral data obtained from measurements along the interaural and vertical translation axes as well as yaw and LARP rotation axes throughout the results for clarity. However, we present summary plots and histograms for quantifications of these data in all six motion dimensions.
Figure 1.
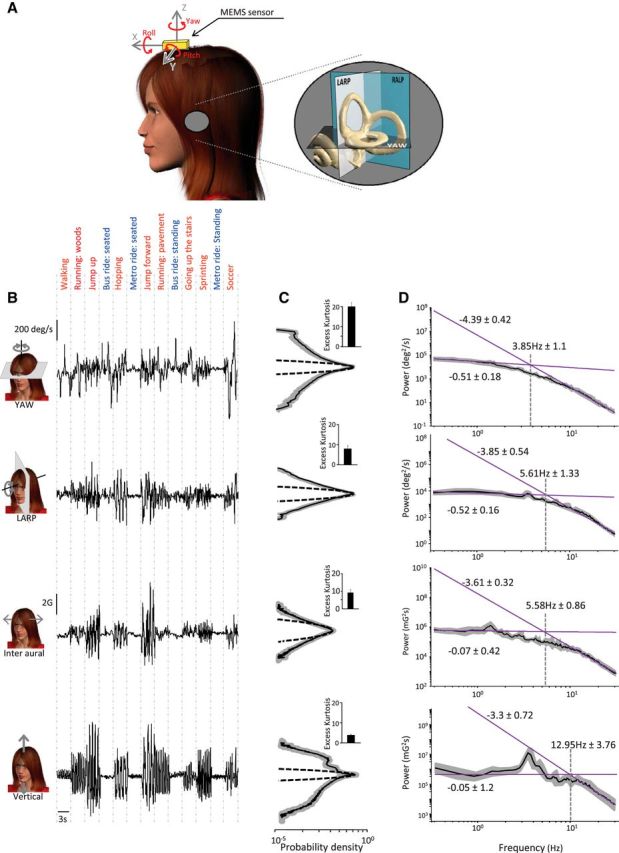
Statistics of natural vestibular stimuli. A, Representation of a subject wearing the MEMS module (gold box). Inset, A magnified image of the vestibular sensors and the corresponding semicircular canal planes. B, yaw angular velocity (first row), LARP angular velocity (second row), interaural linear acceleration (third row), and vertical linear acceleration (fourth row) signals during different everyday activities. C, Population-averaged probability distributions for these signals (solid black lines) with corresponding SD (shaded areas) and best Gaussian fit (dashed lines). Inset, Population-averaged excess kurtosis values. D, Population-averaged power spectra (black) of these signals with corresponding SDs (dark gray bands) and power law fits (solid magenta lines) over the low-frequency (0.2–2 Hz) and the high-frequency (10–30 Hz) ranges. The power law exponents (i.e., slopes) and the transition frequencies (i.e., the frequency at which the power law fits intersect) are also shown.
We found that the overall intensity of vestibular stimuli differed greatly across activities (Table 1). For example, angular velocities recorded when a typical subject played soccer reached 450 deg/s while linear accelerations reached 5.5 G (Fig. 1B; Table 1). In contrast, natural vestibular signals recorded for the same subject during less vigorous activities (e.g., while riding in a vehicle) reached smaller values (60 deg/s for angular velocity and 0.2 G for linear acceleration). Furthermore, we found that probability distributions of angular velocity and linear acceleration averaged across activities were not Gaussian (Fig. 1C, compare dashed and solid lines) as quantified by large (>10) positive excess kurtosis values (Fig. 1C, insets). Instead, they decayed more slowly and were characterized by long tails (Fig. 1C). Similar results were obtained for the other two motion dimensions: the population-averaged excess kurtosis values were significantly different from zero (RALP: 7.05 ± 1.28; fore-aft: 9.69 ± 0.78; p < 0.01 for all axes).
Table 1.
Subject-averaged peak head velocities and accelerations across tasksa
| LARP (deg/s) | RALP (deg/s) | YAW (deg/s) | Interaural (G) | Fore-aft (G) | Vertical (G) | |
|---|---|---|---|---|---|---|
| Walking | 142 ± 22.8 | 119.8 ± 13.1 | 289.2 ± 41.8 | 0.9 ± 0.1 | 1 ± 0.1 | 1 ± 0.1 |
| Running: woods | 224.2 ± 17.3 | 182.2 ± 10.9 | 308 ± 31.5 | 2.1 ± 0. 6 | 2.4 ± 0.7 | 4.1 ± 1 |
| Jump up | 145. ± 23.2 | 151 ± 12.1 | 92 ± 12.6 | 0.9 ± 0.1 | 2.2 ± 0.2 | 2.9 ± 0.2 |
| Bus ride | 94.9 ± 11.5 | 82.4 ± 13 | 214.4 ± 26.6 | 0.5 ± 0.1 | 0.7 ± 0.1 | 0.4 ± 0.1 |
| Hopping | 153.2 ± 18.1 | 141.4 ± 13.4 | 123.1 ± 17.7 | 1.1 ± 0.2 | 2.1 ± 0.3 | 2.8 ± 0.2 |
| Metro ride | 76.7 ± 16.6 | 68.1 ± 11.9 | 119.7 ± 14.3 | 0.4 ± 0.1 | 0.6 ± 0.1 | 0.4 ± 0.0 |
| Jump forward | 224.7 ± 24.7 | 196.3 ± 15.9 | 127.4 ± 11.8 | 1.2 ± 0.2 | 3.7 ± 0.6 | 3.3 ± 0.6 |
| Running: pavement | 147.3 ± 10.9 | 138.8 ± 11.6 | 195.8 ± 18.3 | 1.1 ± 0.1 | 1.8 ± 0.1 | 2.4 ± 0.1 |
| Going up the stairs | 130.2 ± 24.9 | 127.5 ± 9.2 | 246.5 ± 44.7 | 0.8 ± 0.1 | 1.3 ± 0.3 | 1.8 ± 0.2 |
| Sprinting | 193.4 ± 16.4 | 191.5 ± 15.6 | 225.3 ± 37.8 | 2 ± 0.3 | 2.2 ± 0. 2 | 3.9 ± 0.4 |
| Soccer | 306 ± 20.1 | 248.2 ± 33.6 | 411.2 ± 12.5 | 3.1 ± 0.6 | 3.8 ± 0.6 | 3.3 ± 0.3 |
aData are mean ± SEM.
We next measured the frequency content of natural vestibular stimuli by computing their power spectra. We found that these generally decreased slowly for lower (i.e., ∼<5 Hz) frequencies and more sharply for higher frequencies (i.e., ∼>5 Hz) (Fig. 1D). Further analysis revealed that the spectra of natural self-motion signals were not well fit by a power law (Fig. 1D). Specifically, the best power law fit obtained over the low-frequency range gave rise to a different exponent (which corresponds to the slope of the fit on a loglog plot) than the best power law fit obtained over the high-frequency range (Fig. 1D).
To quantify this effect, we compared the slopes obtained for the low-frequency (Fig. 2A, gray bars) and high-frequency (Fig. 2A, black bars) ranges. We found that these were significantly different from one another across all motion dimensions (p < 0.01). We also computed the frequency at which both power law fits intersected (i.e., the “transition frequency”) and found that this measure ranged between ∼4 Hz and ∼12 Hz (Fig. 2B). Together, our results demonstrate that the frequency content of natural vestibular signals experienced during everyday activities is not well fit by a power law. Thus, the statistics of natural vestibular stimuli appear to strongly differ from those observed in other sensory modalities where the power spectrum is instead well fit by a power law (Burton and Moorhead, 1987; Field, 1987; Tolhurst et al., 1992; Ruderman and Bialek, 1994; Dong and Atick, 1995; Attias and Schreiner, 1998; Simoncelli and Olshausen, 2001; De Coensel et al., 2003; Maravall et al., 2007).
Figure 2.
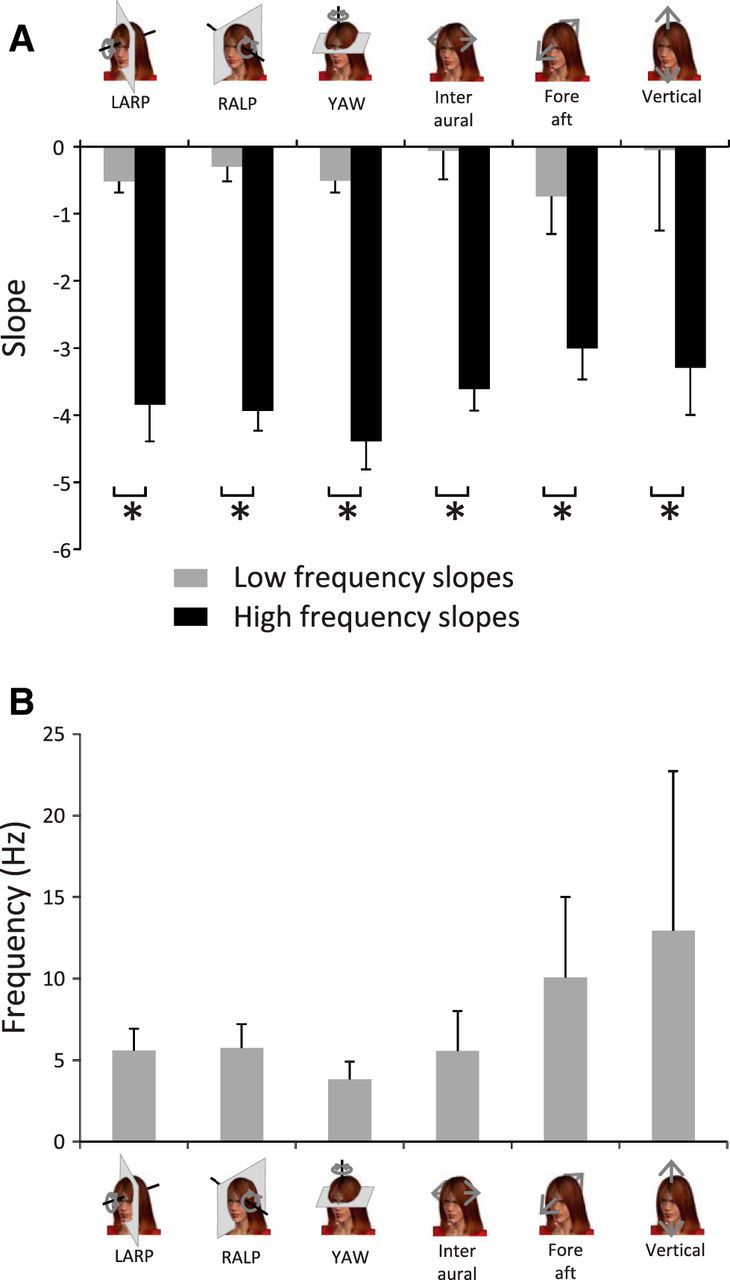
Natural vestibular stimuli do not follow a power law. A, Population-averaged slopes obtained for the low-frequency range (gray bars) were always significantly different from those obtained for the high-frequency range (black bars) at the p = 0.05 level (*). B, Population-averaged transition frequencies for all six dimensions.
Voluntary motion contributes to shape the statistics of natural vestibular stimuli
The finding above thus raises the question: why do natural vestibular stimuli display fundamentally different statistics from those observed in other sensory modalities? A priori, one explanation for this observation is that each subject experienced motion that was self-generated (Fig. 3A) as well as externally produced (Fig. 3B). Traditionally, the statistical properties of stimuli are measured as they exist in the environment rather than as actively generated by behavior. We hypothesized that self-generated motion does not have the same statistics as externally produced motion as voluntary motor commands initiate and control the stimulation of the subject's vestibular system in the former, but not the latter, case. For example, we found that subjects experienced greater translational accelerations and angular velocities during active motion (Fig. 1B, compare blue and red).
Figure 3.
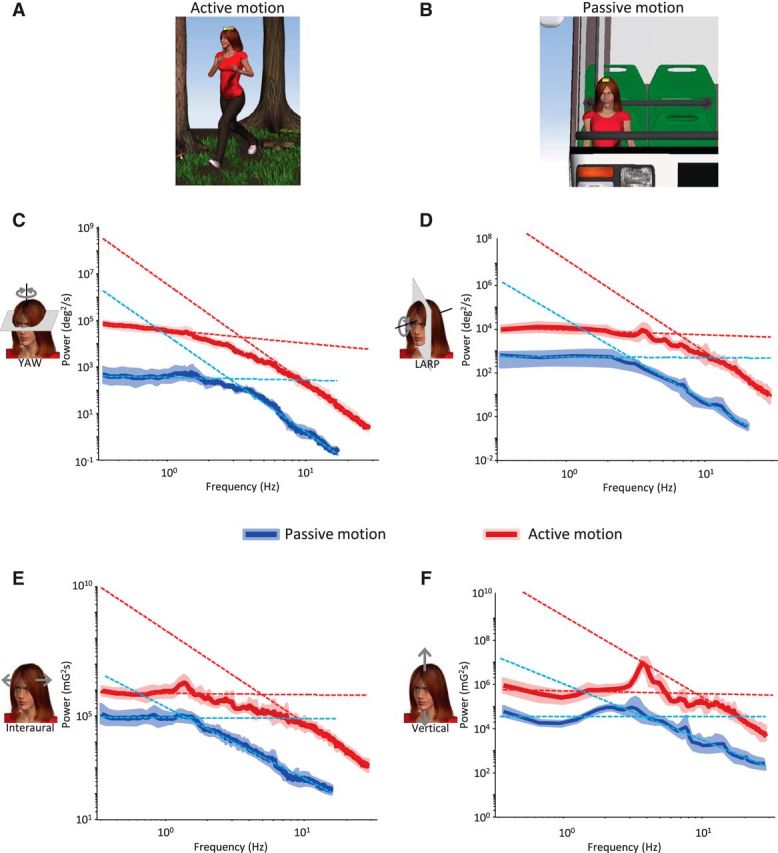
Active movements alter the statistics of natural vestibular stimuli. A, Activities, such as running in the woods, mostly consist of active movements. B, Activities, such as riding in a vehicle, instead mostly consist of externally produced movements. C–F, Population-averaged power spectra for active (red) and passive (blue) activities with corresponding SDs (red and blue bands, respectively) as well as power law fits for the low- and high-frequency ranges (red and blue dashed lines, respectively) for yaw rotation (C), LARP rotation (D), interaural translation (E), and vertical translation (F).
To test whether active and passive motion have different statistics, we separated activities into two groups: (1) active movements in which motion is largely self-generated (e.g., running) and (2) passive movements in which motion instead results predominantly from external changes in the environment (e.g., riding in a vehicle) (Fig. 3A,B). We then compared the power spectra of natural vestibular stimuli experienced during active and passive motion. We found that, in both conditions, the power generally decreased slowly over the lower frequency range (∼<3 Hz) and more sharply over the higher frequency range (∼>6 Hz) (Fig. 3C–F). As was shown above for the power spectra obtained across all activities (Fig. 1D), the power spectra obtained from either active or passive motion were not well fit by a power law. Specifically, the best fit obtained over the low-frequency range always gave rise to a significantly different slope than that obtained over the high-frequency range across all dimensions for both active (p < 0.0001, Fig. 4A) and passive (p < 0.01, Fig. 4B) motion. However, we found differences between the statistics of active and passive motion as the transition frequency was significantly greater for the former across all six dimensions (p < 0.02; Fig. 4C). Thus, our results indicate that active movements during everyday life shape the structure of natural vestibular stimuli but do not account for the fact that their spectral content does not follow a power law.
Figure 4.
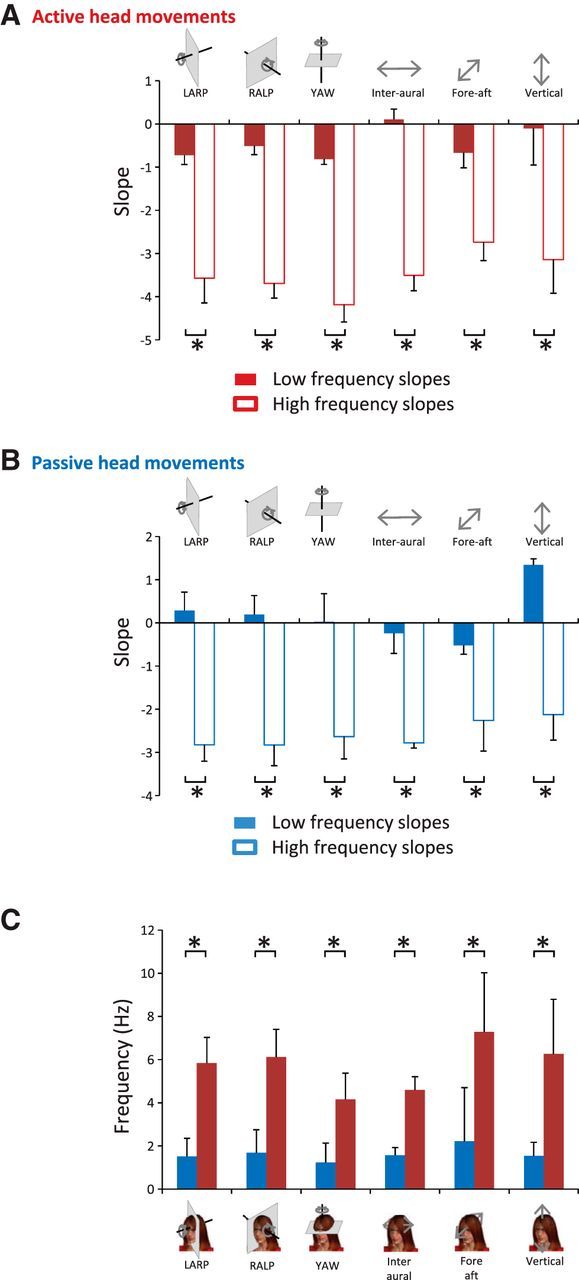
Signals resulting from active motion differ from those resulting from passive motion, although both do not follow a power law. A, Population-averaged slopes obtained for the low-frequency range (solid red bars) were always significantly different from those obtained for the high-frequency range (open red bars) at the p = 0.05 level (*) for active motion. B, Population-averaged slopes obtained for the low-frequency range (solid blue bars) were always significantly different from those obtained for the high-frequency range (open blue bars) at the p = 0.05 level (*) for passive motion. C, Transition frequencies obtained for active motion were significantly different from those obtained for passive motion at the p = 0.05 level (*).
Biomechanical filtering causes the power spectra of natural vestibular stimuli to deviate from power law
It is well known that biomechanical filtering significantly alters the frequency content of motion signals transmitted through the human body (McMahon, 1984; Zatiorsky, 1998; Nigg and Liu, 1999; Wakeling et al., 2002; Wakeling et al., 2003; Hinz et al., 2010). However, as noted above, the statistical properties of natural stimuli in vision and audition are typically measured as they exist in the environment (i.e., independent of biomechanical filtering) (Burton and Moorhead, 1987; Field, 1987; Tolhurst et al., 1992; Ruderman and Bialek, 1994; De Coensel et al., 2003). In contrast, in the experiments described thus far, we measured motion stimuli occurring at the subject's head where the vestibular sensors are actually located (Wallman et al., 1982). For example, in the case where a person is riding in a vehicle, the vibrations resulting from the vehicle's motion are transmitted from the seat to the subject's lower body, and then to their head, which in turn activates the vestibular sensors (Fig. 5A). Thus, we hypothesized that filtering by the biomechanical properties of the body (e.g., torso, legs, head-neck complex) causes natural vestibular stimuli to deviate from power law.
Figure 5.
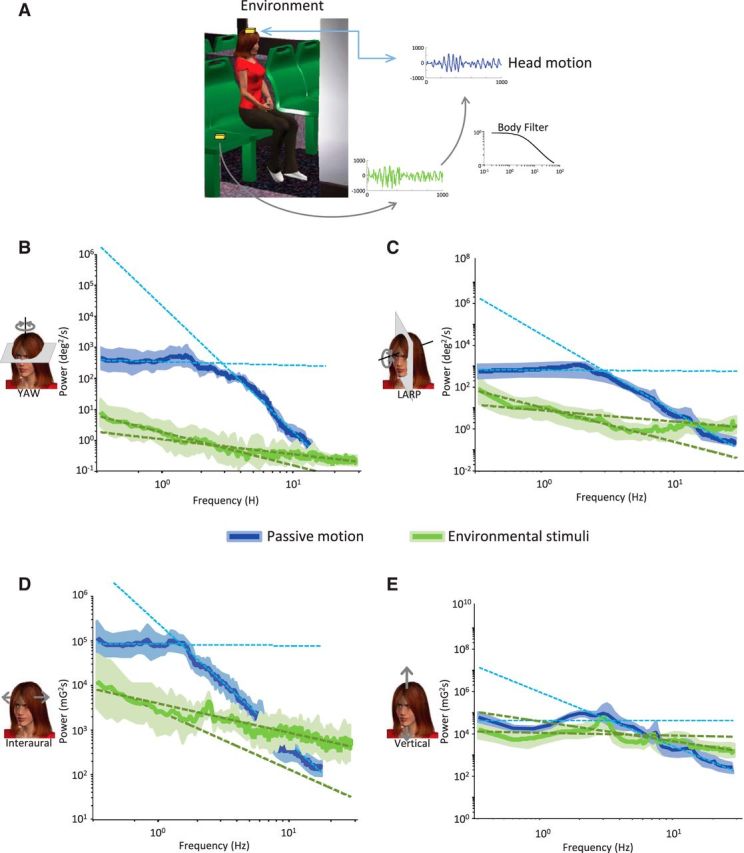
Filtering of environmental stimuli by the biomechanical properties of the body introduces deviation from power law during passive motion. A, MEMS modules (gold boxes) were placed on a person's head and directly on the seat. B–E, Population-averaged power spectra with subject (blue) and without subject (green) with power law fits superimposed (blue and green dashed lines, respectively) for yaw rotation (B), LARP rotation (C), interaural translation (D), and vertical translation (E).
To test this hypothesis, we compared the motion signals recorded by the MEMS module when placed on the subject's head while riding in a vehicle (e.g., bus, metro) with those recorded when the module was instead located on the seat. Whereas the power spectra obtained in the former condition were characterized by significantly different slopes over the low- and high-frequency ranges as seen above (Fig. 4B), those obtained in the latter condition were instead well fit by a power law (Fig. 5B–E, compare blue and green traces). Specifically, the slopes over the low- and high-frequency ranges were not significantly different from one another across all dimensions (p > 0.3), except vertical (p = 0.0313) for signals measured without the subject in place (Fig. 6, compare closed and open bars). Thus, our results show that biomechanical filtering by the human body can account for the fact that the power spectra of natural vestibular signals experienced during passive self-motion are not well fit by a power law across all six motion dimensions.
Figure 6.

Environmental stimuli follow a power law. Population-averaged slopes obtained for the low-frequency range (solid green bars) were not significantly different from those obtained for the high-frequency range (open green bars) at the p = 0.05 level (*) for all dimensions except vertical. The y-axis range used is the same as that used in Figure 4B to facilitate comparison.
Does biomechanical filtering also cause the power spectra of natural vestibular stimuli experienced during active motion to deviate from power law? In contrast to passive motion, there is no external environmental stimulus during active movements. Rather, vestibular signals then include those caused by voluntary movements as well as by vibrations resulting from the foot striking the ground (e.g., during locomotion) (Fig. 7A). To quantify the impact of biomechanical filtering on the power spectra of natural vestibular signals during active motion, motion signals were simultaneously recorded at the subject's foot and head during active movements. We found that the power spectra of natural vestibular signals recorded at the foot strongly differed from those recorded at the head (Fig. 7B–E, compare red and purple curves), as was expected based on the known biomechanical filtering properties of the body. Specifically, for signals recorded at the foot, the power slightly increased over the lower frequency range (∼<2 Hz) and decreased for higher frequencies (Fig. 7B–E, purple curves). While the power spectra were not well fit by a power law as the slopes obtained over the low- and high-frequency ranges were significantly different from one another for all six dimensions (p < 0.02; Fig. 8), the deviation from power law was qualitatively different from that observed for signals recorded at the head. Indeed, the slopes obtained over the low-frequency range were significantly positive (p < 0.02) across all six dimensions for signals recorded at the foot (Fig. 8). In contrast, the slopes obtained over the low-frequency range for signals recorded at the head were all either significantly negative (p < 0.01; LARP, RALP, yaw, and fore-aft) or not significantly different from zero (p > 0.24; interaural, vertical) (Fig. 4A).
Figure 7.
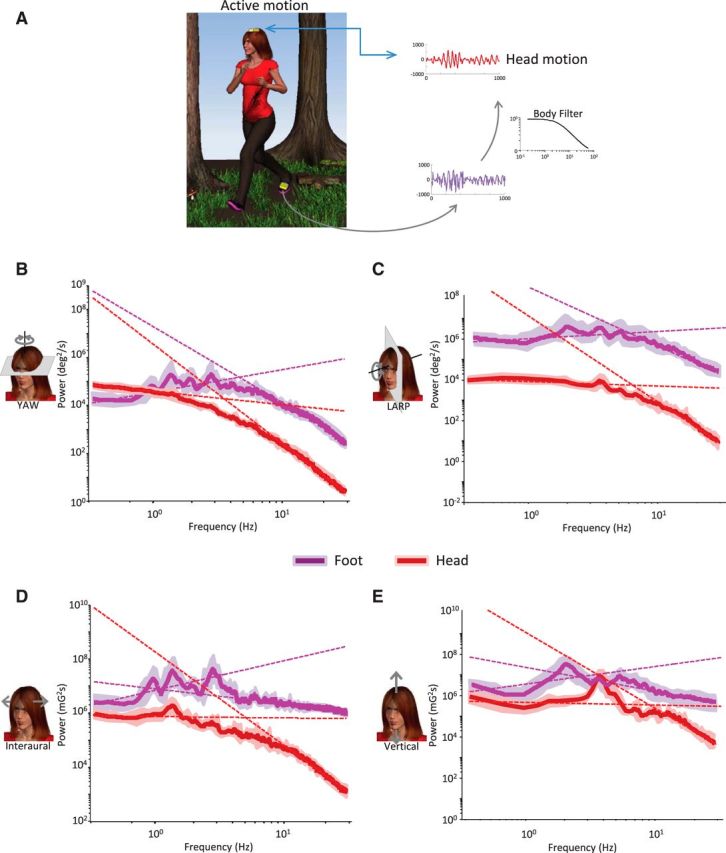
Biomechanical filtering by the body influences statistics of natural vestibular stimuli during active movement. A, MEMS modules (gold boxes) were placed on the subject's head and foot. B–E, Population-averaged power spectra from signals recorded at the foot (purple) and at the head (red) with power law fits superimposed (purple and red dashed lines, respectively) for yaw rotation (B), LARP rotation (C), interaural translation (D), and vertical translation (E).
Figure 8.

Motion stimuli recorded at the subject's foot strongly differ from those recorded at the subject's head. Population-averaged slopes obtained for the low-frequency range (solid purple bars) were significantly different from those obtained for the high-frequency range (open purple bars) at the p = 0.05 level (*) across all six dimensions for signals recorded at the subject's foot. Further, slopes obtained for the low-frequency range were all significantly positive at the p = 0.05 level (*).
Discussion
In the present study, we measured, for the first time, the statistics of self-motion signals experienced by human subjects during typical everyday activities. We found that vestibular stimuli reached large intensities (e.g., 450 deg/s and 5.5 G). Probability distributions were not Gaussian but were instead characterized by long tails as quantified by large and positive excess kurtosis values across all six motion dimensions. We also found that spectral frequency content did not follow a power law but instead decreased relatively slowly over low (∼<5 Hz) and more rapidly over high-frequency ranges. Moreover, the statistics of signals experienced during active movements differed from those experienced during passive movement, indicating that active motion shapes the structure of natural vestibular stimuli. We further showed that biomechanical filtering, known to significantly alter the frequency content of motion signals transmitted through the human body (McMahon, 1984; Zatiorsky, 1998; Nigg and Liu, 1999; Wakeling et al., 2002; Wakeling et al., 2003; Hinz et al., 2010), causes the power spectra of natural vestibular signals to deviate from power law. Biomechanical filtering also contributes to shaping the power spectra of natural vestibular signals in all six motion dimensions during active motion. We conclude that preneuronal filtering strongly alters the statistics of natural vestibular signals before reaching the vestibular end organs. We suggest that our findings have important implications regarding the neural coding strategies used by this essential system.
It is commonly assumed that sensory systems have adapted their coding strategies to efficiently process natural stimuli (Attneave, 1954; Barlow et al., 1972; Simoncelli and Olshausen, 2001). Indeed, sensory neurons frequently transmit more information about natural stimuli than artificial ones (Rieke et al., 1995; Lewen et al., 2001; Machens et al., 2001; Vinje and Gallant, 2002). Our results show that the probability distributions of natural vestibular stimuli display characteristic long tails, similar to stimuli in other sensory modalities (Ruderman and Bialek, 1994). However, the frequency content of natural vestibular stimuli appears fundamentally different from that observed in other modalities as their spectral power does not follow a power law. Thus, our results bring forward the important question of whether the neural coding strategies used by the vestibular system are fundamentally different from those used by systems with stimuli whose spectral power follows a power law. Put another way, are the coding strategies used by the vestibular system optimized to the unique spectral structure of the signals impinging on the sensors? Current evidence suggests that the vestibular end organs have adapted across species to changes in the environment as well as body mass (Jones and Spells, 1963; Spoor et al., 2002), which supports the hypothesis that vestibular processing is influenced by the statistics of natural stimuli encountered in the sensory environment. The adaptation of vestibular pathways to stimuli whose power spectra do not follow a power law would have important consequences for higher levels of processing. Indeed, the principles that govern perception in the vestibular system may then be fundamentally different from systems with stimuli whose spectral power follows a power law. For example, Weber's law, which states that the discrimination threshold is proportional to stimulus magnitude, is observed across sensory systems (Laming, 1986; Zanker, 1996; Dehaene, 2003; Brannon et al., 2008; Francisco et al., 2008) and is commonly thought to be a consequence of adaptation to stimuli whose spectral power follows a power law (Shepard, 1987; Anderson, 1990; Chater and Brown, 1999). Thus, if our prediction is correct, then vestibular perception should deviate from Weber's law. Recent findings suggest that this is indeed the case but have only tested low (≤0.5 Hz) frequencies (Mallery et al., 2010). Further experiments testing vestibular perception over the natural frequency range (0–20 Hz) are necessary to confirm this result.
The proposal above raises the fundamental question: what coding strategies are actually used by the vestibular system to process natural stimuli? Peripheral vestibular afferents can be categorized as either regular or irregular based on resting discharge variability (Goldberg, 2000). Although the response sensitivities to individual sinusoidal stimuli of both classes increase as a function of frequency, the rate of change is more pronounced for irregular afferents. We propose that the high-pass tuning of irregular afferents is adapted to the statistics of natural vestibular stimuli. Specifically, we speculate that these afferents compensate for the fact that the spectral power of natural input decreases with increasing temporal frequency to equally redistribute (i.e., “whiten”) the encoding resources across the natural temporal frequency range. In particular, this strategy would be advantageous for enhancing the detection of the weak high-frequency components of natural vestibular stimuli that would be most susceptible to environmental noise. Thus, we suggest that irregular afferents are more optimized to process high-frequency motion and therefore are critical for behaviors requiring the generation of accurate compensatory reflexes to respond to unexpected transient high-frequency events (e.g., slipping while walking on an icy surface). Our proposal is consistent with previous studies demonstrating that these afferents display increased sensitivity to high-frequency stimuli even when low-frequency stimuli are presented concurrently (Sadeghi et al., 2007; Massot et al., 2011, 2012; Jamali et al., 2013). In contrast, we postulate that the relatively broadband tuning of regular afferents is adapted to behaviors, such as the vestibulo-ocular reflex. This is because the compensatory eye movements produced during this behavior require that vestibular afferents encode the detailed time course of head rotations (Huterer and Cullen, 2002) and because regular afferents make the primary contribution for low temporal frequencies (<4 Hz) (Minor and Goldberg, 1991; Chen-Huang et al., 1997).
Whitening of sensory neural responses has been described in the visual system (Laughlin, 1981; Field, 1987) and is thought to be advantageous for neural coding as it minimizes redundancy (Attneave, 1954; Barlow et al., 1972). However, recent studies showing large amounts of redundancy during natural stimulation (Puchalla et al., 2005; Schneidman et al., 2006; Doi et al., 2012) cast doubt on this hypothesis. It has been argued that some redundancy is necessary to overcome the deleterious effects of noise and improve information transmission (Barlow, 2001; Zhaoping, 2006; Borghuis et al., 2008; Tkacik et al., 2010). We instead propose that the observed heterogeneity of afferents discussed above (i.e., differences in the response dynamics of irregular vs regular afferents) effectively achieves an efficient representation of the natural sensory environment by allowing appropriate extended temporal summation for low frequencies and simultaneously improving the detection of high-frequency components. Such parallel processing of different stimulus features appears to be a general coding strategy that is observed across systems: auditory (Oertel, 1999); and visual (Merigan and Maunsell, 1993).
As mentioned above, our findings show that environmental signals, whose frequency content follows a power law, are filtered before reaching the vestibular end organs in the head, thereby introducing deviations from power law. Thus, if one takes into account such preneuronal filtering, our results actually agree with findings from studies of other sensory modalities that rely on measurements made in the environment (e.g., natural images or sounds). It is important to note that, under natural conditions, we are not simply passively exposed to incoming sensory input but instead actively control this input through our own motor activity. For example, the observation that humans appear to minimize vertical head movements during self-motion (Pozzo et al., 1991b; e.g., Pozzo et al., 1991a; Bril and Ledebt, 1998; Cromwell et al., 2002; Cromwell et al., 2004a, b) likely has important implications for coding strategy used by the vestibular system to process vertical motion in everyday life. We hypothesize that, in most sensory modalities, the combined effects of active sensing and biomechanics significantly alter natural stimulus statistics before the first stage of neural processing. Indeed, recent studies have shown that active sensing can alter the structure of natural visual and somatosensory stimuli before any sensory transduction (Kuang et al., 2012; Moore et al., 2013). Future studies aimed at uncovering the coding strategies used to process natural stimuli should take into account the fact that the statistics of the natural signals impinging on peripheral sensory neurons differ from those of natural signals found in the environment per se.
Finally, we note that our results were obtained with young adults and that future work should focus on the statistics of the vestibular input during self-motion for different age groups. In addition, the arguments outlined above assume that either of the response dynamics of vestibular neurons or the statistics of natural vestibular stimuli are similar between humans and monkeys. Although comparison of vestibular neuron response properties across amniotes has revealed striking similarities (Fernández and Goldberg, 1971; Baird et al., 1988; Hullar et al., 2005; Sadeghi et al., 2007; Yang and Hullar, 2007; Lasker et al., 2008), further studies conducted in monkeys will be needed to test whether the statistics of natural vestibular stimuli are similar to those reported here.
Footnotes
This work was supported by Canadian Institutes of Health Research (M.J.C., K.E.C.), National Institutes of Health (K.E.C.), and Fonds de recherche du Québec—Nature et technologies (M.J.C., K.E.C.). We thank Han Kim for help with making Figure 1; Adam D. Schneider for contribution to data analysis; and Drs. Daniel Merfeld, Erik Cook, Leonard Maler, and Rudiger Krahe for careful reading of the manuscript.
The authors declare no competing financial interests.
References
- Anderson JR. The adaptive character of thought. Hillsdale, NJ: Erlbaum; 1990. [Google Scholar]
- Angelaki DE, Cullen KE. Vestibular system: the many facets of a multimodal sense. Annu Rev Neurosci. 2008;31:125–150. doi: 10.1146/annurev.neuro.31.060407.125555. [DOI] [PubMed] [Google Scholar]
- Attias H, Schreiner CE. Blind source separation and deconvolution: the dynamic component analysis algorithm. Neural Comput. 1998;10:1373–1424. doi: 10.1162/neco.1998.10.6.1373. [DOI] [PubMed] [Google Scholar]
- Attneave F. Some informational aspects of visual perception. Psychol Rev. 1954;61:183–193. doi: 10.1037/h0054663. [DOI] [PubMed] [Google Scholar]
- Baird RA, Desmadryl G, Fernández C, Goldberg JM. The vestibular nerve of the chinchilla: II. Relation between afferent response properties and peripheral innervation patterns in the semicircular canals. J Neurophysiol. 1988;60:182–203. doi: 10.1152/jn.1988.60.1.182. [DOI] [PubMed] [Google Scholar]
- Barlow H. Redundancy reduction revisited. Network. 2001;12:241–253. doi: 10.1088/0954-898X/12/3/301. [DOI] [PubMed] [Google Scholar]
- Barlow HB, Narasimhan R, Rosenfeld A. Visual pattern analysis in machines and animals. Science. 1972;177:567–575. doi: 10.1126/science.177.4049.567. [DOI] [PubMed] [Google Scholar]
- Borghuis BG, Ratliff CP, Smith RG, Sterling P, Balasubramanian V. Design of a neuronal array. J Neurosci. 2008;28:3178–3189. doi: 10.1523/JNEUROSCI.5259-07.2008. [DOI] [PMC free article] [PubMed] [Google Scholar]
- Brannon EM, Libertus ME, Meck WH, Woldorff MG. Electrophysiological measures of time processing in infant and adult brains: Weber's Law holds. J Cogn Neurosci. 2008;20:193–203. doi: 10.1162/jocn.2008.20016. [DOI] [PMC free article] [PubMed] [Google Scholar]
- Bril B, Ledebt A. Head coordination as a means to assist sensory integration in learning to walk. Neurosci Biobehav Rev. 1998;22:555–563. doi: 10.1016/S0149-7634(97)00044-4. [DOI] [PubMed] [Google Scholar]
- Burton GJ, Moorhead IR. Color and spatial structure in natural scenes. Appl Opt. 1987;26:157–170. doi: 10.1364/AO.26.000157. [DOI] [PubMed] [Google Scholar]
- Chater N, Brown GD. Scale-invariance as a unifying psychological principle. Cognition. 1999;69:B17–B24. doi: 10.1016/S0010-0277(98)00066-3. [DOI] [PubMed] [Google Scholar]
- Chen-Huang C, McCrea RA, Goldberg JM. Contributions of regularly and irregularly discharging vestibular-nerve inputs to the discharge of central vestibular neurons in the alert squirrel monkey. Exp Brain Res. 1997;114:405–422. doi: 10.1007/PL00005650. [DOI] [PubMed] [Google Scholar]
- Cromwell RL, Newton RA, Forrest G. Influence of vision on head stabilization strategies in older adults during walking. J Gerontol A Biol Sci Med Sci. 2002;57:M442–M448. doi: 10.1093/gerona/57.7.M442. [DOI] [PubMed] [Google Scholar]
- Cromwell RL, Pidcoe PE, Griffin LA, Sotillo T, Ganninger D, Feagin M. Adaptations in horizontal head stabilization in response to altered vision and gaze during natural walking. J Vestib Res. 2004a;14:367–373. [PubMed] [Google Scholar]
- Cromwell R, Schurter J, Shelton S, Vora S. Head stabilization strategies in the sagittal plane during locomotor tasks. Physiother Res. 2004b;9:33–42. doi: 10.1002/pri.298. [DOI] [PubMed] [Google Scholar]
- Cullen KE. The neural encoding of self-motion. Curr Opin Neurobiol. 2011;21:587–595. doi: 10.1016/j.conb.2011.05.022. [DOI] [PubMed] [Google Scholar]
- Cullen KE. The vestibular system: multimodal integration and encoding of self-motion for motor control. Trends Neurosci. 2012;35:185–196. doi: 10.1016/j.tins.2011.12.001. [DOI] [PMC free article] [PubMed] [Google Scholar]
- Cullen KE, Roy JE. Signal processing in the vestibular system during active versus passive head movements. J Neurophysiol. 2004;91:1919–1933. doi: 10.1152/jn.00988.2003. [DOI] [PubMed] [Google Scholar]
- De Coensel B, Botteldooren D, De Muer T. 1/f noise in rural and urban soundscapes. Acta Acust United Ac. 2003;89:287–295. [Google Scholar]
- Dehaene S. The neural basis of the Weber-Fechner law: a logarithmic mental number line. Trends Cogn Sci. 2003;7:145–147. doi: 10.1016/S1364-6613(03)00055-X. [DOI] [PubMed] [Google Scholar]
- Della Santina CC, Potyagaylo V, Migliaccio AA, Minor LB, Carey JP. Orientation of human semicircular canals measured by three-dimensional multiplanar CT reconstruction. J Assoc Res Otolaryngol. 2005;6:191–206. doi: 10.1007/s10162-005-0003-x. [DOI] [PMC free article] [PubMed] [Google Scholar]
- Doi E, Gauthier JL, Field GD, Shlens J, Sher A, Greschner M, Machado TA, Jepson LH, Mathieson K, Gunning DE, Litke AM, Paninski L, Chichilnisky EJ, Simoncelli EP. Efficient coding of spatial information in the primate retina. J Neurosci. 2012;32:16256–16264. doi: 10.1523/JNEUROSCI.4036-12.2012. [DOI] [PMC free article] [PubMed] [Google Scholar]
- Dong DW, Atick JJ. Temporal decorrelation: a theory of lagged and nonlagged responses in the lateral geniculate-nucleus. Netw Comp Neural. 1995;6:159–178. doi: 10.1088/0954-898X/6/2/003. [DOI] [Google Scholar]
- Fernández C, Goldberg JM. Physiology of peripheral neurons innervating semicircular canals of the squirrel monkey: II. Response to sinusoidal stimulation and dynamics of peripheral vestibular system. J Neurophysiol. 1971;34:661–675. doi: 10.1152/jn.1971.34.4.661. [DOI] [PubMed] [Google Scholar]
- Fernández C, Baird RA, Goldberg JM. The vestibular nerve of the chinchilla: I. Peripheral innervation patterns in the horizontal and superior semicircular canals. J Neurophysiol. 1988;60:167–181. doi: 10.1152/jn.1988.60.1.167. [DOI] [PubMed] [Google Scholar]
- Field DJ. Relations between the statistics of natural images and the response properties of cortical cells. J Opt Soc Am A. 1987;4:2379–2394. doi: 10.1364/JOSAA.4.002379. [DOI] [PubMed] [Google Scholar]
- Francisco E, Tannan V, Zhang Z, Holden J, Tommerdahl M. Vibrotactile amplitude discrimination capacity parallels magnitude changes in somatosensory cortex and follows Weber's Law. Exp Brain Res. 2008;191:49–56. doi: 10.1007/s00221-008-1494-6. [DOI] [PubMed] [Google Scholar]
- Goldberg JM. Afferent diversity and the organization of central vestibular pathways. Exp Brain Res. 2000;130:277–297. doi: 10.1007/s002210050033. [DOI] [PMC free article] [PubMed] [Google Scholar]
- Hinz B, Menzel G, Blüthner R, Seidel H. Seat-to-head transfer function of seated men: determination with single and three axis excitations at different magnitudes. Industrial Health. 2010;48:565–583. doi: 10.2486/indhealth.MSWBVI-03. [DOI] [PubMed] [Google Scholar]
- Hullar TE, Della Santina CC, Hirvonen T, Lasker DM, Carey JP, Minor LB. Responses of irregularly discharging chinchilla semicircular canal vestibular-nerve afferents during high-frequency head rotations. J Neurophysiol. 2005;93:2777–2786. doi: 10.1152/jn.01002.2004. [DOI] [PubMed] [Google Scholar]
- Huterer M, Cullen KE. Vestibuloocular reflex dynamics during high-frequency and high-acceleration rotations of the head on body in rhesus monkey. J Neurophysiol. 2002;88:13–28. doi: 10.1152/jn.2002.88.1.13. [DOI] [PubMed] [Google Scholar]
- Jamali M, Carriot J, Chacron MJ, Cullen KE. Strong correlations between sensitivity and variability give rise to constant discrimination thresholds across the otolith afferent population. J Neurosci. 2013;33:11302–11313. doi: 10.1523/JNEUROSCI.0459-13.2013. [DOI] [PMC free article] [PubMed] [Google Scholar]
- Jones GM, Spells KE. A theoretical and comparative study of the functional dependence of the semicircular canal upon its physical dimensions. Proc R Soc Lond B Biol Sci. 1963;157:403–419. doi: 10.1098/rspb.1963.0019. [DOI] [PubMed] [Google Scholar]
- Kuang X, Poletti M, Victor JD, Rucci M. Temporal encoding of spatial information during active visual fixation. Curr Biol. 2012;22:510–514. doi: 10.1016/j.cub.2012.01.050. [DOI] [PMC free article] [PubMed] [Google Scholar]
- Laming D. Sensory analysis. London: Academic; 1986. [Google Scholar]
- Lasker DM, Han GC, Park HJ, Minor LB. Rotational responses of vestibular-nerve afferents innervating the semicircular canals in the C57BL/6 mouse. J Assoc Res Otolaryngol. 2008;9:334–348. doi: 10.1007/s10162-008-0120-4. [DOI] [PMC free article] [PubMed] [Google Scholar]
- Laughlin S. A simple coding procedure enhances a neuron's information capacity. Z Naturforsch C. 1981;36:910–912. [PubMed] [Google Scholar]
- Lewen GD, Bialek W, de Ruyter van Steveninck RR. Neural coding of naturalistic motion stimuli. Network. 2001;12:317–329. doi: 10.1080/net.12.3.317.329. [DOI] [PubMed] [Google Scholar]
- Machens CK, Stemmler MB, Prinz P, Krahe R, Ronacher B, Herz AV. Representation of acoustic communication signals by insect auditory receptor neurons. J Neurosci. 2001;21:3215–3227. doi: 10.1523/JNEUROSCI.21-09-03215.2001. [DOI] [PMC free article] [PubMed] [Google Scholar]
- Mallery RM, Olomu OU, Uchanski RM, Militchin VA, Hullar TE. Human discrimination of rotational velocities. Exp Brain Res. 2010;204:11–20. doi: 10.1007/s00221-010-2288-1. [DOI] [PMC free article] [PubMed] [Google Scholar]
- Maravall M, Petersen RS, Fairhall AL, Arabzadeh E, Diamond ME. Shifts in coding properties and maintenance of information transmission during adaptation in barrel cortex. PloS Biol. 2007;5:e19. doi: 10.1371/journal.pbio.0050019. [DOI] [PMC free article] [PubMed] [Google Scholar]
- Massot C, Chacron MJ, Cullen KE. Information transmission and detection thresholds in the vestibular nuclei: single neurons vs. population encoding. J Neurophysiol. 2011;105:1798–1814. doi: 10.1152/jn.00910.2010. [DOI] [PMC free article] [PubMed] [Google Scholar]
- Massot C, Schneider AD, Chacron MJ, Cullen KE. The vestibular system implements a linear-nonlinear transformation in order to encode self-motion. Plos Biol. 2012;10:e1001365. doi: 10.1371/journal.pbio.1001365. [DOI] [PMC free article] [PubMed] [Google Scholar]
- McMahon TA. Muscles, reflexes, and locomotion. Princeton, NJ: Princeton UP; 1984. [Google Scholar]
- Merigan WH, Maunsell JH. How parallel are the primate visual pathways? Annu Rev Neurosci. 1993;16:369–402. doi: 10.1146/annurev.ne.16.030193.002101. [DOI] [PubMed] [Google Scholar]
- Minor LB, Goldberg JM. Vestibular-nerve inputs to the vestibulo-ocular reflex: a functional-ablation study in the squirrel monkey. J Neurosci. 1991;11:1636–1648. doi: 10.1523/JNEUROSCI.11-06-01636.1991. [DOI] [PMC free article] [PubMed] [Google Scholar]
- Moore JD, Deschênes M, Furuta T, Huber D, Smear MC, Demers M, Kleinfeld D. Hierarchy of orofacial rhythms revealed through whisking and breathing. Nature. 2013;497:205–210. doi: 10.1038/nature12076. [DOI] [PMC free article] [PubMed] [Google Scholar]
- Nigg BM, Liu W. The effect of muscle stiffness and damping on simulated impact force peaks during running. J Biomech. 1999;32:849–856. doi: 10.1016/S0021-9290(99)00048-2. [DOI] [PubMed] [Google Scholar]
- Oertel D. The role of timing in the brain stem auditory nuclei of vertebrates. Annu Rev Physiol. 1999;61:497–519. doi: 10.1146/annurev.physiol.61.1.497. [DOI] [PubMed] [Google Scholar]
- Pozzo T, Berthoz A, Lefort L, Vitte E. Head stabilization during various locomotor tasks in humans: II. Patients with bilateral peripheral vestibular deficits. Exp Brain Res. 1991a;85:208–217. doi: 10.1007/BF00230002. [DOI] [PubMed] [Google Scholar]
- Pozzo T, Berthoz A, Vitte E, Lefort L. Head stabilization during locomotion: perturbations induced by vestibular disorders. Acta Otolaryngol Suppl. 1991b;481:322–327. doi: 10.3109/00016489109131413. [DOI] [PubMed] [Google Scholar]
- Puchalla JL, Schneidman E, Harris RA, Berry MJ. Redundancy in the population code of the retina. Neuron. 2005;46:493–504. doi: 10.1016/j.neuron.2005.03.026. [DOI] [PubMed] [Google Scholar]
- Rieke F, Bodnar DA, Bialek W. Naturalistic stimuli increase the rate and efficiency of information transmission by primary auditory afferents. Proc Biol Sci. 1995;262:259–265. doi: 10.1098/rspb.1995.0204. [DOI] [PubMed] [Google Scholar]
- Ruderman DL, Bialek W. Statistics of natural images: scaling in the woods. Phys Rev Lett. 1994;73:814–817. doi: 10.1103/PhysRevLett.73.814. [DOI] [PubMed] [Google Scholar]
- Sadeghi SG, Chacron MJ, Taylor MC, Cullen KE. Neural variability, detection thresholds, and information transmission in the vestibular system. J Neurosci. 2007;27:771–781. doi: 10.1523/JNEUROSCI.4690-06.2007. [DOI] [PMC free article] [PubMed] [Google Scholar]
- Schneidman E, Berry MJ, 2nd, Segev R, Bialek W. Weak pairwise correlations imply strongly correlated network states in a neural population. Nature. 2006;440:1007–1012. doi: 10.1038/nature04701. [DOI] [PMC free article] [PubMed] [Google Scholar]
- Shepard RN. Toward a universal law of generalization for psychological science. Science. 1987;237:1317–1323. doi: 10.1126/science.3629243. [DOI] [PubMed] [Google Scholar]
- Simoncelli EP, Olshausen BA. Natural image statistics and neural representation. Annu Rev Neurosci. 2001;24:1193–1216. doi: 10.1146/annurev.neuro.24.1.1193. [DOI] [PubMed] [Google Scholar]
- Spoor F, Bajpai S, Hussain ST, Kumar K, Thewissen JG. Vestibular evidence for the evolution of aquatic behaviour in early cetaceans. Nature. 2002;417:163–166. doi: 10.1038/417163a. [DOI] [PubMed] [Google Scholar]
- Tkacik G, Prentice JS, Balasubramanian V, Schneidman E. Optimal population coding by noisy spiking neurons. Proc Natl Acad Sci U S A. 2010;107:14419–14424. doi: 10.1073/pnas.1004906107. [DOI] [PMC free article] [PubMed] [Google Scholar]
- Tolhurst DJ, Tadmor Y, Chao T. Amplitude spectra of natural images. Ophthalmic Physiol Opt. 1992;12:229–232. doi: 10.1111/j.1475-1313.1992.tb00296.x. [DOI] [PubMed] [Google Scholar]
- Vinje WE, Gallant JL. Natural stimulation of the nonclassical receptive field increases information transmission efficiency in V1. J Neurosci. 2002;22:2904–2915. doi: 10.1523/JNEUROSCI.22-07-02904.2002. [DOI] [PMC free article] [PubMed] [Google Scholar]
- Wakeling JM, Nigg BM, Rozitis AI. Muscle activity damps the soft tissue resonance that occurs in response to pulsed and continuous vibrations. J Appl Physiol. 2002;93:1093–1103. doi: 10.1152/japplphysiol.00142.2002. [DOI] [PubMed] [Google Scholar]
- Wakeling JM, Liphardt AM, Nigg BM. Muscle activity reduces soft-tissue resonance at heel-strike during walking. J Biomech. 2003;36:1761–1769. doi: 10.1016/S0021-9290(03)00216-1. [DOI] [PubMed] [Google Scholar]
- Wallman J, Velez J, Weinstein B, Green AE. Avian vestibuloocular reflex: adaptive plasticity and developmental changes. J Neurophysiol. 1982;48:952–967. doi: 10.1152/jn.1982.48.4.952. [DOI] [PubMed] [Google Scholar]
- Yang A, Hullar TE. Relationship of semicircular canal size to vestibular-nerve afferent sensitivity in mammals. J Neurophysiol. 2007;98:3197–3205. doi: 10.1152/jn.00798.2007. [DOI] [PubMed] [Google Scholar]
- Zanker JM. On the elementary mechanism underlying secondary motion processing. Philos Trans R Soc Lond B Biol Sci. 1996;351:1725–1736. doi: 10.1098/rstb.1996.0154. [DOI] [PubMed] [Google Scholar]
- Zatiorsky VM. Kinematic of human motion, human kinetics edition. New York: Human Kinetics; 1998. [Google Scholar]
- Zhaoping L. Theoretical understanding of the early visual processes by data compression and data selection. Network. 2006;17:301–334. doi: 10.1080/09548980600931995. [DOI] [PubMed] [Google Scholar]