

Abstract
Sensory processing in the auditory system requires that synapses, neurons, and circuits encode information with particularly high temporal and spectral precision. In the amphibian papillia, sound frequencies up to 1 kHz are encoded along a tonotopic array of hair cells and transmitted to afferent fibers via fast, repetitive synaptic transmission, thereby promoting phase locking between the presynaptic and postsynaptic cells. Here, we have combined serial section electron microscopy, paired electrophysiological recordings, and Monte Carlo diffusion simulations to examine novel mechanisms that facilitate fast synaptic transmission in the inner ear of frogs (Rana catesbeiana and Rana pipiens). Three-dimensional anatomical reconstructions reveal specialized spine-like contacts between individual afferent fibers and hair cells that are surrounded by large, open regions of extracellular space. Morphologically realistic diffusion simulations suggest that these local enlargements in extracellular space speed transmitter clearance and reduce spillover between neighboring synapses, thereby minimizing postsynaptic receptor desensitization and improving sensitivity during prolonged signal transmission. Additionally, evoked EPSCs in afferent fibers are unaffected by glutamate transporter blockade, suggesting that transmitter diffusion and dilution, and not uptake, play a primary role in speeding neurotransmission and ensuring fidelity at these synapses.
Keywords: auditory, diffusion, glutamate, hair cell, ribbon synapse, synapse
Introduction
Encoding and transmission of information in the nervous system involves many probabilistic and/or inherently variable biological processes that can limit the fidelity of the transmitted information. To effectively encode an enormously broad range of sensory stimuli, sensory organs must exploit biophysical mechanisms that are at least as fast and reliable as the encoded stimuli (for review, see Laughlin, 2001). In chemical synaptic transmission, an essential but inherently variable biological process, neurotransmitter released from a presynaptic neuron diffuses across a narrow synaptic cleft to convey signals to postsynaptic targets. Because chemical signaling relies on random diffusion, mechanisms that take up or break down extracellular neurotransmitter typically ensure that the spatiotemporal profiles of synaptically released neurotransmitter are sufficiently short-lived and localized to individual synapses (i.e., synapse-specific). This latter demand is particularly important in brain regions with high densities of synaptic connections, such as the hippocampus, where 95% of synapses are separated from their nearest neighbors by <1 μm (Ventura and Harris, 1999). Under these conditions, coincident release from a few local synapses (Arnth-Jensen et al., 2002) and possibly release from only a single synapse (Rusakov and Kullmann, 1998; but see Barbour, 2001) are capable of activating receptors at neighboring synapses. This type of synaptic crosstalk may degrade the information capacity (e.g., synaptic independence, speed) required for some neural computations.
In the auditory system, precise timing of sensory signals critically underlies very fast neural computations. For example, to compare the arrival of a sound stimulus in the two ears (the interaural time delay), auditory pathways must encode sensory input with submillisecond precision (Wagner et al., 2005; Funabiki et al., 2011). As a result, synaptic specializations throughout the auditory pathway appear to be particularly optimized for speed and sensitivity. Sound is encoded by hair cells and transmitted to afferent fibers via specialized “ribbon” synapses that enhance sensitivity and dynamic range (for review, see Nouvian et al., 2006; Matthews and Fuchs, 2010). Signals traversing this initial synapse in the auditory pathway are extremely fast and must remain so during prolonged stimulation to maintain temporal precision during high-frequency synaptic release.
Here, we studied the morphology and physiology of synaptic connections between hair cells and afferent fibers in the amphibian papilla (Keen and Hudspeth, 2006; Li et al., 2009; Graydon et al., 2011), a primary sound-encoding region in amphibians, to determine how a synapse with well-described functional constraints uses connectivity and synaptic morphology to maximize signaling fidelity. Using a combination of electrophysiology recordings, serial electron micrograph reconstructions, and diffusion simulations, we find that amphibian papilla hair cell afferent synapses effectively minimize postsynaptic desensitization and synaptic crosstalk during modes of fast physiological signaling. This is accomplished by employing multiple ribbon-type synaptic contacts to improve reliability and fast sound onset encoding, as well as enlarged perisynaptic extracellular spaces, created by distinctive postsynaptic specializations, to facilitate local dilution of released glutamate and enhance synaptic specificity.
Materials and Methods
Hair cell preparation.
All procedures followed Institutional Animal Care and Use Committee-approved protocols and guidelines at Oregon Health & Science University or National Institutes of Health. Amphibian papillae were carefully dissected from adult male or female bullfrogs (Rana catesbeiana) that had been sedated in ice water bath, double-pithed, and decapitated, as described by Keen and Hudspeth (2006) and Li et al. (2009). Papillae were stretched to split open the sensory epithelium to gain access to hair cells and their fibers. In doing so, it is possible that we may have disturbed the normal location and function of support cells, potentially causing us to underestimate the role of glutamate transporters on support cells. Split-open preparations of hair cells and their connecting afferent fibers were placed in a recording chamber with oxygenated artificial perilymph containing the following (in mm): 95 NaCl, 2 KCl, 2 CaCl2, 1 MgCl2, 25 NaHCO3, 3 glucose, 1 creatine, 1 Na-pyruvate, pH adjusted to 7.30 with NaOH, and continuously bubbled with 95% O2 and 5% CO2 (230 mOsm). During the recordings, the preparation was perfused continuously (2–3 ml/min) with oxygenated artificial perilymph. All experiments were conducted at room temperature (22°C–25°C).
Electrophysiology.
Whole-cell patch-clamp recordings and measurements of membrane capacitance (Li et al., 2009; Cho et al., 2011) were performed with an EPC-10 USB double patch-clamp amplifier (HEKA) and Patchmaster software (HEKA). Hair cells and connecting afferent fibers were viewed with an Olympus BX51WI microscope through a 60× water-immersion objective lens (Olympus) and digital CCD camera (QImaging). For whole-cell recordings, patch pipettes of borosilicate glass (World Precision Instruments) were pulled with a Narshige PP-830 puller to resistances of 6–7 mΩ for hair cells and 8–10 mΩ for afferent fibers. Pipettes were filled with the internal solution containing the following (in mm): 77 Cs-gluconate, 20 CsCl, 1 MgCl2, 10 TEA-Cl, 10 HEPES, 2 EGTA, 3 Mg-ATP, 1 Na-GTP, and 5 Na2-phosphocreatine (adjusted to pH 7.3 with CsOH). Hair cells and afferent fibers were held at a resting membrane potential of −90 mV. Membrane potentials were corrected for an estimated liquid junction potential of 10 mV. The current signal was low-pass filtered at 2.9 kHz and sampled at 10 μs intervals.
The drugs dl-threo-β-benzyloxyaspartic acid (TBOA) (Tocris Bioscience) and cyclothiazide (CTZ; Tocris Bioscience) were applied by perfusion (2–3 ml/min) for at least 3–4 min before measurements were taken.
Data analysis.
Data analysis on electrophysiology datasets was performed with Igor Pro software (Wavemetrics) and Prism (GraphPad Software). Statistical significance was assessed with unpaired Student's t tests with p < 0.05 considered significant. Data are expressed as mean ± SEM. Peak channel activity (i.e., Po) was used to calculate the coefficient of variation (CV= SD/mean) in Figure 6C.
Figure 6.
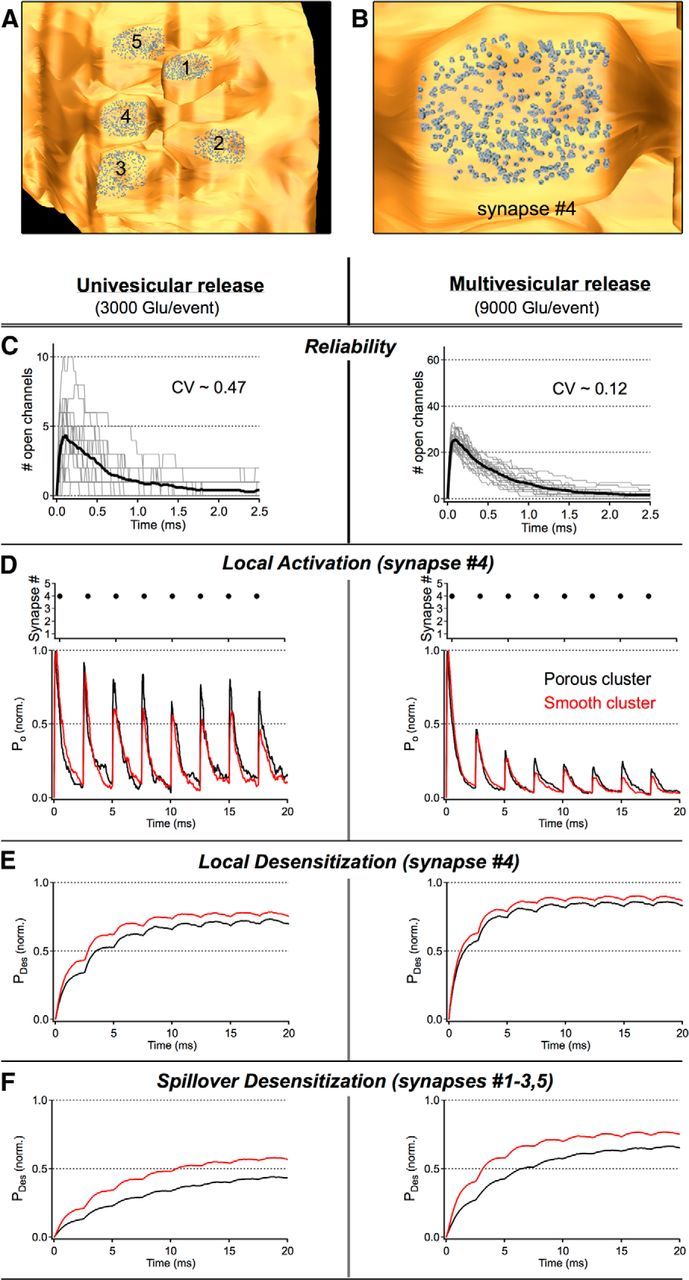
High-frequency release from a single synapse can cause both local and spillover desensitization. A, The 400 AMPARs (using the Raman and Trussell Markov scheme) were randomly tiled on the postsynaptic membranes of each of the 5 synapses in our reconstructed fiber. B, A zoomed view of the AMPAR tiling on synapse #4 of the reconstruction. C, The reliability of neurotransmission at synapse #4 was measured in response to the release of 3000 (univesicular release; left) or 9000 (multivesicular release; right) glutamate molecules from the center of the cleft at t = 0 ms across 20 different trials (i.e., different random seeds). The dramatic improvement in the reliability of the responses to multivesicular release is attributable, in part, to the stimuli probing a nonlinear region of the glutamate-receptor activation curve. The CV (SD/mean) was calculated from the peak channel openings across trials. D–F, Four hundred Hertz neurotransmission was simulated at a single synapse by releasing either 3000 (left) or 9000 (right) glutamate molecules from synapse #4 every 2.5 ms while monitoring activation (i.e., the fraction of AMPARs in open states, PO) and desensitization (i.e., the fraction of AMPARs in desensitized states, PDES) at each of the 5 synapses in the cluster. D, In response to 400 Hz signaling, the gain of the local response (i.e., activation) was reduced for events occurring late in the stimulus train, an effect that was exacerbated by a larger quantal content (i.e., MVR) and/or a reduction in the local ECVF (i.e., smooth/modified cluster). Activation traces are normalized to the peak response of the first event in the sequence. E, Underlying this persistent gain change was a buildup of local receptor (i.e., at synapse #4) desensitization that reduced the number of receptors that are available to be activated by subsequent release events. Desensitization is reported here as the fraction of synaptic receptors in desensitized states at synapse #4 over time. F, Although release from a single synapse was rarely sufficient to trigger activation at neighboring synapses in the cluster, transmitter spillover did give rise to significant desensitization at quiescent synapses. Spillover desensitization is reported here as the fraction of all synaptic receptors in desensitized states in the 4 quiescent synapses in the cluster (i.e., synapses 1–3, 5) over time. D–F, Data are averages of 20 trials.
Electron microscopy.
Amphibian papilla tissue was prepared for electron microscopy as previously described (Graydon et al., 2011). Briefly, after excision from the surrounding bone, the inner ears of either R. pipiens or R. catesbeiana were immersed in a fixative of 2.5% glutaraldehyde/2% PFA/0.1 m cacodylate buffer, pH 7.3. Tissue was postfixed in 1% osmium, stained with 2% aqueous uranyl acetate, and embedded in EMbed 812 resin (Electron Microscopy Sciences). Serial sections 150 nm in thickness were imaged in a JEOL 1010 electron microscope (80 kV) at 2500× magnification. Subsequent reconstructions and measurements were performed using Reconstruct (Fiala, 2005), Adobe Photoshop (Adobe Systems), and Blender (www.blender.org). Tomographic datasets were acquired as previously described (Graydon et al., 2011).
Analysis of ribbon synapse spatial distribution.
After alignment and reconstruction of serial section datasets, measurements of intersynaptic distances (made from synaptic centers) were made in Reconstruct. Because the average distance between synapses (∼1.5 μm) was approximately an order of magnitude smaller than the diameter of the hair cell (∼15 μm), we considered the hair cell's synaptic pole as a flat surface to simplify analysis. The membrane included in the calculation of synapse density (λ) was defined as all membrane basal to the “belt” created by connecting the apical-most ribbon synapses. The calculation of a randomly spaced synapse distribution followed that of Wässle and Riemann (1978). Because a minimum distance must separate distinct synapses (i.e., ribbon synapses cannot overlap spatially), the density of synapses used to calculate a random distribution must be corrected (λ*). Scripts written in GNU Octave (www.octave.org) were used to determine the corrected density, assuming ∼700 nm diameter ribbon synapses. From this, the probability of a nearest neighbor synapse at a given distance (r) was calculated as follows:
 |
Because ribbon synapses in these hair cells have a circular footprint on the presynaptic membrane, the calculation of maximal synapses spacing was derived from hexagonal circle packing such that:
 |
Analysis of fiber branching and synapse connectivity.
Weighted adjacency matrices incorporating intersynaptic distances, spanning tree, and shortest path algorithm calculations were performed using the open-source mathematics software Sage (version 4.7.2; www.sagemath.org). Because nearest neighbor synapse distributions did not show any nearest neighbor distances >5 μm (e.g., see Fig. 1C), only intersynaptic distances <5 μm were included in the weighted adjacency matrices. As such, the nearest neighbor distances of randomly generated spanning trees were restricted to the range we observed in our reconstructions (i.e., there were no unrealistically long distance connections from one side of the cell to the other). To generate a distribution of random spanning trees, a script was written in GNU Octave to generate 10,000 spanning trees by means of a random walk (e.g., see Wilson, 1996).
Figure 1.
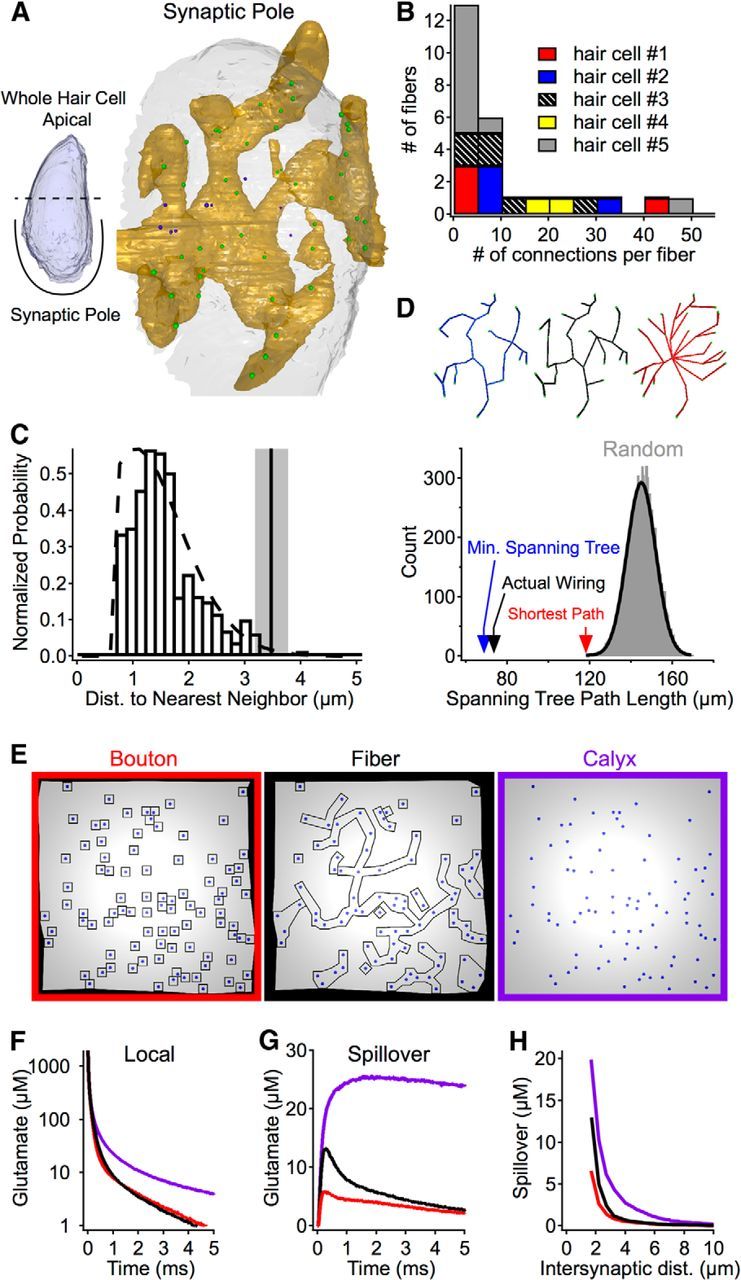
Comparison of different afferent fiber–ribbon synapse contact morphologies. A, Ribbon synapse spacing and postsynaptic fiber innervation were analyzed in serial EM reconstructions of the hair cell's synaptic pole. Hair cell membrane (white), postsynaptic fiber (gold), and ribbons (green spheres represent ribbons presynaptic to shown fiber; purple spheres represent ribbons presynaptic to other fibers; data not shown). B, Stacked bar graph of data from reconstructions showing the convergence and divergence of synaptic connections. C, The distribution of nearest-neighbor distances between ribbon synapses for four reconstructed hair cells (bars), along with the calculated distribution of randomly spaced synapses (dashed line) and the distance of evenly spaced synapses (hexagonal array) at the same density observed in the reconstructed cells (vertical line with gray shading represents mean ± SD, n = 4). D, Analysis of the branching patterns of a reconstructed fiber (example shown is fiber in A). Top, The actual branching pattern (black skeleton) connecting ribbons compared with the calculated minimum spanning tree (using Kruskal's algorithm, blue skeleton) and the shortest paths from a single synapse (using Dykstra's algorithm, red skeleton). Bottom, A comparison of the total path lengths required for each branching pattern (colored arrows), along with the distribution of total path lengths resulting from randomly generated branching patterns (gray bars) fit by a Gaussian function (black line). E, Overhead views of simulations with the same distribution of ribbon synapses, but with different contact morphologies. Synaptic cleft gaps were 20 nm in all simulations, and extracellular space surrounding boutons and fibers was 50 nm. F, The average glutamate waveform at the releasing synapse (all synapses have been averaged) for the different morphologies in E. G, The average spillover glutamate waveform (spillover is from all synapses). H, The average peak glutamate spillover at synapses plotted as a function of the distance between synapses.
Computational modeling.
Three-dimensional reconstructions of representative postsynaptic fiber morphologies (see Fig. 1E) and a cluster of HC-afferent fiber synaptic contacts (see Figs. 4B–E, 6A,B, and 7A,B) with surrounding neuropil environment were edited in Blender and imported into MCell, a Monte Carlo diffusion and microphysiology simulator program (Stiles et al., 1996; Stiles and Bartol, 2001). Reconstructions were edited such that the presynaptic and postsynaptic membranes/contacts (i.e., the synaptic cleft) were separated by 20 nm gaps. For simulations comparing postsynaptic fiber morphologies (see Fig. 1), a 26 μm × 26 μm array of synapses (400 nm diameter circular regions; Fig. 1E, dots) was generated at the density observed in our reconstructions and a minimum spacing of 0.7 μm (i.e., synapses could not overlap). The postsynaptic contact zones (where the membranes closely appose the hair cell) for the bouton condition were 1 μm2 (within the range reported in Merchan-Perez and Liberman, 1996), and fiber contact zones were constructed by linking bouton contact zones. The gaps of extracellular space surrounding contact zones were 50 nm for the bouton and fiber simulations (Kinney et al., 2013). Glutamate that diffused out of the side of the simulation, or >2 μm down an extracellular gap, was absorbed by a bounding box (24 × 24 × 2 μm) and removed from the simulation. Simulations with gaps of 20 and 100 nm were also run (encompassing a broad range of potential extracellular spacing scenarios) (Kinney et al., 2013), with qualitatively similar results. For these simulations 3000 glutamate molecules were released from the center of each synapse. To reduce edge effects, only synapses from the central 20 μm × 20 μm region were included in analysis.
Figure 4.
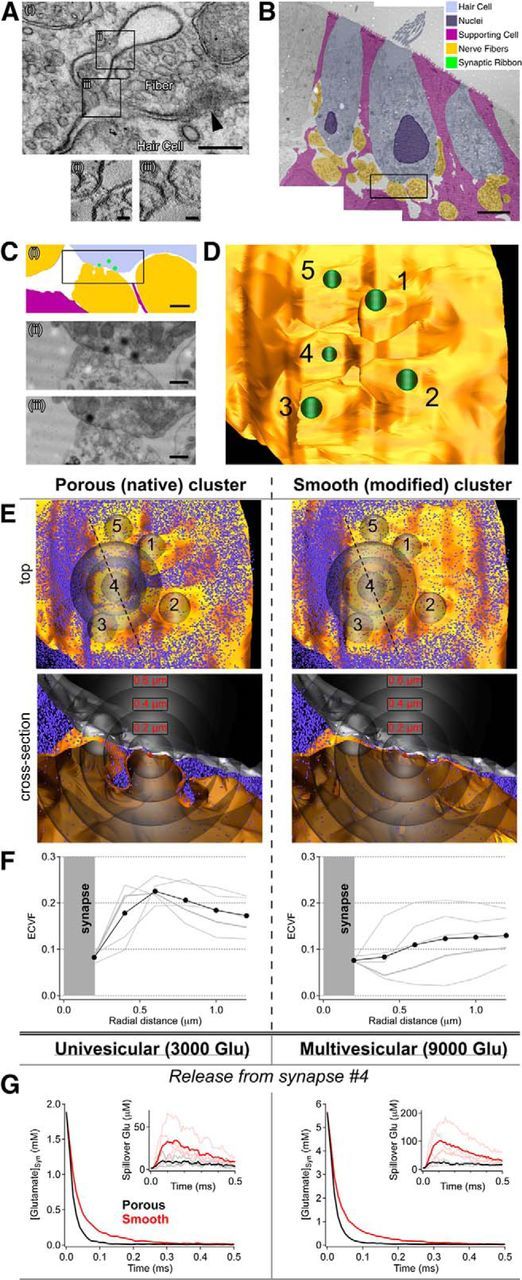
Spacious, spine-like synaptic connections have large local ECVFs that support fast synaptic glutamate signaling and minimal transmitter spillover. Ai, Electron micrograph of a grazed ribbon synapse (arrowhead) section showing infolding of the postsynaptic membrane proximal to the synapse. Closer inspection with electron tomography (Aii,iii) revealed filamentous proteins spanning the membrane. Scale bars: Ai, 200 nm; Aii, iii, 35 nm. Aii, iii, Tomographic sections are 5 nm thick. B, Montage of electron micrographs used for serial reconstruction with colored overlay. Scale bar, 5 μm. Ci, Zoom of boxed region in B, and two example serial sections (Cii,iii) from the boxed region in Ci, showing infolding of the postsynaptic membrane. Scale bars: Ci, 1 μm; Cii, iii, 0.5 μm. D, Overhead view of a reconstruction of the fiber in C, showing the locations of 5 clustered ribbons (green) and the enlarged extracellular spaces separating their postsynaptic contacts. E, The reconstruction from D (including neighboring fibers, local support cells, and the base of the hair cell) was tested in a diffusion simulation environment (i.e., MCell; see Materials and Methods). To determine the effects of local pores, we also ran simulations using a modified postsynaptic structure with reduced perisynaptic spaces. F, Local ECVF was quantified by volume exclusion measurement (see Materials and Methods); cumulative ECVF is plotted as a functional of radial distance from the center of each of the 5 synapses in the cluster (e.g., an ECVF of 0.1 at 0.2 μm indicates that within a 200 nm-radius sphere centered on the synapse, 10% of the volume is occupied by extracellular space). The local (<600 nm) ECVF in the native/porous environment was nearly double that of the modified/smooth contacts. G, In simulations, the porous morphology (black) produced faster glutamate clearance times (glutamate released into synaptic cleft 4) and less glutamate spillover (i.e., crosstalk, inset) than the modified structure (red, all other parameters held constant). Synaptic transmission was simulated by releasing one (i.e., univesicular release) or several (i.e., multivesicular release) quanta of glutamate (3000 glutamate per quanta) while continually monitoring glutamate at each of the five synapses.
Figure 7.
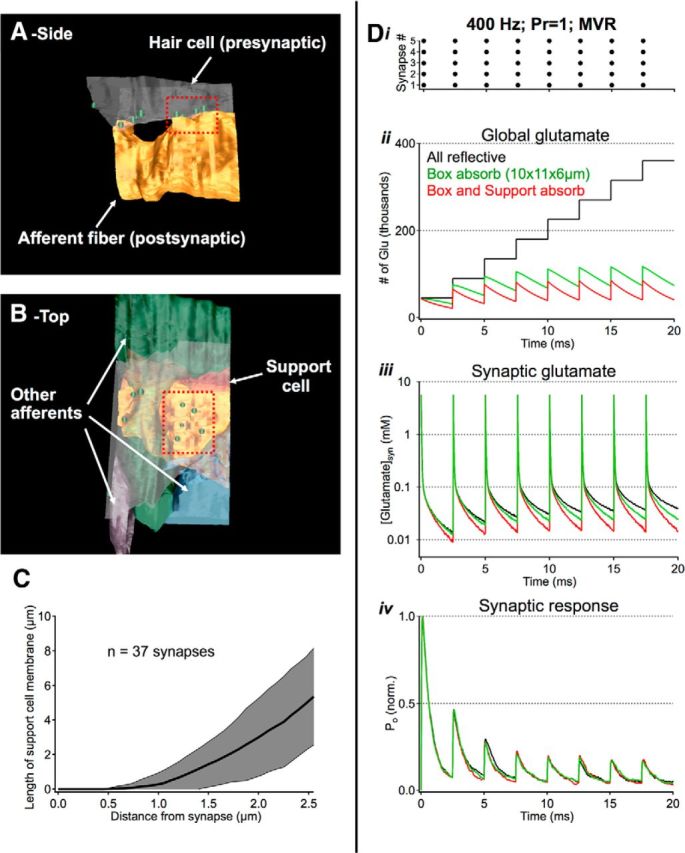
Active transport does little to shape rapid synaptic signaling. A, Zoomed out view of reconstruction used for synaptic simulations in Figures 4 and 6–8. B, The reconstructed environment included three other afferent fibers and one support cell (red). C, 2D analysis of individual micrographs indicates that most support cell membranes are >1 μm from individual synapses, limiting their ability to shape fast synaptic signaling. D, Exploration of active uptake during high-frequency release. i, Stimulus: 400 Hz release from all 5 synapses in the cluster, 9000 glutamate molecules released per event. ii–iv, A large absorptive bounding box (10 × 11 × 6 μm) helped to speed simulation time while making minimal contributions to local synaptic signaling. Contributions from support cells were tested by making their membranes absorptive to glutamate. This manipulation helped reduce global glutamate concentrations but had negligible effects on fast synaptic signaling.
To test the impact of locally enlarged extracellular volume fraction (ECVF) in electron microscopy reconstructions on signaling performance, the postsynaptic surface was modified such that the gap between the hair cell and afferent fiber membranes was a consistent 20 nm throughout the entire cluster (i.e., filled-in pores or smooth cluster). Measurements of ECVF in the complex neuropil environment were derived using volume exclusion simulations: First, all sides of the reconstructed environment were replaced with reflective surfaces to fully enclose the extracellular space contained within the reconstructed volume. Next, 10,000 molecules were released into the fully enclosed extracellular space, and diffusion simulations were run until these molecules had evenly distributed within the enclosed extracellular space. A series of transparent counting spheres, centered on each of the five synapses, with radii from 0.2 to 1.2 μm in 0.2 μm increments were then used to count the number of molecules within the equilibrated extracellular space of the closed model (see Fig. 4E). These values were compared with the concentration measured within a transparent counting box, strategically placed within the extracellular space to allow for complete filling (i.e., no reflective surfaces contained within the volume), to derive the ECVF within each counting sphere. Cumulative ECVFs are plotted as a function of radial distance from the center of each of the 5 synapses (see Fig. 4F, gray lines).
For simulations of synaptic transmission (see Figs. 6–8) an absorptive bounding box (10 × 11 × 6 μm) was implemented to speed computation time. This implementation only minimally altered synaptic signaling on the time scale of the simulations presented here (20 ms) compared with simulations run without an absorptive bounding box (see Fig. 7). Uniquantal (3000 “glutamate” molecules per event; same as Fig. 1) or multiquantal (9000) transmission was simulated by releasing glutamate from a point source <1 nm from the presynaptic membrane surface, just below the associated ribbon. Direct measurements indicate that glutamine diffuses through aqueous solution with a diffusion coefficient of 7.6 × 10⁻⁶ cm2s−1 at room temperature (Longsworth, 1953); thus, this value was used for all simulations of synaptic transmission included in the study. It should be noted that the absolute value for the effective diffusion coefficient for glutamate in neural tissue remains an ongoing debate. In general, glutamate diffusion through the neuropil is hindered by geometric structures (i.e., boutons, spines, dendrites, etc.) and solution viscosity. Modeling diffusion in the “real” synaptic microenvironment largely accounts for geometric tortuosity. The viscosity of extracellular solution in the native environment is ∼10% higher than that of water, but reducing the diffusion coefficient by a factor of 2 had negligible effect on the results presented here. Postsynaptically, each synapse was randomly tiled with 400 immobile AMPARs whose kinetic schemes were directly taken from Raman and Trussell (1995). The Raman and Trussell model had the additional advantage of being derived from pulled-patch recordings at 25°C, making it consistent with the cold-blooded nature of bullfrogs and the recording conditions in Figures 2 and 3 (i.e., 22°C–25°C). The number of AMPA receptors was calculated based on an approximate PSD diameter of 400 nm (see Fig. 6A,B) and a receptor density of ∼3000 particles μm−2 reported for mammalian auditory fiber PSDs (Saito, 1990). In the context of the simulations, the probability of release (Pr) was defined as the probability that a given synapse releases on a given stimulus cycle. All simulations were run with 10 ns time steps, and the results were averaged from 10 to 20 simulations run with different random number seeds. Simulation output was imported and analyzed in MATLAB (MathWorks) and IGOR Pro.
Figure 8.
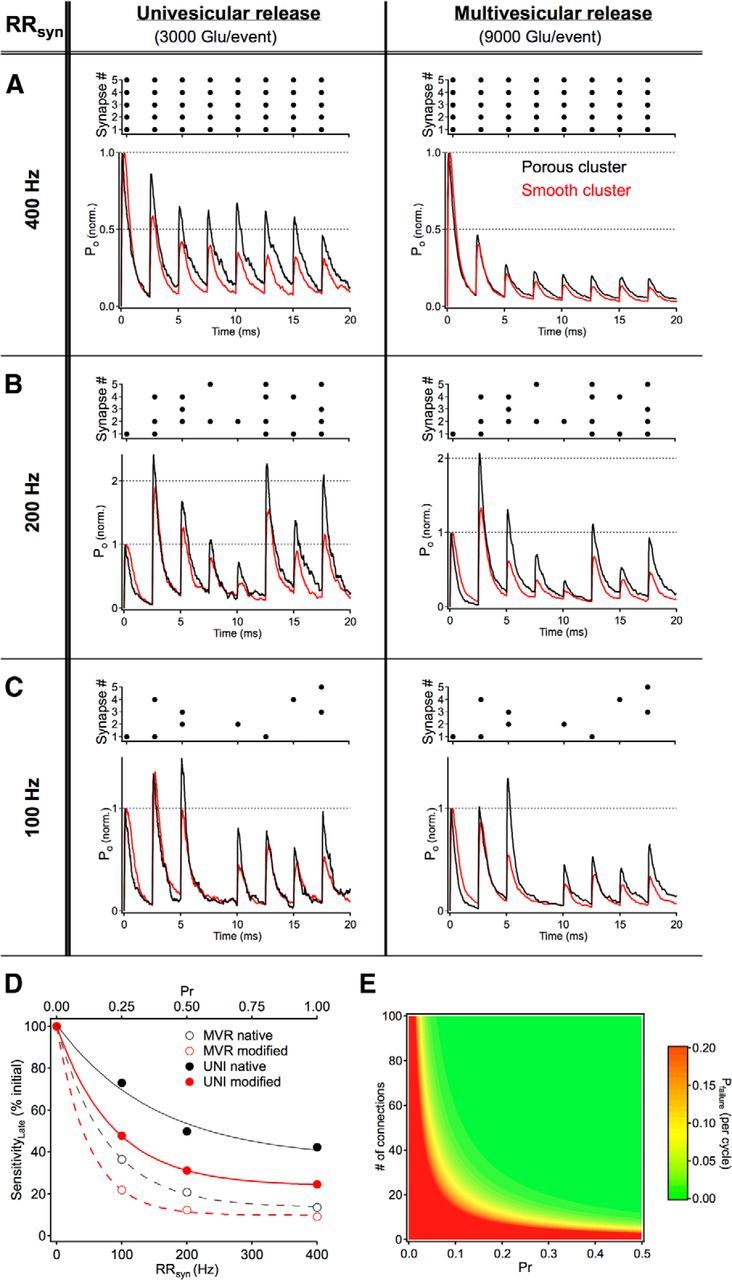
Enlarged local ECVFs enhance signaling over a range of possible physiological signaling conditions. The exact patterns of synaptic release occurring at subsets of hair cell output synapses under physiological conditions remain to be determined, but microphysiology simulations were used to probe a range of likely scenarios. Under modes of perfectly synchronized release across all synapses (individual synaptic release rates, RRsyn, of 400 Hz, A), the postsynaptic response (i.e., the summed response of AMPARs in open states, PO, across synapses) ran down as a result of postsynaptic receptor desensitization (responses are normalized to the peak of the first response in the sequence). This effect occurred regardless of the quantal content (i.e., 3000 or 9000 glutamate molecules per event) and was exacerbated by reducing the local ECVF of the cluster (red traces). It is also possible that, instead of reducing the quantal content (i.e., multivesicular → univesicular), individual synapses might skip cycles of the presynaptic stimulus (i.e., an effective reduction in individual synaptic release rate). This possibility was simulated by randomly eliminating 50% of the release events from the 20 ms stimulus train (B). As expected, a reduction in the total amount of glutamate released within the stimulus period led to less postsynaptic receptor desensitization and therefore less postsynaptic depression. Further reducing the probability that a particular synapse will fire on a given cycle continued to improve sensitivity of the cluster to subsequent release events, but inevitably, low release probabilities result in “skipped” cycles in which no transmitter is released from any of the synapses in the cluster (C, fourth cycle). All traces are the average of 10 simulations using different random number seeds with each trial/seed using the same release pattern (top of each panel). D, The sensitivity to glutamate release during high-frequency synaptic transmission is strongly dependent on quantal content, release probability, and perisynaptic enlargements in extracellular space. Sensitivity (i.e., response amplitude divided by the number of active synapses on a given cycle) to glutamate released late in the high-frequency release train was measured (see Materials and Methods) and expressed as a percentage of the initial sensitivity. E, The probability that an entire population of synaptic connections will fail to release transmitter (Pfailure) was determined using Poisson statistics on the number of connections between neurons and the probability that any particular synapse will release on a given cycle.
Figure 2.

TBOA, a glutamate transporter blocker, does not significantly alter synaptic transmission at hair cell synapses. Recordings of EPSCs were made from postsynaptic fibers while the presynaptic hair cell (best frequency: ∼400 Hz) was depolarized from −90 mV to −30 mV in control conditions (black) and in the presence of TBOA (red). A, Representative traces of Ca2+ currents (ICa) and membrane capacitance (Cm) from presynaptic hair cells and EPSCs evoked by a single 20-ms-long voltage step. Capacitance was measured by superimposing a 1 kHz sine wave on the holding potential before and after the voltage step (top). B, A 3-s-long step elicited robust EPSC throughout the step duration. C, D, Postsynaptic responses to a 20 ms (C) and 100 ms (D) presynaptic train of 1 ms voltage steps at 400 Hz (totaling 8 steps or 40 steps, respectively). For both train protocols, EPSCs were elicited reliably and with few failures. E, F, Across all stimulation protocols (n = 6–17 pairs), no significant changes (unpaired t test) in average EPSC charge (QEPSC; E) or the time course of EPSC decay (τdecay; F) occurred with TBOA treatment (red bars) compared with control conditions (black bars).
Figure 3.

Effects of CTZ, a blocker of AMPA receptor desensitization, on hair cell synapses. Recordings of EPSCs were made from postsynaptic fibers while the presynaptic hair cell was depolarized from −90 mV to −30 mV in control conditions (black) and with CTZ alone (blue) or TBOA + CTZ (purple). A, Representative traces of Ca2+ currents (ICa) from presynaptic hair cells and EPSCs evoked by a single 20 ms presynaptic voltage step. B, C, Summary of EPSC charge (QEPSC; B) and the time course of EPSC decay (τdecay; C) in response to 20 ms presynaptic step. CTZ alone (blue) or TBOA with CTZ (T + C; purple) significantly increased QEPSC and τdecay. The effects of CTZ with TBOA were not significantly different from the effects of just CTZ on QEPSC or τdecay. D, Representative EPSCs evoked by a 3-s-long voltage step in control solution (black) and with CTZ (blue). The early portions of the EPSCs (i) were enhanced, and the decay times at response offset (ii) were prolonged in CTZ. E, Representative EPSCs evoked by a 100 ms train of 1 ms presynaptic voltage steps at 400 Hz in control conditions (black) and with TBOA + CTZ (purple). The decay times of the final EPSCs became slower in the presence of TBOA + CTZ (expanded inset). F, G, Summary of QEPSC (F) and τdecay (G) in response to 100 ms trains of 1 ms presynaptic voltage steps at 400 Hz. CTZ alone (blue) or TBOA plus CTZ (T + C; purple) significantly increased τdecay but did not significantly change QEPSC. The effects of CTZ + TBOA were not significantly different from the effects of CTZ alone in either case. *p < 0.05 (unpaired t test). **p < 0.01 (unpaired t test). ***p < 0.001 (unpaired t test). Number of pairs for each condition are indicated in parentheses.
The reliability of signaling based on different wiring configurations was modeled explicitly in Figure 9 by examining probabilistic signaling for a varying number of synaptic connections (with fixed presynaptic vesicle availability and assuming only one active zone per synapse for simplicity). A total of 1000 trials were run for each value of Pr in the single connection scenario (mammalian fiber) presented in Figure 9A, 200 trials for the each value of Pr in Figure 9B, and 100 trials for each value of Pr in Figure 9C. For each trial, a release event was initiated when a randomly generated number (between 0 and 1) was less than Pr. The amplitude of each release event was then chosen randomly from the 20 postsynaptic responses to the release of 3000 or 9000 molecules of glutamate (see Fig. 6C). The CV was then calculated across trials (SD/mean). For comparison release variability was also calculated for a noise-less release process (i.e., no variability in the postsynaptic response to identical release events) using the following equation:
 |
where N is the number of connections.
Figure 9.

Comparing reliability across species with different wiring conditions. The reliability (measured as the CV) of the summated postsynaptic response as a function of the number of connections (A, n = 1; B, n = 12; C, n = 41), Pr, and transmission mode (i.e., UVR, MVR, no local variability). A, Single contacts, like that observed in the mammalian cochlea, exhibit highly variable responses. In this scenario, local variability in the synaptic response limits the reliability of transmission. B, C, Multiple synaptic contacts onto each fiber, like that observed in the amphibian papilla, dramatically improve reliability and minimize the total impact of local variability in the synaptic response. These conditions also greatly expand the range of release probabilities that can provide highly reliable signals.
The transmitter–receptor relationships presented in Figure 5 for the hidden Markov models from Raman and Trussell (1995) and Häusser and Roth (1997) were established using Channelab (Synaptosoft) using the fourth-order Runga Kutta method (0.1 ms time steps). Throughout the manuscript, R3 of the Raman and Trussell was included as a desensitized state.
Figure 5.

Desensitization of fast AMPARs is highly sensitive to transmitter time course. A, We examined the macroscopic glutamate-receptor interaction for a well-studied hidden Markov model of native AMPARs from auditory neurons (nMAG) in avian (Raman and Trussell, 1995). This AMPAR model exhibits faster kinetics that closely match those recorded from afferent fibers in the amphibian papilla (Keen and Hudspeth, 2006; Graydon et al., 2011). B, We also tested a Markov model from the cerebellum (Häusser and Roth, 1997). i, ii, Activation (open states; black) and desensitization (desensitized states; red) were monitored in response to brief (0.1 ms, left) or long (10 ms, right) exposures to glutamate. ii, Exposure to higher concentrations of glutamate elicited brief channel activation and long-lasting receptor desensitization. iii, Exposure to low concentrations (20 μm) of glutamate promoted significant receptor desensitization without eliciting channel activation. iv, An exploration of parameter space (i.e., duration and concentration) illustrates that activation (left) has a weak dependence on the duration of agonist exposure, whereas desensitization (right) has a strong dependence on duration. S-S, Steady-state glutamate application.
Results
Afferent fiber branching is optimized for wiring economy, not synaptic independence
Four hair cells (two from R. catesbeiana and two from R. pipiens) in the 400–500 Hz region of the amphibian papilla were reconstructed by serial electron microscopy (EM), and the locations of ribbon synapses (69 ± 16 ribbon synapses per hair cell, n = 4; Graydon et al., 2011) throughout the basolateral synaptic pole were determined (Fig. 1A). Reconstructions from five hair cells (three from R. catesbeiana and two from R. pipiens) showed that hair cells typically had one dominant postsynaptic fiber that contacted >20 ribbons and a number of smaller fibers contacting <10 ribbons each (Fig. 1B). Presynaptically, the distances between nearest neighbor synapses in these cells (Fig. 1C) closely resembled the distribution expected for randomly spaced synapses (dashed line), and the mean nearest neighbor distance was much less than that expected for evenly, hexagonally spaced synapses at the same density (vertical line; mean nearest neighbor distance = 1.55 μm vs evenly spaced distance = 3.47 μm). Accordingly, a significant fraction of the ribbon synapses (17 ± 7%; n = 4 hair cells) had a nearest neighbor within 1 μm.
Multiple synaptic connections could improve the reliability of transmission to afferent fibers (Bagnall et al., 2011), but the consequent possibility of glutamate spillover between closely spaced neighbors suggests that release from one synapse within a cluster of synapses may influence the efficacy of the adjacent synapses. In principle, a postsynaptic fiber could mitigate spillover between closely spaced neighboring synapses by approaching each synapse from a different direction, thereby increasing the extent of local escape routes for glutamate and leaving a gap of extracellular space in between postsynaptic processes (e.g., extracellular “tunnels”; Kinney et al., 2013). For three large reconstructed fibers, we compared the actual wiring pattern (Fig. 1D, black traces) to two optimal wiring strategies: the minimal spanning tree (blue traces), which minimized the total path length required; and the shortest path (red traces), which minimized the path length to each synapse from a central reference synapse (Kruskal, 1956; Dijkstra, 1959). For all three fibers (data for fiber in Fig. 1A shown in Fig. 1D), the actual wiring path length was significantly shorter (>4 SDs) than randomly generated wiring patterns (gray distribution) and comparable with the optimal wiring strategies (arrows). This minimization of total fiber length suggests an emphasis on wiring economy rather than extracellular glutamate escape routes. As a consequence, the majority of closely spaced synapses likely belong to a shared, continuous postsynaptic fiber branch rather than separate branches.
Afferent nerves postsynaptic to vestibular hair cells in amniotes show three morphologies: calyx-type connections that fully encapsulate the base of the hair cell, small bouton-type contacts at single ribbon synapses, or a combination of the two (Eatock and Songer, 2011). Auditory hair cells in the mammalian cochlea have bouton afferent contacts (Liberman, 1980), whereas afferent contacts in the avian (Takasaka and Smith, 1971; Fischer, 1992) and amphibian (Simmons et al., 1992) basilar papilla have predominantly branched, claw-like fiber endings (much like the amphibian papilla; Fig. 1A). Assuming random synapse spacing (Fig. 1C) and an economical branching pattern (minimum spanning tree; Fig. 1D), we created simulations to compare glutamate diffusion in the synaptic clefts (400-nm-diameter circular regions) when different fiber morphologies are present (Fig. 1E). In each simulation, the synapse spacing was identical; the only difference was the postsynaptic morphology. The average time course of glutamate waveforms at a releasing synapse was similar between bouton-type and fiber-type morphologies (Fig. 1F), but the average spillover of glutamate from neighboring synapses in the fiber simulations showed a prominent peak <1 ms after release (Fig. 1G). Interestingly, for both the bouton and fiber simulations, neighboring synapses more than ∼3–4 μm away from a releasing synapse experienced less than ∼1 μm of glutamate spillover (Fig. 1H). However, at intersynaptic distances <2 μm (synapses had an average of 1.7 ± 1.2 neighboring synapses within 2 μm, n = 275 synapses from 4 hair cells), spillover for fiber-type morphologies was approximately double that of bouton-type morphologies. These simulations suggest that connections using claw-like fiber endings may require other mechanisms to minimize transmitter spillover between neighboring synapses.
Glutamate transporters do not shape fast transmission at papillar synapses
Auditory ribbon synapses often release multiple vesicles at individual synapses in response to small, graded changes in the membrane potential of the presynaptic hair cells (Matthews and Fuchs, 2010). These multivesicular events activate fast AMPA receptors on the postsynaptic auditory nerve (Glowatzki and Fuchs, 2002; Keen and Hudspeth, 2006; Grant et al., 2010; Schnee et al., 2013). Although AMPARs have sufficiently rapid kinetics (EPSC decay time constant ∼1 ms) (Li et al., 2009) to mediate high-frequency signaling in the amphibian papilla (∼200–1000 Hz), they are also highly prone to desensitization (Sommer et al., 1990). In the mammalian cochlea, glutamate transporters, expressed on supporting cells (which surround hair cells), play an important role in protecting the auditory fibers from excess extracellular glutamate (Glowatzki et al., 2006; Chen et al., 2010).
To determine whether glutamate uptake contributes to fast, repetitive synaptic transmission in the amphibian papilla, we made paired whole-cell recordings from hair cells and their postsynaptic nerve fibers (Figs. 2 and 3) in the region that encodes auditory frequencies ∼400 Hz (Lewis et al., 1982; Keen and Hudspeth, 2006; Li et al., 2009) (see Materials and Methods). The presynaptic recording electrode was used to hold the hair cell's membrane potential at −90 mV before delivering a depolarizing voltage step to −30 mV for 20 ms to elicit transient synaptic glutamate release from the hair cell. Using this protocol, EPSCs were recorded with the postsynaptic recording electrode both before and after bath application of 200 μm TBOA, a glutamate transporter antagonist (Shimamoto et al., 1998) that blocks transporter currents in the mammalian cochlea (Glowatzki et al., 2006) and vestibular hair cells (Dalet et al., 2012). Blocking transporters with TBOA had no effect on the presynaptic Ca2+ currents or total vesicular release (as indicated by lack of difference in the change in presynaptic membrane capacitance elicited by the protocol in control vs TBOA; Fig. 2A). Bath application of TBOA also had no significant effect on the total charge of the EPSC or the EPSC decay time constant (τ) following the return of the presynaptic hair cell to −90 mV (n = 11–17; Fig. 2A,E,F). Furthermore, postsynaptic responses to a prolonged 3 s depolarizing step of the presynaptic membrane, sufficient to release an amount of vesicles equal to the entire pool of vesicles associated with each of the hair cell's ∼50 ribbons (Graydon et al., 2011), were also unaffected by TBOA (n = 9–12; Fig. 2B,E,F).
The presynaptic recording electrode was also used to drive synapses at physiologically relevant frequencies for brief durations. A 20 ms train of brief (1 ms) presynaptic depolarizing steps at 400 Hz (8 steps total, Fig. 2C) reliably elicited EPSCs in the postsynaptic fibers during each step (5 ± 4% failure rate; n = 9), but these responses (both total EPSC charge and EPSC decay following the last stimulus of the train) were also insensitive to glutamate uptake blockade (n = 10–13; Fig. 2E,F). Extending the duration of the 400 Hz stimulus train fivefold to 100 ms produced reliable EPSCs throughout the protocol, but inhibiting active transport with TBOA again produced no significant differences in charge or decay times of the events (n = 6–9; Fig. 2E,F). The fivefold extension of the 400 Hz train produced a fivefold increase in the total EPSC charge (from 6 pC to 30 pC; Fig. 2D,E), indicating a linear increase in release with increasing durations of the 400 Hz train (Keen and Hudspeth, 2006; Johnson et al., 2008). Together, these results indicate that brief periods of fast, repetitive synaptic transmission in the 400 Hz region of the amphibian papilla are not shaped by rapid interactions with glutamate transporters.
To test whether a putative role for glutamate transporters becomes uncovered when the desensitization of AMPA receptors is reduced, we compared EPSCs before and after the application of 100 μm CTZ alone or CTZ with 200 μm TBOA (Fig. 3). CTZ alone significantly increased the average EPSC charge transfer during a 20 ms pulse and slowed the rate of decay of the EPSCs (n = 13–16; Fig. 3A–C) without significantly altering the peak amplitudes of presynaptic Ca2+ currents (n = 8). The effects of CTZ on EPSCs are consistent with previous studies with hair cell synapses (Glowatzki and Fuchs, 2002; Keen and Hudspeth, 2006; Goutman and Glowatzki, 2007). This also confirms that our drug perfusion system is effective at reaching the synaptic cleft. When TBOA was applied with CTZ, the average charge transfer and decay time of the response to a 20 ms presynaptic step were significantly increased, similar to that observed with CTZ alone. When we stimulated the hair cells with a 3-s-long pulse, which evokes prolonged glutamate release, the initial peak part of EPSCs was more affected by CTZ than the sustained release part of EPSCs (Fig. 3Di,ii, gray boxes.) With a 100 ms train of depolarizing steps at 400 Hz, the decay rate of the EPSCs was significantly increased by CTZ or with CTZ plus TBOA (n = 8–11; Fig. 3E,G). The effects of CTZ plus TBOA were not different from those of CTZ alone with a 20 ms presynaptic step or a 100 ms presynaptic train. The absence of additional TBOA effects in the presence of CTZ suggests again that glutamate transporters do not contribute to rapid glutamate clearance at this synapse.
Changes in synaptic geometry that allow for a more rapid diffusion of synaptically released glutamate from the cleft can give rise to a relative speeding of AMPA receptor-mediated EPSC decay at some CNS synapses (Cathala et al., 2005; Renden et al., 2005). The relatively fast EPSC decay time constants (τ) that we observed here (following both a short 20 ms step and a long 3 s step, τ ∼ 1.2–1.5 ms) suggest that synaptically released glutamate is not entrapped within the synaptic cleft but instead diffuses rapidly out of the cleft at hair cell synapses in the amphibian papilla.
Enlarged extracellular spaces speed glutamate dilution and reduce spillover
If high-frequency multivesicular release events occur at closely spaced connections between hair cells and auditory fibers, then how, without the aid of glutamate transporters, do these synapses avoid excess rundown due to desensitization and/or a loss of synapse specificity (i.e., spillover)? Closer inspection of the closely spaced synapses often revealed an infolding of the postsynaptic fiber's membrane, creating a local enlargement in the extracellular space surrounding each synapse (examples shown in Fig. 4A,C). Although it is possible that these extracellular spaces are an inadvertent result of the chemical fixation process, several lines of evidence argue that these perisynaptic enlargements in extracellular space are not fixation artifacts. First, the fixative amounts and fixative vehicle buffer used (see Materials and Methods) were very similar to those used by others for preserving the ultrastructure of amphibian tissues in general (Kurth et al., 2010), and also ribbon synapses in frog saccular hair cells specifically (Roberts et al., 1990; Lenzi et al., 1999, 2002). Second, little delamination of myelin sheaths (a common fixation artifact) (Möbius et al., 2010) surrounding nerve fibers before entry into the sensory epithelium was observed, suggesting suitable ultrastructural preservation. Third, serial section and electron tomographic reconstructions of extracellular spaces revealed what appeared to be structural proteins spanning these extracellular loops in the fiber's membrane (Fig. 4Aii,iii).
To determine the impact of these postsynaptic specializations on local glutamate concentrations, an example cluster of 5 (closely spaced; average nearest neighbor distance: 0.64 μm) synaptic contacts (each with its own ribbon and separate postsynaptic density) was chosen from the serial EM reconstructions (Fig. 4B–D) and incorporated into a diffusion simulation environment, MCell (Stiles et al., 1996; Stiles and Bartol, 2001; see Materials and Methods). The reconstructed fiber exhibited what appeared to be small (∼0.5 μm) spine-like protrusions extending from an otherwise cylindrical shaft (Fig. 4D); in between these protrusions was a porous grotto-like network of extracellular space (Fig. 4C,D). To assess the impact of the native, porous morphology, we compared it with a modified postsynaptic fiber reconstruction in which the presynaptic and postsynaptic membranes were separated by a constant 20 nm (i.e., synaptic cleft width) (Savtchenko and Rusakov, 2007) within the entire region of contact (Fig. 4E). Using a volume exclusion method in a closed equilibrated environment (see Materials and Methods), we measured local ECVF as a function of radial distance from the center of each of the five closely spaced synapses (Fig. 4F). For the native/porous reconstruction, the average cumulative ECVF exhibited a local maximum at a distance of ∼0.6 μm from the center of the synapses, whereas the ECVF in the modified/smooth reconstruction was relatively flat with increasing radial distance.
To determine how these enlarged perisynaptic extracellular spaces influence synaptic glutamate signaling within (locally) and between closely spaced synapses (spillover), we used transparent counting spheres (radius = 200 nm, centered on each synapse and identical for both reconstructions) to monitor the glutamate concentrations at all five synapses in response to the simulated release of only one vesicle (i.e., 3000 glutamate molecules, assuming 40 nm vesicles and 150 mm intravesicular glutamate concentration) (Takamori et al., 2006; n = 20 trials) from a single synapse (synapse #4) in the reconstructed cluster (Fig. 4G). The time course of glutamate clearance from the cleft of the active synapse was more than twice as long (τ = 0.037 ms) for simulations using the modified/smooth reconstruction than for simulations using the native/porous reconstruction (τ = 0.015 ms). Furthermore, the magnitude of glutamate spillover to the four neighboring synaptic clefts was nearly tripled (40 ± 19 μm for smooth vs 15 ± 7 μm for porous/native, p = 0.05) and the time to peak of the average spillover waveform was nearly doubled (0.13 ms for smooth vs 0.07 ms for porous/native; Fig. 4G, inset) in the smooth reconstruction. These simulations suggest that glutamate released from a single vesicle can spill over to closely spaced neighboring synapses but that the extent of this spillover is reduced substantially by the enlarged perisynaptic spaces. Repeating the simulations to account for multivesicular release (i.e., 3 vesicles [9000 glutamate molecules] released) yielded qualitatively similar results, but with proportionally larger glutamate concentrations at both the active and quiescent synapses (Fig. 4G). Together, our ECVF measurements and simulations of local glutamate diffusion suggest that clusters of closely spaced synapses can experience glutamate spillover concomitant with physiologically relevant vesicle release but that locally enlarged extracellular spaces (i.e., the native porous fiber morphology) promote faster transmitter clearance times from active synapses and decrease the extent of spillover to neighboring clefts.
Glutamate spillover desensitizes AMPA receptors at closely adjacent synapses
To determine whether these specialized postsynaptic structures influence the characteristics of signaling at clusters of closely spaced synapses, we first considered the biophysical interactions between glutamate and the postsynaptic ligand-gated receptors. For these particular simulations, we used a hidden Markov AMPAR model derived from excised patch data from auditory neurons in the avian nucleus magnocellularis (nMAG, Raman and Trussell, 1995) (Fig. 5A). This model, like other Markovian AMPAR models (e.g., Eliasof and Jahr, 1997 from retina, Häusser and Roth, 1997 from cerebellum; Fig. 5B), responds to large, brief glutamate waveforms (similar to synaptic release) with transient channel activation/opening and prolonged receptor desensitization (Fig. 5Aii,Bii). Low concentrations of glutamate (10's of μm, similar to spillover concentrations) are insufficient to produce channel opening but can drive a significant fraction of the receptors into desensitized states (i.e., low-dose desensitization) (Trussell and Fischbach, 1989; Fig. 5Aiii,Biii), an effect that is strongly dependent on the duration of transmitter application (Fig. 5Aiv,Biv; additional note: this also means that global ambient glutamate concentrations, which are likely regulated by uptake or breakdown, could also regulate overall receptor availability). Both models produce fast activation and deactivation kinetics, similar to those exhibited by postsynaptic AMPARs in papillar afferent fibers (Li et al., 2009). In light of these intrinsic receptor properties, we would predict that postsynaptic receptors at closely spaced synapses would be highly vulnerable to desensitization during physiological signaling and that glutamate released from any synaptic connection in a cluster would give rise to significant low-dose desensitization at neighboring synapses, thereby reducing receptor availability and sensitivity to subsequent local synaptic release.
To examine synaptic transmission and crosstalk in our reconstructed environment, we incorporated 400 AMPA receptors into the postsynaptic membrane directly apposed to each presynaptic ribbon (Fig. 6A,B); these “postsynaptic densities” were nearly identical (i.e., shape, total area etc) for both the native and modified afferent fiber geometries. At synapse 4, we tested the reliability of postsynaptic responses to univesicular or multivesicular release on multiple simulation trials (n = 20) using a different random seed for each Monte Carlo simulation (Fig. 6C). In our simulations, postsynaptic responses (at synapse 4) to multivesicular release events had a CV (SD/mean) of 0.12, making them ∼4 times more reliable than univesicular transmission (CV = 0.47). We next examined high-frequency signaling at only a single synapse in the cluster (Fig. 6D–F) by monitoring AMPA receptor activity at each of the five synapses while releasing one or three vesicles worth of glutamate every 2.5 ms (i.e., 400 Hz) from synapse 4 (20 ms total duration; Fig. 6D, top). Local responses (i.e., activation at synapse 4) to synaptic release at 400 Hz gradually depressed as a function of time (Fig. 6D, bottom), an effect that was exacerbated by high quantal content (i.e., multivesicular release) and was attributable to accumulated desensitization of local receptors (Fig. 6E). Furthermore, and consistent with predictions from glutamate spillover simulations (Fig. 4G) and AMPA receptor modeling (Fig. 5), substantial fractions of receptors at neighboring, quiescent synapses also entered desensitized states (univesicular: 43% desensitization at t = 20 ms; multivesicular: 66% desensitization at t = 20 ms; Fig. 6F). Reducing the local extracellular volume fraction with the smooth postsynaptic modification decreased prolonged sensitivity to 400 Hz glutamate release and increased desensitization both locally and at quiescent neighboring synapses (Fig. 6E,F). However, despite the improvements in clearance and spillover resulting from the enlarged extracellular spaces, spatiotemporally dense vesicle release (i.e., 400 Hz multivesicular release at a single synapse) nonetheless significantly desensitizes local postsynaptic receptors.
These results argue that high-frequency release at a single synapse (or synaptic ribbon) will produce local desensitization and, in some cases, can even give rise to significant desensitization at neighboring synapses. Enlargements in extracellular space help to minimize the rundown effects of desensitization by speeding clearance and suppressing synaptic crosstalk via dilution, but what happens to excess extracellular glutamate after leaving the cleft? In the inner ear of mammals, signaling at one-to-one synaptic connections between hair cells and afferent fibers is shaped by glutamate transporters expressed on support cells that surround each synapse (Glowatzki et al., 2006). While the results in Figures 2 and 3 argue against the notion that active transport shapes brief periods of fast synaptic transmission in the amphibian papilla, rapid interactions with active uptake mechanisms could be compromised in the amphibian papilla preparation used for physiological experiments (see Materials and Methods). We next examined the support cells in our reconstructions (a more intact preparation) and explored their putative contributions to signaling in our simulations of high-frequency synaptic transmission (Fig. 7). The reconstructed synaptic cluster in Figure 4 is centrally located within a larger reconstructed volume (∼4 × 9 × 4 μm) that included 5 other ribbon synapses, 3 other afferent fibers, and processes from 1 support cell (Fig. 7B). Similar to this example, analysis of 37 synapses revealed that support cell membranes were not immediately adjacent to each individual synapse; instead, support cell membranes were often a micron or more from a given synapse (Fig. 7C). Can these distant support cells shape fast synaptic transmission? We next ran our simulations under conditions of maximal release (i.e., 9000 glutamate molecules released from each synapse at a rate of 400 Hz; Fig. 7Di). In these simulations and all others involving this particular synaptic cluster, a large absorptive bounding box was implemented to speed simulation time. This manipulation sped simulations by removing glutamate molecules that had traveled far from the synaptic environment. Making this box reflective had no appreciable effects on synaptic signaling in the cluster of synapses under these conditions (Fig. 7Dii–iv). Similarly, making the support cell membranes 100% absorptive to glutamate (i.e., ideal sink) made minimal contributions to synaptic transmission on the time scale of our simulations (Fig. 7Dii–iv). These simulations argue that enlargements in perisynaptic space are effective at shaping fast synaptic transmission while active uptake by support cells plays more of a secondary role, slowly removing excess extracellular glutamate from the synaptic environment.
Lower Pr reduces desensitization and prolongs synaptic sensitivity
The quantized release of neurotransmitter is well described as a statistical process (del Castillo and Katz, 1954) whereby the probability of release depends on factors such as presynaptic calcium entry. In hair cells, small fluctuations in presynaptic membrane potential in response to weak stimuli could trigger sparse Cav channel activation at individual synapses, resulting in a low release rate at individual connections. Conversely, strong stimuli can trigger robust initial activity but can also lead to local presynaptic (Cho et al., 2011) and postsynaptic (Fig. 6D) depression. Regardless, a low release rate at individual synapses will reduce the spatial and temporal density of glutamate release at a cluster of closely spaced synapses. Because AMPARs recover relatively slowly from desensitization (Raman and Trussell, 1995: 16 ms; Eliasof and Jahr, 1997: 8.7 ms; Häusser and Roth, 1997: 35 ms), reduced release rates allow individual synapses more time to recover from local release and improve temporal isolation among closely spaced neighbors. This stimulus-dependent mechanism, in combination with multiple synaptic connections between cells (such as between hair cells and auditory fibers in the amphibian papilla, Fig. 1B), is particularly useful for maximizing the dynamic range and reliability of signal transmission while reducing the functional demands on individual connections. To examine neurotransmission at the simulated synaptic cluster over a range of potentially physiologically relevant conditions, we modified our simulations so that each of the five synapses in the cluster would exhibit the same mean release rate (RRsyn = 400, 200, or 100 Hz) but now with independent probabilistic release, making release events spatially and temporally random within the cluster (i.e., probabilistic release on a cycle-by-cycle basis; Fig. 8A–C). As expected, 400 Hz release from all 5 synapses on every cycle of the stimulus train produced a robust initial postsynaptic response that ran down in amplitude on subsequent cycles in the stimulus train. The porous spaces surrounding individual synapses promoted faster clearance and greater sensitivity to late events, especially for simulations using a lower quantal content (Fig. 8D). Lowering synaptic release rates reduced the cumulative postsynaptic desensitization (data not shown) and improved response sensitivity to prolonged high-frequency synaptic transmission.
Although lower release rates resulted in less receptor desensitization at closely spaced synapses and increased sensitivity late in the stimulus train (Fig. 8D), with only a finite number of synaptic connections between each pair of cells, low release rates also introduced transmission failures (Fig. 8C). By distributing signals across a relatively large number of synaptic connections between a hair cell and a postsynaptic fiber (Fig. 1B), a low probability of a transmission failure (e.g., <5%, the rate seen in our recordings; Fig. 2) can be achieved with a relatively low release probability at individual synapses (Fig. 8E). With an average of 12.2 ± 15.3 (mean ± SD, n = 27 fibers contacting 5 hair cells) synaptic connections between a hair cell and a given fiber, the release probability must be >0.1 to stay below a 5% failure rate. In tradeoff, our experimentally constrained simulations suggest that closely spaced connections, in particular, must use Pr values <0.2 for multivesicular release and <0.6 for univesicular release to maintain response sensitivity (>50% of the initial) during short durations (20 ms) of 400 Hz transmission.
To quantify the reliability of signaling, we examined how the CV of the total response depends on the number of contacts, release probability, and (local) variability at individual synapses (i.e., Fig. 6). We specifically compared signal reliability in the mammalian scenario (i.e., 1 synapse per afferent; Fig. 9A) with that observed in the amphibian papilla (i.e., average number of connections in Fig. 9B, and primary afferent connections in Fig. 9C) in the absence of presynaptic depression (i.e., fixed ‘n’). Sparse connectivity gives rise to highly variable postsynaptic signals where local response variability (i.e., even in the presence of a Pr of 1) contributes significantly to variability in the total response. Having more connections dramatically increases reliability, even for low Pr, and under these conditions local synaptic variability (at individual ribbons) contributes minimally to reliability of the combined postsynaptic response.
Discussion
Our experimental and computational results reveal several synaptic specializations that improve signal transfer on short time scales at the first stage of neurotransmission in the auditory pathway. While postsynaptic morphology and extracellular space are known to strongly influence the spatiotemporal profiles of synaptic signaling at all synapses (Taschenberger et al., 2002; Cathala et al., 2005; Freche et al., 2011), active uptake, a strategy used at many other CNS synapses, appears to play more of a secondary role at the high performance auditory synapses studied here. We did, however, observe a potentially novel strategy for speeding glutamate clearance and minimizing spillover at synaptic clusters: infoldings in the postsynaptic membrane that give rise to local maxima in extracellular space surrounding individual closely spaced synapses (Fig. 4). In simulations, the reduction in glutamate spillover at porous clusters of synapses (Fig. 4) was similar in magnitude to the differences in glutamate spillover observed between fiber and bouton wiring strategies (Fig. 1), suggesting that a fiber wiring strategy that includes enlarged extracellular spaces surrounding closely spaced synapses could have diffusion characteristics comparable with individual boutons. Because the process of diffusion (Q10 ∼ 1.3) has a much weaker temperature dependence compared with the kinetics of ion channels or transporters (Q10 ∼ 3–4), this strategy might provide more consistent clearance of transmitter in cold-blooded species, across a wider range of environmental conditions.
The perisynaptic enlargements of extracellular space we describe here have not been reported in extensive electron microscopy of lateral line hair cell ribbon synapses of zebrafish (Trapani et al., 2009; Sheets et al., 2011). We note, however, that those hair cells are probably tuned to operate at much lower mechanical vibration frequencies of 2–40 Hz compared with the 400–500 Hz tuning of bullfrog auditory hair cells examined here (Lewis et al., 1982; Graydon et al., 2011). At lower stimulation frequencies, AMPA receptor desensitization may be less of an issue because there is ample time on a cycle-by-cycle basis for AMPA receptors to recover from desensitized states. The specialized postsynaptic grottoes of extracellular space we report here may thus be more prevalent at hair cells tuned to operate at higher frequencies of 100's of Hz.
Little is known about the molecules and pathways governing the final steps of hair cell innervation by afferent fibers (Pauley et al., 2005), how they might differ between calyx, bouton, and branched fiber morphologies, or how a fiber might create pockets of locally enlarged extracellular space. At calyces, recent studies indicate that cell adhesion molecules might help to create molecularly distinct domains (Lysakowski et al., 2011) and are essential for a uniform synaptic cleft, for example, without the contactin-associated protein Caspr (Sousa et al., 2009), large and irregular gaps of extracellular space appear between the hair cell and afferent fiber. Identifying the molecular mechanisms underlying the branching and morphological specialization of the postsynaptic afferent fiber membranes remains an important avenue of future investigation.
Optimized signaling requires balanced parameters across multiple synapses
The results from our AMPA receptor modeling and diffusion simulations highlight a number of tradeoffs in several features of synaptic connectivity and signaling. Consistent with previous studies, we found that desensitization (both local and via glutamate spillover) is a pronounced side effect of high-frequency release and significantly reduces postsynaptic receptor sensitivity to continued release (Figs. 6–8). Interestingly, lowering the probability of release at individual synaptic connections can largely restore sensitivity, but very low release probabilities increase the chances of failed transmission, an outcome that can be avoided by distributing signals across a relatively large number of synaptic connections between a hair cell and a postsynaptic fiber (Figs. 1B and 8E). Similar mechanisms may occur at the multiribbon cone photoreceptor synapses (Pang et al., 2008). If release at these synapses is predominately multivesicular in nature, then the gains in reliability of the postsynaptic response arising from multivesicular release (Fig. 6C) may, in part, offset the inefficiency given a low probability that a given synapse will release anything on a given cycle.
In our simulations, the probability of a release event at each synapse in the cluster was uniform on a cycle-by-cycle basis. Although this was useful for modeling a broad range of presynaptic possibilities, release probabilities in vivo are dynamic and probably heterogeneous. For example, facilitation and depression have been demonstrated at this synapse on rapid time scales (tens of milliseconds), depending on presynaptic resting membrane potential or free calcium concentrations (Cho et al., 2011; Goutman and Glowatzki, 2011). Also, heterogeneous calcium signals have been directly observed at different ribbons within the same inner hair cell in mammals (Frank et al., 2009). Understanding how heterogeneous and time-dependent vesicle release processes (presynaptic issues) intersect with postsynaptic spacing and connectivity patterns remains an imposing challenge.
How do auditory wiring strategies in the amphibian papilla compare with those in the mammalian inner ear? Each mammalian auditory fiber contacts only one of the hair cell's ∼10–30 ribbon synapses (Liberman, 1980; Meyer et al., 2009). These fibers, each carrying a sparse encoding of the hair cell's information, project to the anteroventral cochlear nucleus of the brainstem, converging on postsynaptic principal cells, each of which receives ∼2–70 inputs (Spirou et al., 2005; Cao and Oertel, 2010). Depending on location in the amphibian papilla, a single fiber may receive as many as 100 or more ribbon synapses from ∼1–5 similarly tuned hair cells (Simmons et al., 1992). This seems to demonstrate two differing strategies of auditory signal flow and processing: convergence of multiple ribbon-type synaptic inputs from hair cells onto single auditory fibers in amphibians versus convergence of multiple auditory fibers onto downstream principal cells in the anteroventral cochlear nucleus in mammals. The amphibian strategy ensures that each auditory fiber carries a highly reliable auditory signal. The mammalian strategy, in contrast, uses a parallel distribution of information across distinct auditory fibers in mammals, which individually may not be highly reliable but converge onto downstream cellular targets whose output has enhanced precision and reliability (Fig. 9).
Afferent fibers with multiple ribbon synapses: onset latency encoding
Multivesicular release activates fast AMPA receptors on the postsynaptic auditory nerve that produce large EPSC events (Glowatzki and Fuchs, 2002; Li et al., 2009; Grant et al., 2010; Schnee et al., 2013). These large EPSCs are well suited to trigger action potentials with short first-spike latencies and little jitter in timing at the onset of a sound stimulus (Rutherford et al., 2012). Indeed, bassoon KO-mice that lack synaptic ribbons have greatly reduced exocytosis, longer first-spike latencies, and pronounced jitter in spike timing (Buran et al., 2010). The larger readily releasable pool afforded by multiple synaptic ribbons connected to one afferent fiber should therefore shorten the onset timing of spikes and enhance the precision of sound onset encoding (Wittig and Parsons, 2008). Several species (e.g., fish, amphibians, reptiles, turtles, and birds) display auditory afferent fibers that are connected to several synaptic ribbons (Martinez-Dunst et al., 1997), whereas mammals appear to be a notable exception. Perhaps the large metabolic cost of hair cells, which may restrict their numbers (e.g., to a total of only 3500 in humans), together with a necessity to encode a large sound frequency range (e.g., from 20 Hz to 20 kHz in humans and up to 120 kHz in bats), produced an evolutionary pressure in mammals to have each synaptic ribbon of a hair cell connect to a separate afferent fiber. In this manner, the information transmitted by a single hair cell diverges into several parallel, independent channels that can operate at different times and at different sound pressure intensities.
Amphibian papilla fibers: optimal wiring, local integration
Although integration/convergence of the hair cell's output might occur at different locations (auditory fiber vs brainstem), both amphibians and mammals may use extracellular space around the local synaptic environment to maintain the fidelity of transmission. In mammals, the thin afferent fibers make focal, one-to-one bouton-like contacts with single inner hair cell ribbon synapses; as a result, the postsynaptic structure likely does little to hinder glutamate diffusion. Indeed, synaptic currents have a fast rise time of <0.5 ms (Grant et al., 2010) and rarely exhibit a slower, smooth rising EPSC indicative of glutamate spillover (Nielsen et al., 2004). In the amphibian papilla, however, the integration of signals from multiple closely spaced contacts between a hair cell and a claw-like afferent fiber could be important for maximizing reliability and dynamic range but presents additional challenges with regards to glutamate diffusion and postsynaptic sensitivity, especially during sustained signaling. For example, in the somatosensory cortex, multiple clusters of closely spaced synaptic inputs to interneurons seem to constitute an effective wiring strategy for achieving powerful and reliable transmission (Bagnall et al., 2011). The wiring patterns of postsynaptic fibers in the amphibian papilla, shown here, suggest an emphasis on wiring economy, with the total fiber length being effectively minimized (Fig. 1). Our data suggest that the negative consequences of closely spaced connections can be minimized by balancing synaptic release probability, multiple contacts, and enlarged perisynaptic extracellular spaces, thus permitting efficient wiring strategies while mitigating glutamate spillover and receptor desensitization at synapses optimized for operation at high frequencies.
Notes
Supplemental material for this article is available at https://www.youtube.com/watch?v=bZTg7XIsCpw&feature=youtu.be. This movie provides an in-depth look at fast synaptic signaling at the first synapse in the auditory pathway of bullfrogs, as described in “Specialized postsynaptic morphology enhances neurotransmitter dilution and high-frequency signaling at an auditory synapse.” This material has not been peer reviewed.
Footnotes
This work was supported by the National Institute of Neurological Disorders and Stroke Intramural Research Program Grant NS003039 to J.S.D., the National Institute on Deafness and Other Communication Disorders Intramural Research Program to B.K., and National Institute on Deafness and Other Communication Disorders Extramural Grant DC04274 to H.v.G. We thank Drs. Geng-Lin Li, George Spirou, members of the Rieke laboratory for instructive discussions, and Dr. Leonardo Andrade for assistance with electron microscopy.
The authors declare no competing financial interests.
References
- Arnth-Jensen N, Jabaudon D, Scanziani M. Cooperation between independent hippocampal synapses is controlled by glutamate uptake. Nat Neurosci. 2002;5:325–331. doi: 10.1038/nn825. [DOI] [PubMed] [Google Scholar]
- Bagnall MW, Hull C, Bushong EA, Ellisman MH, Scanziani M. Multiple clusters of release sites formed by individual thalamic afferents onto cortical interneurons ensure reliable transmission. Neuron. 2011;71:180–194. doi: 10.1016/j.neuron.2011.05.032. [DOI] [PMC free article] [PubMed] [Google Scholar]
- Barbour B. An evaluation of synapse independence. J Neurosci. 2001;20:7969–7984. doi: 10.1523/JNEUROSCI.21-20-07969.2001. [DOI] [PMC free article] [PubMed] [Google Scholar]
- Buran BN, Strenzke N, Neef A, Gundelfinger ED, Moser T, Liberman MC. Onset coding is degraded in auditory nerve fibers from mutant mice lacking synaptic ribbons. J Neurosci. 2010;30:7587–7597. doi: 10.1523/JNEUROSCI.0389-10.2010. [DOI] [PMC free article] [PubMed] [Google Scholar]
- Cao XJ, Oertel D. Auditory nerve fibers excite targets through synapses that vary in convergence, strength, and short-term plasticity. J Neurophysiol. 2010;104:2308–2320. doi: 10.1152/jn.00451.2010. [DOI] [PMC free article] [PubMed] [Google Scholar]
- Cathala L, Holderith NB, Nusser Z, DiGregorio DA, Cull-Candy SG. Changes in synaptic structure underlie the developmental speeding of AMPA receptor-mediated EPSCs. Nat Neurosci. 2005;8:1310–1318. doi: 10.1038/nn1534. [DOI] [PubMed] [Google Scholar]
- Chen Z, Kujawa SG, Sewell WF. Functional roles of high-affinity glutamate transporters in cochlear afferent synaptic transmission in the mouse. J Neurophysiol. 2010;103:2581–2586. doi: 10.1152/jn.00018.2010. [DOI] [PMC free article] [PubMed] [Google Scholar]
- Cho S, Li GL, von Gersdorff H. Recovery from short-term depression and facilitation is ultrafast and Ca2+ dependent at auditory hair cell synapses. J Neurosci. 2011;31:5682–5692. doi: 10.1523/JNEUROSCI.5453-10.2011. [DOI] [PMC free article] [PubMed] [Google Scholar]
- Dalet A, Bonsacquet J, Gaboyard-Niay S, Calin-Jageman I, Chidavaenzi RL, Venteo S, Desmadryl G, Goldberg JM, Lysakowski A, Chabbert C. Glutamate transporters EAAT4 and EAAT5 are expressed in vestibular hair cells and calyx endings. PLoS One. 2012;7:e46261. doi: 10.1371/journal.pone.0046261. [DOI] [PMC free article] [PubMed] [Google Scholar]
- del Castillo J, Katz B. Quantal components of the end-plate potential. J Physiol. 1954;124:560–573. doi: 10.1113/jphysiol.1954.sp005129. [DOI] [PMC free article] [PubMed] [Google Scholar]
- Dijkstra EW. A note on two problems in connexion with graphs. Numerische Mathematik. 1959;1:269–271. doi: 10.1007/BF01386390. [DOI] [Google Scholar]
- Eatock RA, Songer JE. Vestibular hair cells and afferents: two channels for head motion signals. Annu Rev Neurosci. 2011;34:501–534. doi: 10.1146/annurev-neuro-061010-113710. [DOI] [PubMed] [Google Scholar]
- Eliasof S, Jahr CE. Rapid AMPA receptor desensitization in catfish cone horizontal cells. Vis Neurosci. 1997;14:13–18. doi: 10.1017/S0952523800008713. [DOI] [PubMed] [Google Scholar]
- Fiala JC. Reconstruct: a free editor for serial section microscopy. J Microsc. 2005;218:52–61. doi: 10.1111/j.1365-2818.2005.01466.x. [DOI] [PubMed] [Google Scholar]
- Fischer FP. Quantitative analysis of the innervation of the chicken basilar papilla. Hear Res. 1992;61:167–178. doi: 10.1016/0378-5955(92)90048-R. [DOI] [PubMed] [Google Scholar]
- Frank T, Khimich D, Neef A, Moser T. Mechanisms contributing to synaptic Ca2+ signals and their heterogeneity in hair cells. Proc Natl Acad Sci U S A. 2009;106:4483–4488. doi: 10.1073/pnas.0813213106. [DOI] [PMC free article] [PubMed] [Google Scholar]
- Freche D, Pannasch U, Rouach N, Holcman D. Synapse geometry and receptor dynamics modulate synaptic strength. PLOS One. 2011;6:e25122. doi: 10.1371/journal.pone.0025122. [DOI] [PMC free article] [PubMed] [Google Scholar]
- Funabiki K, Ashida G, Konishi M. Computation of interaural time difference in the owl's coincidence detector neurons. J Neurosci. 2011;31:15245–15256. doi: 10.1523/JNEUROSCI.2127-11.2011. [DOI] [PMC free article] [PubMed] [Google Scholar]
- Glowatzki E, Fuchs PA. Transmitter release at the hair cell ribbon synapse. Nat Neurosci. 2002;5:147–154. doi: 10.1038/nn796. [DOI] [PubMed] [Google Scholar]
- Glowatzki E, Cheng N, Hiel H, Yi E, Tanaka K, Ellis-Davies GC, Rothstein JD, Bergles DE. The glutamate-aspartate transporter GLAST mediates glutamate uptake at inner hair cell afferent synapses in the mammalian cochlea. J Neurosci. 2006;26:7659–7664. doi: 10.1523/JNEUROSCI.1545-06.2006. [DOI] [PMC free article] [PubMed] [Google Scholar]
- Goutman JD, Glowatzki E. Time course and calcium dependence of transmitter release at a single ribbon synapse. Proc Natl Acad Sci U S A. 2007;104:16341–16346. doi: 10.1073/pnas.0705756104. [DOI] [PMC free article] [PubMed] [Google Scholar]
- Goutman JD, Glowatzki E. Short-term facilitation modulates size and timing of the synaptic response at the inner hair cell ribbon synapse. J Neurosci. 2011;31:7974–7981. doi: 10.1523/JNEUROSCI.0604-11.2011. [DOI] [PMC free article] [PubMed] [Google Scholar]
- Grant L, Yi E, Glowatzki E. Two modes of release shape the postsynaptic response at the inner hair cell ribbon synapse. J Neurosci. 2010;30:4210–4220. doi: 10.1523/JNEUROSCI.4439-09.2010. [DOI] [PMC free article] [PubMed] [Google Scholar]
- Graydon CW, Cho S, Li GL, Kachar B, von Gersdorff H. Sharp Ca2+ nanodomains beneath the ribbon promote highly synchronous multivesicular release at hair cell synapses. J Neurosci. 2011;31:16637–16650. doi: 10.1523/JNEUROSCI.1866-11.2011. [DOI] [PMC free article] [PubMed] [Google Scholar]
- Häusser M, Roth A. Dendritic and somatic glutamate receptor channels in rat cerebellar Purkinje cells. J Physiol. 1997;501:77–95. doi: 10.1111/j.1469-7793.1997.077bo.x. [DOI] [PMC free article] [PubMed] [Google Scholar]
- Johnson SL, Forge A, Knipper M, Münkner S, Marcotti W. Tonotopic variation in the calcium dependence of neurotransmitter release and vesicle pool replenishment at mammalian auditory ribbon synapses. J Neurosci. 2008;28:7670–7678. doi: 10.1523/JNEUROSCI.0785-08.2008. [DOI] [PMC free article] [PubMed] [Google Scholar]
- Keen EC, Hudspeth AJ. Transfer characteristics of the hair cell's afferent synapse. Proc Natl Acad Sci U S A. 2006;103:5537–5542. doi: 10.1073/pnas.0601103103. [DOI] [PMC free article] [PubMed] [Google Scholar]
- Kinney JP, Spacek J, Bartol TM, Bajaj CL, Harris KM, Sejnowski TJ. Extracellular sheets and tunnels modulate glutamate diffusion in hippocampal neuropil. J Comp Neurol. 2013;521:448–464. doi: 10.1002/cne.23181. [DOI] [PMC free article] [PubMed] [Google Scholar]
- Kruskal JB., Jr On the shortest spanning subtree of a graph and the travelling salesman problem. Proc Am Math Soc. 1956;7:48–50. doi: 10.1090/S0002-9939-1956-0078686-7. [DOI] [Google Scholar]
- Kurth T, Berger J, Wilsch-Bräuninger M, Kretschmar S, Cerny R, Schwarz H, Löfberg J, Piendl T, Epperlein HH. Electron microscopy of the amphibian model systems Xenopus laevis and Ambystoma mexicanum. In: Mueller-Reichert T, editor. Methods in cell biology: electron microscopy of model systems. Vol. 96. Burlington, MA: Academic; 2010. pp. 395–423. [DOI] [PubMed] [Google Scholar]
- Laughlin SB. Energy as a constraint on the coding and processing of sensory information. Curr Opin Neurobiol. 2001;11:475–480. doi: 10.1016/S0959-4388(00)00237-3. [DOI] [PubMed] [Google Scholar]
- Lenzi D, Runyeon JW, Crum J, Ellisman MH, Roberts WM. Synaptic vesicle populations in saccular hair cells reconstructed by electron tomography. J Neurosci. 1999;19:119–132. doi: 10.1523/JNEUROSCI.19-01-00119.1999. [DOI] [PMC free article] [PubMed] [Google Scholar]
- Lenzi D, Crum J, Ellisman MH, Roberts WM. Depolarization redistributes synaptic membrane and creates a gradient of vesicles on the synaptic body at a ribbon synapse. Neuron. 2002;36:649–659. doi: 10.1016/S0896-6273(02)01025-5. [DOI] [PubMed] [Google Scholar]
- Lewis ER, Leverenz EL, Koyama H. The tonotopic organization of the bullfrog amphibian papilla, an auditory organ lacking a basilar membrane. J Comp Physiol. 1982;145:437–445. doi: 10.1007/BF00612809. [DOI] [Google Scholar]
- Li GL, Keen E, Andor-Ardó D, Hudspeth AJ, von Gersdorff H. The unitary event underlying multiquantal EPSCs at a hair cell's ribbon synapse. J Neurosci. 2009;29:7558–7568. doi: 10.1523/JNEUROSCI.0514-09.2009. [DOI] [PMC free article] [PubMed] [Google Scholar]
- Liberman MC. Morphological differences among radial afferent fibers in the cat cochlea: an electron-microscopic study of serial sections. Hear Res. 1980;3:45–63. doi: 10.1016/0378-5955(80)90007-6. [DOI] [PubMed] [Google Scholar]
- Longsworth LG. Diffusion measurements, at 25°, of aqueous solutions of amino acids, peptides and sugars. J Am Chem Soc. 1953;75:5705–5709. doi: 10.1021/ja01118a065. [DOI] [Google Scholar]
- Lysakowski A, Gaboyard-Niay S, Calin-Jageman I, Chatlani S, Price SD, Eatock RA. Molecular microdomains in a sensory terminal, the vestibular calyx ending. J Neurosci. 2011;31:10101–10114. doi: 10.1523/JNEUROSCI.0521-11.2011. [DOI] [PMC free article] [PubMed] [Google Scholar]
- Martinez-Dunst C, Michaels RL, Fuchs PA. Release sites and calcium channels in hair cells of the chick's cochlea. J Neurosci. 1997;17:9133–9144. doi: 10.1523/JNEUROSCI.17-23-09133.1997. [DOI] [PMC free article] [PubMed] [Google Scholar]
- Matthews G, Fuchs P. The diverse roles of ribbon synapses in sensory neurotransmission. Nat Rev Neurosci. 2010;11:812–822. doi: 10.1038/nrn2924. [DOI] [PMC free article] [PubMed] [Google Scholar]
- Merchan-Perez A, Liberman MC. Ultrastructural differences among afferent synapses on cochlear hair cells: correlations with spontaneous discharge rate. J Comp Neurol. 1996;371:208–221. doi: 10.1002/(SICI)1096-9861(19960722)371:2<208::AID-CNE2>3.3.CO%3B2-P. [DOI] [PubMed] [Google Scholar]
- Meyer AC, Frank T, Khimich D, Hoch G, Riedel D, Chapochnikov NM, Yarin YM, Harke B, Hell SW, Egner A, Moser T. Tuning of synapse number, structure and function in the cochlea. Nat Neurosci. 2009;12:444–453. doi: 10.1038/nn.2293. [DOI] [PubMed] [Google Scholar]
- Möbius W, Cooper B, Kaufmann WA, Imig C, Ruhwedel T, Snaidero N, Saab AS, Varoqueaux F. Electron microscopy of the mouse central nervous system. In: Mueller-Reichert T, editor. Methods in cell biology: electron microscopy of model systems. Vol. 96. Burlington, MA: Academic; 2010. pp. 475–512. [DOI] [PubMed] [Google Scholar]
- Nielsen TA, DiGregorio DA, Silver RA. Modulation of glutamate mobility reveals the mechanism underlying slow-rising AMPAR EPSCs and the diffusion coefficient in the synaptic cleft. Neuron. 2004;42:757–771. doi: 10.1016/j.neuron.2004.04.003. [DOI] [PubMed] [Google Scholar]
- Nouvian R, Beutner D, Parsons TD, Moser T. Structure and function of the hair cell ribbon synapse. J Membr Biol. 2006;209:153–165. doi: 10.1007/s00232-005-0854-4. [DOI] [PMC free article] [PubMed] [Google Scholar]
- Pang JJ, Gao F, Barrow A, Jacoby RA, Wu SM. How do tonic glutamatergic synapses evade receptor desensitization? J Physiol. 2008;586:2889–2902. doi: 10.1113/jphysiol.2008.151050. [DOI] [PMC free article] [PubMed] [Google Scholar]
- Pauley S, Matei V, Beisel KW, Fritzsch B. Wiring the ear to the brain: the molecular basis of neurosensory development, differentiation, and survival. In: Kelley MW, Wu DK, Popper AN, Fay RR, editors. Development of the inner ear. New York: Springer; 2005. pp. 85–121. [Google Scholar]
- Raman IM, Trussell LO. The mechanism of α-amino-3-hydroxy-5-methyl-4-isoxazoleproprionate receptor desensitization after removal of glutamate. Biophys J. 1995;68:137–146. doi: 10.1016/S0006-3495(95)80168-2. [DOI] [PMC free article] [PubMed] [Google Scholar]
- Renden R, Taschenberger H, Puente N, Rusakov DA, Duvoisin R, Wang LY, Lehre KP, von Gersdorff H. Glutamate transporter studies reveal the pruning of metabotropic glutamate receptors and absence of AMPA receptor desensitization at mature calyx of Held synapses. J Neurosci. 2005;25:8482–8497. doi: 10.1523/JNEUROSCI.1848-05.2005. [DOI] [PMC free article] [PubMed] [Google Scholar]
- Roberts WM, Jacobs RA, Hudspeth AJ. Colocalization of ion channels involved in frequency selectivity and synaptic transmission at presynaptic active zones of hair cells. J Neurosci. 1990;10:3664–3684. doi: 10.1523/JNEUROSCI.10-11-03664.1990. [DOI] [PMC free article] [PubMed] [Google Scholar]
- Rusakov DA, Kullmann DM. Extrasynaptic glutamate diffusion in the hippocampus: ultrastructural constraints, uptake, and receptor activation. J Neurosci. 1998;18:3158–3170. doi: 10.1523/JNEUROSCI.18-09-03158.1998. [DOI] [PMC free article] [PubMed] [Google Scholar]
- Rutherford MA, Chapochnikov NM, Moser T. Spike encoding of neurotransmitter release timing by spiral ganglion neurons of the cochlea. J Neurosci. 2012;32:4773–4789. doi: 10.1523/JNEUROSCI.4511-11.2012. [DOI] [PMC free article] [PubMed] [Google Scholar]
- Saito K. Freeze-fracture organization of hair cell synapses in the sensory epithelium of guinea pig organ of Corti. J Electron Microsc Tech. 1990;15:173–186. doi: 10.1002/jemt.1060150209. [DOI] [PubMed] [Google Scholar]
- Savtchenko LP, Rusakov DA. The optimal height of the synaptic cleft. Proc Natl Acad Sci U S A. 2007;104:1823–1828. doi: 10.1073/pnas.0606636104. [DOI] [PMC free article] [PubMed] [Google Scholar]
- Schnee ME, Castellano-Muñoz M, Ricci AJ. Response properties from turtle auditory hair cell afferent fibers suggest spike generation is driven by synchronized release both between and within synapses. J Neurophysiol. 2013;110:204–220. doi: 10.1152/jn.00121.2013. [DOI] [PMC free article] [PubMed] [Google Scholar]
- Sheets L, Trapani JG, Mo W, Obholzer N, Nicolson T. Ribeye is required for presynaptic CaV1.3a channel localization and afferent innervation of sensory hair cells. Development. 2011;138:1309–1319. doi: 10.1242/dev.059451. [DOI] [PMC free article] [PubMed] [Google Scholar]
- Shimamoto K, Lebrun B, Yasuda-Kamatani Y, Sakaitani M, Shigeri Y, Yumoto N, Nakajima T. DL-threo-beta-benzyloxyaspartate, a potent blocker of excitatory amino acid transporters. Mol Pharmacol. 1998;53:195–201. doi: 10.1124/mol.53.2.195. [DOI] [PubMed] [Google Scholar]
- Simmons DD, Bertolotto C, Narins PM. Innervation of the amphibian and basilar papillae in the leopard frog: reconstructions of single labeled fibers. J Comp Neurol. 1992;322:191–200. doi: 10.1002/cne.903220205. [DOI] [PubMed] [Google Scholar]
- Sommer B, Keinänen K, Verdoorn TA, Wisden W, Burnashev N, Herb A, Köhler M, Takagi T, Sakmann B, Seeburg PH. Flip and flop: a cell-specific functional switch in glutamate-operated channels of the CNS. Science. 1990;249:1580–1585. doi: 10.1126/science.1699275. [DOI] [PubMed] [Google Scholar]
- Sousa AD, Andrade LR, Salles FT, Pillai AM, Buttermore ED, Bhat MA, Kachar B. The septate junction protein Caspr is required for structural support and retention of KCNQ4 at calyceal synapses of vestibular hair cells. J Neurosci. 2009;29:3103–3108. doi: 10.1523/JNEUROSCI.4868-08.2009. [DOI] [PMC free article] [PubMed] [Google Scholar]
- Spirou GA, Rager J, Manis PB. Convergence of auditory-nerve fiber projections onto globular bushy cells. Neuroscience. 2005;136:843–863. doi: 10.1016/j.neuroscience.2005.08.068. [DOI] [PubMed] [Google Scholar]
- Stiles JR, Bartol TM. Monte Carlo methods for simulating realistic synaptic microphysiology using MCell. In: De Schutter E, editor. Computational neuroscience: realistic modeling for experimentalists. Boca Raton, FL: CRC; 2001. pp. 87–127. [Google Scholar]
- Stiles JR, Van Helden D, Bartol TM, Jr, Salpeter EE, Salpeter MM. Miniature endplate current rise times <100 μs from improved dual recordings can be modeled with passive acetylcholine diffusion from a synaptic vesicle. Proc Natl Acad Sci U S A. 1996;93:5747–5752. doi: 10.1073/pnas.93.12.5747. [DOI] [PMC free article] [PubMed] [Google Scholar]
- Takamori S, Holt M, Stenius K, Lemke EA, Grønborg M, Riedel D, Urlaub H, Schenck S, Brügger B, Ringler P, Müller SA, Rammner B, Gräter F, Hub JS, De Groot BL, Mieskes G, Moriyama Y, Klingauf J, Grubmüller H, Heuser J, et al. Molecular anatomy of a trafficking organelle. Cell. 2006;127:831–846. doi: 10.1016/j.cell.2006.10.030. [DOI] [PubMed] [Google Scholar]
- Takasaka T, Smith CA. The structure and innervation of the pigeon's basilar papilla. J Ultrastruct Res. 1971;35:20–65. doi: 10.1016/S0022-5320(71)80141-7. [DOI] [PubMed] [Google Scholar]
- Taschenberger H, Leão RM, Rowland KC, Spirou GA, von Gersdorff H. Optimizing synaptic architecture and efficiency for high-frequency transmission. Neuron. 2002;36:1127–1143. doi: 10.1016/S0896-6273(02)01137-6. [DOI] [PubMed] [Google Scholar]
- Trapani JG, Obholzer N, Mo W, Brockerhoff SE, Nicolson T. Synaptojanin 1 is required for temporal fidelity of synaptic transmission in hair cells. PLoS Genet. 2009;5:e1000480. doi: 10.1371/journal.pgen.1000480. [DOI] [PMC free article] [PubMed] [Google Scholar]
- Trussell LO, Fischbach GD. Glutamate receptor desensitization and its role in synaptic transmission. Neuron. 1989;3:209–218. doi: 10.1016/0896-6273(89)90034-2. [DOI] [PubMed] [Google Scholar]
- Ventura R, Harris KM. Three-dimensional relationships between hippocampal synapses and astrocytes. J Neurosci. 1999;19:6897–6906. doi: 10.1523/JNEUROSCI.19-16-06897.1999. [DOI] [PMC free article] [PubMed] [Google Scholar]
- Wagner H, Brill S, Kempter R, Carr CE. Microsecond precision of phase delay in the auditory system of the barn owl. J Neurophysiol. 2005;94:1655–1658. doi: 10.1152/jn.01226.2004. [DOI] [PMC free article] [PubMed] [Google Scholar]
- Wässle H, Riemann HJ. The mosaic of nerve cells in the mammalian retina. Proc R Soc Lond B. 1978;200:441–461. doi: 10.1098/rspb.1978.0026. [DOI] [PubMed] [Google Scholar]
- Wilson DB. Generating random spanning trees more quickly than the cover time. Proceedings of the 28th Annual ACM Symposium on Theory of Computing; New York: ACM; 1996. pp. 296–303. [Google Scholar]
- Wittig JH, Jr, Parsons TD. Synaptic ribbon enables temporal precision of hair cell afferent synapse by increasing the number of readily releasable vesicles: a modeling study. J Neurophysiol. 2008;100:1724–1739. doi: 10.1152/jn.90322.2008. [DOI] [PMC free article] [PubMed] [Google Scholar]