

Abstract
Background: Human leukocyte telomere length (LTL) decreases with age and shorter LTL has previously been associated with increased prospective mortality. However, it is not clear whether LTL merely marks the health status of an individual by its association with parameters of immune function, for example, or whether telomere shortening also contributes causally to lifespan variation in humans.
Methods: We measured LTL in 870 nonagenarian siblings (mean age 93 years), 1580 of their offspring and 725 spouses thereof (mean age 59 years) from the Leiden Longevity Study (LLS).
Results: We found that shorter LTL is associated with increased prospective mortality in middle (30–80 years; hazard ratio (HR) = 0.75, P = 0.001) and highly advanced age (≥90 years; HR = 0.92, P = 0.028), and show that this association cannot be explained by the association of LTL with the immune-related markers insulin-like growth factor 1 to insulin-like growth factor binding protein 3 molar ratio, C-reactive protein, interleukin 6, cytomegalovirus serostatus or white blood cell counts. We found no difference in LTL between the middle-aged LLS offspring and their spouses (β = 0.006, P = 0.932). Neither did we observe an association of LTL-associated genetic variants with mortality in a prospective meta-analysis of multiple cohorts (n = 8165).
Conclusions: We confirm LTL to be a marker of prospective mortality in middle and highly advanced age and additionally show that this association could not be explained by the association of LTL with various immune-related markers. Furthermore, the approaches performed here do not further support the hypothesis that LTL variation contributes to the genetic propensity for longevity.
Keywords: Leukocyte telomere length, prospective mortality, immune-related markers, familial longevity, genetics, human
Key Messages.
Shorter leukocyte telomere length (LTL) is associated with increased prospective mortality in middle and highly advanced age independent of immune-related markers.
LTL is not associated with familial longevity in middle age in a large dataset from the Leiden Longevity Study.
Known LTL-associated genetic variants are not associated with mortality in a prospective meta-analysis of 8165 individuals.
Introduction
Telomeres are TTAGGG tandem repeat structures at the end of chromosomes which protect chromosomes from degradation and rearrangement.1 In somatic cells, telomere length declines with every cell division and, accordingly, human leukocyte telomere length (LTL) decreases with age.2,3 In addition, LTL differs between sexes; women have a longer LTL than men of the same age.4 Shorter LTL has been associated with an increased risk of several age-related diseases such as cardiovascular disease,5 hypertension6 and cancer.7 Likewise, several studies, although not all, have shown an association of shorter LTL with prospective mortality, mainly through infectious and cardiovascular-related causes of death.8
The shortening of telomeric DNA is mainly caused by incomplete DNA replication during the cell cycle S phase,9 but also by oxidative stress,10 which plays a role in the pathogenesis of viral infections.11 An association of shorter LTL with increased prospective mortality is thus not necessarily explained by a causal effect of LTL on health conditions. The association of LTL with prospective mortality risk might be confounded by immune functions influencing prospective mortality, which may be investigated by immune-related markers. Previous studies showed that shorter LTL is associated with a decrease in serum levels of insulin-like growth factor 1 (IGF-1),12,13 which is an important regulator of cell replication and, in addition, seems to play a role in the regulation of immunity and inflammation.14 Furthermore, shorter LTL has been shown to associate with increased levels of the inflammatory markers C-reactive protein (CRP) and interleukin 6 (IL-6), although not in all studied populations.8 During inflammation, IL-6 and other cytokines are secreted by T-cells and macrophages and trigger the synthesis of CRP by the liver, ultimately resulting in clearance of necrotic and apoptotic cells. However, an increased level of IL-6 or CRP is not necessarily the result of increased inflammation.15,16
Whether LTL is associated with familial longevity in middle age is not extensively studied. One study showed that offspring of Ashkenazi Jewish centenarians (n = 175) have a longer mean LTL as compared with controls from the general population (n = 93).17 Since the centenarians in this study (n = 86) and their offspring did not show a decline in LTL with age as observed in controls, the authors suggested that better LTL maintenance may be a feature in long-lived families. These interesting observations in a relatively small study warrant replication in larger populations.
LTL is a highly heritable trait.3,18 Insights into the causal effects of LTL on human lifespan might be obtained by testing genetic variants influencing LTL for their association with prospective mortality. Recently, nine loci have been identified that influence LTL variation in Western populations.19,20 These loci include the known telomere biology genes CTC1, NAF1, OBFC1, RTEL1, TERC and TERT, explaining ∼1% of the variance in LTL. In addition, genetic variation in two genes involved in telomere maintenance, TERC and POT1, was found to be associated with human longevity.17,21,22
In this study, we explored the data of the Leiden Longevity Study (LLS) in which we measured LTL in nonagenarian siblings (n = 870), their offspring (n = 1580) and the spouses thereof (n = 725; serving as controls). The survival benefit of LLS families is marked by a 30% decreased mortality risk in three generations, i.e. the parents of the nonagenarian siblings, their unselected additional siblings and their offspring, when compared with the general Dutch population.23 In addition, the LLS offspring, who are considered ‘decelerated’ or ‘healthy’ agers, have a lower prevalence of age-related diseases such as type 2 diabetes, cardiovascular disease and hypertension, as compared with their spouses, and show beneficial or ‘youthful’ profiles for many metabolic parameters24,25. We first investigated whether the association of shorter LTL with increased prospective mortality, which is observed in both generations, could be explained by lymphocyte counts, serum CRP levels, serum IGF-1 to insulin-like growth factor binding protein 3 (IGFBP3) molar ratio (IGF-1/IGFBP3), serum IL-6 levels or the presence of cytomegalovirus (CMV) infection as immune-related markers. Next, we examined whether the LLS offspring have a longer LTL and a different association of LTL with age as compared with their spouses. Finally, we determined the effect of genetic variants associated with LTL on prospective mortality. We performed a prospective meta-analysis of multiple cohorts (n = 8165) in which known LTL-associated single nucleotide polymorphisms (SNPs) were investigated separately and in combination as a genetic risk score (GRS).
Methods
Study populations
For the LLS, long-lived siblings of European descent were recruited together with their offspring and the spouses of the offspring. Families were included if at least two long-lived siblings were alive and fulfilled the age criterion of 89 years or older for males and 91 years or older for females, representing less than 0.5% of the Dutch population in 2001.23 In total, 944 long-lived proband siblings with a mean age of 94 years (range, 89–104), 1671 offspring (61 years, 39–81) and 744 spouses thereof (60 years, 36–79) were included. DNA from the LLS was extracted from samples at baseline using conventional methods26 and genotyping was performed with Illumina Human660W-Quad and OmniExpress BeadChips (Illumina, San Diego, CA, USA). Imputation was performed using IMPUTE2 with reference HapMap Phase I + II CEU release 22 (hg18/build36).
A description of the cohorts used for the prospective meta-analysis of LTL-associated genetic variants is provided in the Supplementary data (available at IJE online).
Measurement of leukocyte telomere length
Mean LTL was measured as a ratio (T/S) of telomere repeat length (T) to the copy number (S) of the single-copy gene 36B4, as previously described.20 The inter- and intra-run coefficients of variation (CVs) were 2.73% and 2.73% for the LLS nonagenarians and 3.74% and 2.85% for the LLS offspring and spouses, respectively. LTL was obtained in 3194 samples from the LLS, of which 19 were removed due to a deviation from the mean >3 SD, leaving 3175 samples for the analysis (Table 1A, B and C). If we consider an LTL attrition rate of 30 telomeric base pairs per year and a decline of 0.006 T/S units per year,20 a decrease of one T/S unit reflects a decrease of 5000 telomeric base pairs in our study. This LTL attrition rate is based on several studies that have used DNA blotting to measure LTL.20 A recent review indicated that the LTL attrition rate is most likely somewhere in the range of 20–30 base pairs/year,27 so the estimated telomeric base pairs representing one T/S ratio may vary between 3333 and 5000. In the analyses of LTL, one LTL unit represents 1 kb telomeric base pairs.
Table 1A.
Characteristics of the Leiden Longevity Study samples used for the linear regression and prospective analysis of LTL
|
Offspring |
Spouses |
Nonagenarians |
||||||||||
|---|---|---|---|---|---|---|---|---|---|---|---|---|
|
Men |
Women |
Men |
Women |
Men |
Women |
|||||||
| n | Mean (SD) | n | Mean (SD) | n | Mean (SD) | n | Mean (SD) | n | Mean (SD) | n | Mean (SD) | |
| Age (years) | 734 | 59.33 (6.51) | 846 | 59.47 (6.52) | 309 | 61.23 (7.40) | 416 | 57.02 (6.85) | 333 | 92.24 (2.72) | 537 | 93.98 (2.34) |
| LTL (T/S ratio)a | 734 | 1.43 (0.25) | 846 | 1.48 (0.26) | 309 | 1.42 (0.25) | 416 | 1.49 (0.28) | 333 | 1.25 (0.21) | 537 | 1.29 (0.22) |
| IGF-1/IGFBP3 (molar ratio) | 709 | 0.11 (0.02) | 814 | 0.10 (0.02) | 302 | 0.11 (0.02) | 400 | 0.10 (0.02) | 320 | 0.11 (0.02) | 506 | 0.09 (0.02) |
| hsCRP (mg/l) | 713 | 2.12 (2.94) | 813 | 2.51 (3.73) | 301 | 2.09 (2.83) | 403 | 2.61 (3.56) | 321 | 6.27 (10.39) | 512 | 5.66 (10.00) |
| IL-6 (pg/ml) | 667 | 0.60 (0.69) | 758 | 0.54 (0.63) | 280 | 0.57 (0.60) | 384 | 0.57 (0.69) | NA | NA | NA | NA |
| Lymphocyte count (%) | 695 | 27.74 (6.85) | 797 | 30.07 (7.01) | 301 | 28.39 (7.11) | 392 | 30.37 (6.52) | 317 | 21.11 (7.27) | 492 | 21.98 (7.70) |
| Neutrophil count (%) | 695 | 60.75 (7.74) | 797 | 59.87 (7.59) | 301 | 60.45 (8.14) | 392 | 59.44 (7.18) | 317 | 66.69 (8.31) | 492 | 66.96 (8.91) |
| Monocyte count (%) | 695 | 5.61 (1.34) | 797 | 5.06 (1.29) | 301 | 5.61 (1.32) | 392 | 5.04 (1.31) | 317 | 6.34 (1.79) | 492 | 5.82 (1.63) |
| Eosinophil count (%) | 695 | 2.77 (1.44) | 797 | 2.35 (1.24) | 301 | 2.77 (1.37) | 392 | 2.48 (1.33) | 317 | 3.12 (1.73) | 492 | 2.65 (1.49) |
| Basophil count (%) | 695 | 0.74 (0.35) | 797 | 0.69 (0.31) | 301 | 0.72 (0.35) | 392 | 0.71 (0.34) | 317 | 0.65 (0.36) | 492 | 0.69 (0.39) |
aA decrease in one T/S unit represents a decrease of 5000 telomeric base pairs.
Table 1B.
Characteristics of the Leiden Longevity Study samples used for the linear regression and prospective analysis of LTL
|
Offspring |
Spouses |
Nonagenarians |
||||||||||
|---|---|---|---|---|---|---|---|---|---|---|---|---|
|
Men |
Women |
Men |
Women |
Men |
Women |
|||||||
| n | Yes/no | n | Yes/no | n | Yes/no | n | Yes/no | n | Yes/no | n | Yes/no | |
| CMV infection | 713 | 276/437 | 815 | 414/401 | 301 | 155/146 | 407 | 212/195 | 326 | 178/148 | 514 | 322/192 |
Table 1C.
Characteristics of the Leiden Longevity Study samples used for the prospective analysis of LTL
| n | ndeaths | Mean age (SD)a | Age rangea | Men/women | Mean follow-up time (SD) | |
|---|---|---|---|---|---|---|
| LLS offspring + spouses | 2294 | 106 | 59.18 (6.78) | 30–80 | 1037/1257 | 7.56 (0.95) |
| LLS nonagenarians | 870 | 751 | 93.31 (2.63) | 89–103 | 333/537 | 7.57 (0.84) |
aAge in years.
Measurement of immune-related parameters
In the LLS, all standard serum measurements were performed using fully automated equipment. White blood cell (WBC) counts were measured using the Sysmex XE-2100 (TOA Medical Electronics, Kobe, Japan). IGF-1 and IGFBP3 were measured using the Immulite 2500 (DPC, Los Angeles, CA, USA)28 and high-sensitivity CRP (hsCRP) was measured using the Hitachi Modular P800 (Roche, Almere, The Netherlands).29 Since the hsCRP levels were not normally distributed, the log transformed values were used for analysis. IL-6 was measured with the PeliKine Compact human IL-6 ELISA kit (Sanquin Reagents, Amsterdam, The Netherlands).30 For calculation of the IGF-1/IGFBP3 molar ratio we used the following formula:
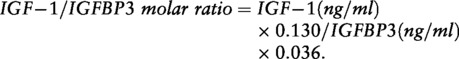 |
For all serum parameters, measurements with a deviation from the mean >3 SD were removed. CMV serostatus was determined on blinded samples using the CMV-IgG-ELISA PKS assay (Medac GmbH, Wedel, Germany).31 The characteristics of the measured parameters are depicted in Table 1A and B.
Statistical analysis
Prospective analysis
Prospective analysis of LTL and LTL-associated genetic variants was performed using a Cox proportional hazards model adjusted for age, gender, population stratification and study-specific covariates. The number of individuals and (cause-specific) deaths for every cohort, as well as the follow-up times, are depicted in Table 1C and Table S3 (available as Supplementary data at IJE online). To determine whether the association of LTL with mortality was independent of immune-related markers, we fitted a model with and without adjustment for immune-related markers and determined whether the association of LTL with mortality remained (P < 0.05).
Association of LTL with immune-related markers
To determine the association of LTL with serum parameters in the LLS, we performed linear regression, adjusted for age, gender and familial relationships, using the following model in STATA/SE 11.2 (StataCorp LP, College Station, TX, USA):
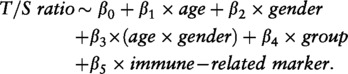 |
age was coded in years, gender was coded as 1 (male) or 2 (female) and group was coded as 0 (LLS spouse) or 1 (LLS offspring). Robust standard errors were used to account for sibship relations.
We assumed a linear association between LTL and the different immune-related markers since the augmented partial residual plots of the markers showed no visual deviation from linearity.
Association of LTL with familial longevity in middle age
To determine the association of LTL with familial longevity in middle age in the LLS offspring (n = 1580) and their spouses (n = 725), linear regression, adjusted for age, gender and familial relationships, was performed using the following model in STATA/SE 11.2 (StataCorp LP):
age was coded in years, gender was coded as 1 (male) or 2 (female) and group was coded as 0 (LLS spouse) or 1 (LLS offspring). Robust standard errors were used to account for sibship relations.
Genetic risk score
To determine the joint effect of LTL-associated genetic variants on all-cause, cardiovascular and cancer mortality, we created a GRS using a previously described approach.20,32 The unweighted GRS of a subject was defined as the combined number of risk alleles associated with shorter LTL in a previous genome-wide association study (GWAS).20 For the weighted GRS, the β for each SNP in this GWAS was added as weight and the total score was divided by the sum of all weights.
Results
LTL and prospective mortality in two generations
The characteristics of the LLS nonagenarians, their offspring and the spouses thereof for demographic variables, LTL, immune-related markers and mortality analyses are depicted in Table 1A, B and C. We first analysed the association between LTL and prospective mortality in the middle-aged and nonagenarian generations. We found that shorter LTL is associated with increased prospective all-cause mortality in the combined group of middle-aged LLS offspring and their spouses (30–80 years of age), i.e. per unit longer LTL there is a 25% decrease in mortality risk (hazard ratio (HR) = 0.75 (95% confidence interval (CI) 0.64–0.88), P = 0.001). In addition, we observed a similar association in the LLS nonagenarians (≥90 years of age; HR = 0.92 (95% CI 0.86–0.99), P = 0.028). Since it has previously been reported that LTL declines with decreasing serum IGF-1 levels and increasing serum CRP levels, the effect of LTL on prospective mortality might be explained by the association of LTL with immune functions, as reflected by immune-related markers such as serum IGF-1/IGFBP3, serum CRP levels, serum IL-6 levels, presence of CMV infection and WBC counts. We previously showed that long-lived family members from the LLS have a lower prevalence of CMV infection as compared with controls from the general population.31,33 The levels of the other markers did not differ between long-lived family members and controls.28,29 Most of these markers associated with LTL in the LLS (Supplementary Table S1, available as Supplementary data at IJE online). Therefore, we adjusted for IGF-1/IGFBP3, CRP, IL-6, CMV infection and lymphocyte counts in the Cox proportional hazard model used for prospective analysis of mortality. This showed that the association of LTL with all-cause mortality in both generations of the LLS was independent from these immune-related markers (HR = 0.68 (95% CI 0.56–0.82), P = 9.23 x 10⁻⁵ (offspring and spouses) and HR = 0.90 (95% CI 0.84–0.97), P = 0.006 (nonagenarians)), even though all markers showed an association (in one or both generations) with mortality (Supplementary Table S2, available as Supplementary data at IJE online). Since both a low and/or high level of WBC counts and CRP could be detrimental, we also performed the analyses without individuals with low (<4 x 10⁹, noffspring/spouses = 36, nnonagerarians = 16) and high (>10 x 109, noffspring/spouses = 96, nnonagerarians = 58) WBC counts and high CRP levels (>30 mg/l, noffspring/spouses = 2, nnonagerarians = 24). However, these analyses provided similar results (data not shown). In addition, there was no interaction between LTL and immune-related markers. This indicates that the effect of LTL on prospective mortality could not be explained by its association with these immune-related markers.
LTL and familial longevity in middle age
Next, we compared LTL between the LLS offspring (n = 1580) and their spouses (n = 725). We found no evidence for a difference in mean LTL between the groups considering age and gender as covariates in our linear regression model (β = 0.006 (95% CI -0.125–0.136), P = 0.932, Figure 1A). In addition, we found no evidence that the association of LTL with age is different among long-lived families, since the estimated decline of LTL (in T/S ratio units) per calendar year in the LLS offspring (β = -0.009) and their spouses (β = -0.006) was similar to other studies with participants of middle age20 (Figure 1B). This indicates that LTL does not explain the propensity for familial longevity in middle age.
Figure 1.

Characteristics of LTL in the LLS offspring and their spouses. Mean LTL (a), and the association between LTL and age in years (b), in the LLS offspring (n = 1580, green) and their spouses (n = 725, blue)
Prospective meta-analysis of LTL-associated genetic variants
To determine whether the genetic component of LTL contributes to prospective mortality, we investigated whether the lead SNPs from the seven loci that showed association with LTL variation (P < 5 x 10⁻⁸) in the largest GWAS up to now,20 as well as a GRS based on these SNPs, also associate with prospective mortality. To this end, we performed a prospective meta-analysis of mortality in 8165 individuals aged above 75 years from six different cohorts, of whom 3893 had died (Supplementary Table S3, available as Supplementary data at IJE online). This analysis showed no association of the LTL SNPs, nor of the GRS, with all-cause, cardiovascular or cancer mortality after Bonferroni correction to adjust for multiple testing (Padjusted > 0.0056, Table 2, and see Supplementary Tables S4 and 5 available as Supplementary data at IJE online), although we had an 80% power (α = 0.05) to detect HR below 0.91.
Table 2.
Association between LTL-associated genetic variants and all-cause mortality
| SNP/GRS | n | ndeaths | HR | SE | 95% CI | P | |
|---|---|---|---|---|---|---|---|
| rs11125529 | 8165 | 3893 | 1.01 | 0.04 | 0.94 | 1.08 | 0.863 |
| rs10936599 | 8165 | 3893 | 1.00 | 0.03 | 0.95 | 1.06 | 0.966 |
| rs7675998 | 8165 | 3893 | 0.99 | 0.03 | 0.94 | 1.05 | 0.728 |
| rs2736100 | 8165 | 3893 | 1.03 | 0.02 | 0.99 | 1.08 | 0.159 |
| rs9420907 | 8165 | 3893 | 1.01 | 0.03 | 0.94 | 1.08 | 0.823 |
| rs8105767 | 8165 | 3893 | 0.97 | 0.03 | 0.92 | 1.02 | 0.226 |
| rs755017 | 8165 | 3893 | 0.92 | 0.03 | 0.86 | 0.98 | 0.009 |
| Unweighted GRS | 8165 | 3893 | 1.00 | 0.01 | 0.98 | 1.02 | 0.985 |
| Weighted GRS | 8165 | 3893 | 0.97 | 0.02 | 0.93 | 1.01 | 0.133 |
Discussion
To examine the association between telomeres and human lifespan, we studied LTL in nonagenarians and their middle-aged offspring from the LLS for association with prospective mortality and familial longevity in middle age. Interestingly, carriers of long telomeres, as compared with those with shorter telomeres, have a clear survival benefit, which is independent of immune-related markers associated with LTL. We found no association of LTL with familial longevity in middle age. Neither did we observe an association of LTL-associated genetic variants with mortality in a prospective meta-analysis of multiple cohorts (n = 8165). This confirms the study of monozygotic twins, in which LTL predicts prospective mortality in the absence of genetic differences between the twins.34
The observed association of shorter LTL with increased prospective mortality in two generations of the LLS is in accordance with previous studies.8 However, it is unclear what biological phenomenon telomere length in blood reflects. Shorter LTL has previously been associated with decreased serum levels of IGF-112,13 and increased levels of CRP and IL-6,8 which are known markers of inflammation.35,36 Hence, the established association between LTL and prospective mortality might be explained by confounding factors such as immune functions. These factors could on the one hand associate with LTL, by affecting replication of specific cell populations, and on the other hand with prospective mortality, reflecting the health status of an individual. To test this hypothesis, we investigated several immune-related markers, namely serum IGF-1/IGFBP3, which is a marker for the amount of biologically active IGF-1, serum CRP levels, serum IL-6 levels, WBC counts and seropositivity for CMV infection. Whereas most of these markers were indeed associated with LTL and showed an individual effect on prospective mortality, shorter LTL remained independently associated with prospective mortality in two generations. We should note that we did not have data available regarding other relevant immune-related markers such as erythrocyte sedimentation rate and fibrinogen. The associations of LTL with prospective mortality could also be confounded by non-cell-autonomous senescence as a consequence of viral infection.37 Another explanation for the association between LTL and prospective mortality might be found in the association of LTL with metabolic parameters associated with cardiovascular disease risk and/or mortality, such as fasting insulin and homocysteine.8 Whether these markers explain LTL-related prospective mortality still needs to be determined.
Previous studies have shown that telomere length dynamics are age-related, i.e. the rate of LTL shortening during adulthood is much slower than during early life.38 However, the age range of our samples within the middle-aged and highly advanced aged groups is relatively small and all our individuals are in adulthood (above 30 years of age). Hence, our finding that shorter LTL is associated with increased mortality is less likely to be confounded by this phenomenon.
Our finding that LTL is not associated with familial longevity in middle age is in contradiction to the observations in long-lived Ashkenazi Jewish families.17 This discrepancy could be explained by natural variation, such as differences in the demography or age of the samples (mean age 68 and 72 years (among Ashkenazi offspring and controls, respectively) vs 59 years (LLS offspring and spouses) or by differences in the selection criteria which may have an effect on the genetic component of the longevity trait (offspring of centenarians (mean age 97 years) vs offspring of nonagenarian siblings (mean age 94 years)). Another possible explanation is the small sample size of the study of Atzmon and colleagues (noffspring = 175 and ncontrols = 93) in comparison with the current study (noffspring = 1580 and nspouses = 725), which may have led to a non-random selection of individuals from the population, resulting in a false-positive association.
The GRS composed of the seven genetic variants associated with LTL variation in the largest GWAS reported so far is associated with coronary artery disease risk,20 but does not associate with prospective mortality in our study of 8165 individuals of whom 3893 died during follow-up. Since the seven genetic variants only explain ∼1% of the variation in LTL,20 the sample size of the current study might be insufficient to detect their effect on prospective mortality. Hence, on the basis of our data we cannot exclude a causative role for genetic variants in LTL-related genes in prospective mortality.
Critical telomere length in tissues may be causally involved in lifespan regulation, and our results further highlight the role of telomere length in blood as marker for prospective mortality. The lack of association of LTL with familial longevity in middle age and of the LTL-associated genetic variants with prospective mortality provides thus far no support for LTL causally contributing to lifespan variation in humans. However, LTL does reflect environmental effects, as demonstrated by the observation that there is a correlation in LTL between spouses.18 Assortative mating may thus have obscured a difference between the LLS offspring and their spouses. However, the LLS offspring do have a more ‘youthful’ metabolic profile and a lower prevalence of age-related diseases compared with their spouses, whereas LTL is not different between the groups. This indicates that LTL seems to associate with mortality independent of the familial trait that influences the metabolic health in these families in middle age. LTL meets three of the four criteria we proposed for a biomarker of healthy ageing in a recent review,39 i.e. LTL associates with chronological age and with morbidity and mortality in prospective studies. However, LTL cannot be used to discriminate between individuals in middle age according to their genetic propensity for longevity. Other potential biomarkers of healthy ageing, such as fasting glucose and free triiodothyronine, did meet all criteria in studies of various human cohorts.
LTL could reflect the compartment of vital haematopoietic stem cells (HSCs) in individuals. Leukocytes consist of different subsets of cells, namely lymphocytes, monocytes and granulocytes (neutophils, basophils and eosinophils), which all originate from the HSC. Telomere length differs between leukocyte subsets.40 However, since there is synchrony between the different subsets, an individual’s LTL likely reflects the telomere length of the HSCs.41 In this study we show that LTL is associated with several leukocyte subset counts, namely lymphocyte, neutrophil and basophil counts (Table S2, available as Supplementary data at IJE online), which indicates that mean LTL is influenced by the frequency of the different leukocyte subsets. However, when we adjusted the prospective analysis of mortality for these counts, the effect of LTL on prospective mortality remained unchanged, indicating that the proportion of LTL variation caused by the frequency of the different leukocyte subsets does not influence prospective mortality. Nevertheless, this leaves the possibility open that LTL reflects the available HSC population.
Telomere dysfunction was found to be determined by the frequency of critically short telomeres. A recent study showed that the rate of increase in the frequency of these critically short telomeres, and not the rate of telomere length shortening, determines longevity in mice.42 Since in the current study we only determined the mean LTL of an individual, we could not discriminate between individuals according to the frequency of dysfunctional telomeres. It would therefore be interesting to use quantitative fluorescence in situ hybridization (Q-FISH), a method that is able to quantify critically short telomeres in subsets of cells,43 to determine the influence of the frequency of dysfunctional telomeres on longevity and prospective mortality in humans.
In conclusion, we confirmed LTL to be a marker of prospective mortality in middle and highly advanced age and additionally show that this association could not be explained by the association of LTL with the immune-related markers IGF-1/IGFBP3, CRP, IL-6, CMV serostatus or WBC counts or by the currently known genetic variants contributing to LTL variation. Furthermore, we have shown that LTL is not associated with familial longevity in middle age. Hence, the approaches followed here do not further support the hypothesis that LTL contributes to the genetic propensity for longevity. Further studies need to be performed to determine which other environmental or novel genetic effects could underlie the association of LTL with prospective mortality.
Supplementary Data
Supplementary data are available at IJE online.
Funding
This work was supported by funds from the European Community's Seventh Framework Programme (FP7/2007–2013), ENGAGE Consortium, grant agreement HEALTH-F4-2007-201413.
For the LLS, the research leading to these results has received funding from the European Union's Seventh Framework Programme (FP7/2007-2011) under grant agreementr no. 259679. This study was financially supported by the Innovation-Oriented Research Program on Genomics (SenterNovem IGE05007), the Centre for Medical Systems Biology and the Netherlands Consortium for Healthy Ageing (grant 050-060-810), all in the framework of the Netherlands Genomics Initiative, Netherlands Organization for Scientific Research (NWO), by Unilever Colworth and by BBMRI-NL, a research infrastructure financed by the Dutch government (NWO 184.021.007).
CardioMetabolic Twins was supported by grants from the National Institutes of Health (AG028555, AG08861, AG04563, AG10175 and AG08724), the Swedish Council on Social Research, the MacArthur Foundation Research Network on Successful Aging, the Axel and Margaret Ax:son Johnson Foundation, the Swedish Foundation for Health Care Sciences and Allergy Research, and the Swedish Research Council (2007-2722).
The work by co-authors on behalf of the EGCUT study was supported by the OPENGENE grant from the European Commission Seventh Framework Programme, targeted funding from the Estonian Government (SF0180142s08), the Estonian Research Roadmap through the Estonian Ministry of Education and Research, the Center of Excellence in Genomics (EXCEGEN), the University of Tartu (SP1GVARENG) and the Estonian Science Foundation (ETF9353).
The PROSPER study was supported by an investigator-initiated grant obtained from Bristol-Myers Squibb. J.W.J. is an established clinical investigator for the Netherlands Heart Foundation (grant 2001 D 032). Support for genotyping was provided by the seventh framework programme of the European commission (grant 223004) and by the Netherlands Genomics Initiative (Netherlands Consortium for Healthy Aging, grant 050-060-810).
The Rotterdam Study was supported by Netherlands Genomics Initiative (Netherlands Consortium for Healthy Aging, (grant 050-060-810), Netherlands Organisation for Scientific Research (NWO) (904-61-090, 904-61-193, 480-04-004, 400-05-717, SPI 56-464-1419, 175.010.2005.011 and 911-03-012) and Netspar – Living longer for good health.
TwinGene was supported by the Swedish Research Council (M-2005-1112), GenomEUtwin (EU/QLRT-2001-01254; QLG2-CT-2002-01254), NIH DK U01-066134, the Swedish Foundation for Strategic Research (SSF) and the Heart and Lung foundation no. 20070481.
V.C. and N.J.S. are supported by the British Heart Foundation and N.J.S. is an NIHR senior investigator.
Conflict of interest: None declared.
Supplementary Material
References
- 1.Blackburn EH. Structure and function of telomeres. Nature 1991;350:569–73 [DOI] [PubMed] [Google Scholar]
- 2.Harley CB, Futcher AB, Greider CW. Telomeres shorten during ageing of human fibroblasts. Nature 1990;345:458–60 [DOI] [PubMed] [Google Scholar]
- 3.Slagboom PE, Droog S, Boomsma DI. Genetic determination of telomere size in humans: a twin study of three age groups. Am J Hum Genet 1994;55:876–82 [PMC free article] [PubMed] [Google Scholar]
- 4.Benetos A, Okuda K, Lajemi M, et al. Telomere length as an indicator of biological aging: the gender effect and relation with pulse pressure and pulse wave velocity. Hypertension 2001;37:381–85 [DOI] [PubMed] [Google Scholar]
- 5.Fitzpatrick AL, Kronmal RA, Gardner JP, et al. Leukocyte telomere length and cardiovascular disease in the cardiovascular health study. Am J Epidemiol 2007;165:14–21 [DOI] [PubMed] [Google Scholar]
- 6.Demissie S, Levy D, Benjamin EJ, et al. Insulin resistance, oxidative stress, hypertension, and leukocyte telomere length in men from the Framingham Heart Study. Aging Cell 2006;5:325–30 [DOI] [PubMed] [Google Scholar]
- 7.Willeit P, Willeit J, Kloss-Brandstatter A, Kronenberg F, Kiechl S. Fifteen-year follow-up of association between telomere length and incident cancer and cancer mortality. JAMA 2011;306:42–44 [DOI] [PubMed] [Google Scholar]
- 8.Sanders JL, Newman AB. Telomere length in epidemiology: a biomarker of aging, age-related disease, both, or neither? Epidemiol Rev 2013; 9 Jan:epub ahead of print. PMID: 23302541 [DOI] [PMC free article] [PubMed] [Google Scholar]
- 9.Levy MZ, Allsopp RC, Futcher AB, Greider CW, Harley CB. Telomere end-replication problem and cell aging. J Mol Biol 1992;225:951–60 [DOI] [PubMed] [Google Scholar]
- 10.von Zglinicki T. Oxidative stress shortens telomeres. Trends Biochem Sci 2002; 27: 339–44 [DOI] [PubMed] [Google Scholar]
- 11.Schwarz KB. Oxidative stress during viral infection: a review. Free Radic Biol Med 1996;21:641–49 [DOI] [PubMed] [Google Scholar]
- 12.Barbieri M, Paolisso G, Kimura M, et al. Higher circulating levels of IGF-1 are associated with longer leukocyte telomere length in healthy subjects. Mech Ageing Dev 2009;130:771–76 [DOI] [PubMed] [Google Scholar]
- 13.Kaplan RC, Fitzpatrick AL, Pollak MN, et al. Insulin-like growth factors and leukocyte telomere length: the cardiovascular health study. J Gerontol A Biol Sci Med Sci 2009; 64:1103–06 [DOI] [PMC free article] [PubMed] [Google Scholar]
- 14.Heemskerk VH, Daemen MA, Buurman WA. Insulin-like growth factor-1 (IGF-1) and growth hormone (GH) in immunity and inflammation. Cytokine Growth Factor Rev 1999;10:5–14 [DOI] [PubMed] [Google Scholar]
- 15.Naugler WE, Karin M. The wolf in sheep's clothing: the role of interleukin-6 in immunity, inflammation and cancer. Trends Mol Med 2008;14:109–19 [DOI] [PubMed] [Google Scholar]
- 16.Pepys MB, Hirschfield GM. C-reactive protein: a critical update. J Clin Invest 2003;111:1805–12 [DOI] [PMC free article] [PubMed] [Google Scholar]
- 17.Atzmon G, Cho M, Cawthon RM, et al. Evolution in health and medicine Sackler colloquium: Genetic variation in human telomerase is associated with telomere length in Ashkenazi centenarians. Proc Natl Acad Sci U S A 2010;107(Suppl 1):1710–17 [DOI] [PMC free article] [PubMed] [Google Scholar]
- 18.Broer L, Codd V, Nyholt DR, et al. Meta-analysis of telomere length in 19 713 subjects reveals high heritability, stronger maternal inheritance and a paternal age effect. Eur J Hum Genet 2013;Oct:1163–68 [DOI] [PMC free article] [PubMed] [Google Scholar]
- 19.Mangino M, Hwang SJ, Spector TD, et al. Genome-wide meta-analysis points to CTC1 and ZNF676 as genes regulating telomere homeostasis in humans. Hum Mol Genet 2012;21:5385–94 [DOI] [PMC free article] [PubMed] [Google Scholar]
- 20.Codd V, Nelson CP, Albrecht E, et al. Identification of seven loci affecting mean telomere length and their association with disease. Nat Genet 2013;45:422–27 [DOI] [PMC free article] [PubMed] [Google Scholar]
- 21.Deelen J, Uh HW, Monajemi R, et al. Gene set analysis of GWAS data for human longevity highlights the relevance of the insulin/IGF-1 signaling and telomere maintenance pathways. Age (Dordr) 2011;35:235–49 [DOI] [PMC free article] [PubMed] [Google Scholar]
- 22.Soerensen M, Thinggaard M, Nygaard M, et al. Genetic variation in TERT and TERC and human leukocyte telomere length and longevity: a cross-sectional and longitudinal analysis. Aging Cell 2012;11:223–27 [DOI] [PMC free article] [PubMed] [Google Scholar]
- 23.Schoenmaker M, de Craen AJ, de Meijer PH, et al. Evidence of genetic enrichment for exceptional survival using a family approach: the Leiden Longevity Study. Eur J Hum Genet 2006;14:79–84 [DOI] [PubMed] [Google Scholar]
- 24.Slagboom PE, Beekman M, Passtoors WM, et al. Genomics of human longevity. Philos Trans R Soc Lond B Biol Sci 2011;366:35–42 [DOI] [PMC free article] [PubMed] [Google Scholar]
- 25.Westendorp RG, van Heemst D, Rozing MP, et al. Nonagenarian siblings and their offspring display lower risk of mortality and morbidity than sporadic nonagenarians: The Leiden Longevity Study. J Am Geriatr Soc 2009;57:1634–37 [DOI] [PubMed] [Google Scholar]
- 26.Beekman M, Blauw GJ, Houwing-Duistermaat JJ, Brandt BW, Westendorp RG, Slagboom PE. Chromosome 4q25, microsomal transfer protein gene, and human longevity: novel data and a meta-analysis of association studies. J Gerontol A Biol Sci Med Sci 2006;61:355–62 [DOI] [PubMed] [Google Scholar]
- 27.Muezzinler A, Zaineddin AK, Brenner H. A systematic review of leukocyte telomere length and age in adults. Ageing Res Rev 2013;12:509–19 [DOI] [PubMed] [Google Scholar]
- 28.Rozing MP, Westendorp RG, Frolich M, et al. Human insulin/IGF-1 and familial longevity at middle age. Aging (Albany NY) 2009;1:714–22 [DOI] [PMC free article] [PubMed] [Google Scholar]
- 29.Rozing MP, Mooijaart SP, Beekman M, et al. C-reactive protein and glucose regulation in familial longevity. Age (Dordr) 2011;33:623–30 [DOI] [PMC free article] [PubMed] [Google Scholar]
- 30.Stijntjes M, de Craen AJ, van Heemst D, et al. Familial longevity is marked by better cognitive performance at middle age: the Leiden Longevity Study. PLoS One 2013;8:e57962. [DOI] [PMC free article] [PubMed] [Google Scholar]
- 31.Derhovanessian E, Maier AB, Beck R, et al. Hallmark features of immunosenescence are absent in familial longevity. J Immunol 2010;185:4618–24 [DOI] [PubMed] [Google Scholar]
- 32.Ehret GB, Munroe PB, Rice KM, et al. Genetic variants in novel pathways influence blood pressure and cardiovascular disease risk. Nature 2011; 478:103–09 [DOI] [PMC free article] [PubMed] [Google Scholar]
- 33.Mortensen LH, Maier AB, Slagbom PE, et al. Early-life environment influencing susceptibility to cytomegalovirus infection: evidence from the Leiden Longevity Study and the Longitudinal Study of Aging Danish Twins. Epidemiol Infect 2012;140:835–41 [DOI] [PubMed] [Google Scholar]
- 34.Bakaysa SL, Mucci LA, Slagboom PE, et al. Telomere length predicts survival independent of genetic influences. Aging Cell 2007;6:769–74 [DOI] [PubMed] [Google Scholar]
- 35.Rajpathak SN, McGinn AP, Strickler HD, et al. Insulin-like growth factor-(IGF)-axis, inflammation, and glucose intolerance among older adults. Growth Horm IGF Res 2008;18:166–73 [DOI] [PMC free article] [PubMed] [Google Scholar]
- 36.Sesmilo G, Biller BM, Llevadot J, et al. Effects of growth hormone administration on inflammatory and other cardiovascular risk markers in men with growth hormone deficiency. A randomized, controlled clinical trial. Ann Intern Med 2000;133:111–22 [DOI] [PubMed] [Google Scholar]
- 37.Robinson MW, McGuinness D, Swann R, et al. Non cell autonomous upregulation of CDKN2 transcription linked to progression of chronic hepatitis C disease. Aging Cell 2013;12:1141–43 [DOI] [PubMed] [Google Scholar]
- 38.Aviv A. The epidemiology of human telomeres: faults and promises. J Gerontol A Biol Sci Med Sci 2008;63:979–83 [DOI] [PubMed] [Google Scholar]
- 39.Deelen J, Beekman M, Capri M, Franceschi C, Slagboom PE. Identifying the genomic determinants of aging and longevity in human population studies: Progress and challenges. BioEssays 2013;35:386–96 [DOI] [PMC free article] [PubMed] [Google Scholar]
- 40.Rufer N, Brummendorf TH, Kolvraa S, et al. Telomere fluorescence measurements in granulocytes and T lymphocyte subsets point to a high turnover of hematopoietic stem cells and memory T cells in early childhood. J Exp Med 1999;190:157–67 [DOI] [PMC free article] [PubMed] [Google Scholar]
- 41.Kimura M, Gazitt Y, Cao X, Zhao X, Lansdorp PM, Aviv A. Synchrony of telomere length among hematopoietic cells. Exp Hematol 2010;38:854–59 [DOI] [PMC free article] [PubMed] [Google Scholar]
- 42.Vera E, Bernardes de JB, Foronda M, Flores JM, Blasco MA. The rate of increase of short telomeres predicts longevity in mammals. Cell Rep 2012;2:732–37 [DOI] [PubMed] [Google Scholar]
- 43.Canela A, Vera E, Klatt P, Blasco MA. High-throughput telomere length quantification by FISH and its application to human population studies. Proc Natl Acad Sci U S A 2007;104:5300–05 [DOI] [PMC free article] [PubMed] [Google Scholar]
Associated Data
This section collects any data citations, data availability statements, or supplementary materials included in this article.