

SUMMARY
Neural circuitry and brain activity depend critically on proper function of voltage-gated calcium channels (VGCCs), whose activity must be tightly controlled. We show that the main body of the pore-forming α1 subunit of neuronal L-type VGCCs, Cav1.2, is proteolytically cleaved, resulting in Cav1.2 fragment-channels that separate but remain on the plasma membrane. This “gmid-channel” proteolysis is regulated by channel activity, involves the Ca2+-dependent protease calpain and the ubiquitin-proteasome system, and causes attenuation and biophysical alterations of VGCC currents. Recombinant Cav1.2 fragment-channels mimicking the products of mid-channel proteolysis do not form active channels on their own, but when properly paired, produce currents with distinct biophysical properties. Mid-channel proteolysis increases dramatically with age and can be attenuated with an L-type VGCC blocker in vivo. Mid-channel proteolysis represents a novel form of homeostatic negative-feedback processing of VGCCs that could profoundly affect neuronal excitability, neurotransmission, neuroprotection, and calcium signaling in physiological and disease states.
INTRODUCTION
VGCCs (L-, N-, P/Q-, R-, and T-types) control a plethora of physiological processes, from muscle contraction, heartbeat, neural communication and hormone secretion to cell differentiation, motility, growth and apoptosis (Catterall, 2000). Their mutations and dysfunction are linked to diverse disorders such as epilepsy, migraine, ataxia, hypertension, arrhythmia, and autism (Cain and Snutch, 2011; Liao and Soong, 2010; Pietrobon, 2010; Striessnig et al., 2010; Zamponi et al., 2010). In neurons, L-type VGCCs regulate membrane excitability, Ca2+ signaling, and gene transcription (Catterall, 2000; Deisseroth et al., 2003; Dolmetsch, 2003; Wheeler et al., 2012). Changes in L-type VGCC activity are linked to aging and age-related neurodegenerative diseases (Moyer et al., 1992; Thibault and Landfield, 1996; Thibault et al., 1998), and variations in L-type VGCC genes are linked to neuropsychiatric diseases including schizophrenia, bipolar disorder, autism spectrum disorder, major depressive disorder, and attention deficit-hyperactivity disorder (Smoller et al., 2013).
To serve their vital and varying roles, VGCCs are subject to tight regulation by diverse pathways and mechanisms (Catterall, 2000; Zamponi and Currie, 2013). One form of regulation is proteolytic processing of the cytosolic C-terminus (Ct) of the α1 subunit (Cavα1) of L-type VGCCs (Brawley and Hosey, 1992; De Jongh et al., 1994; De Jongh et al., 1991; Gao et al., 2001; Gerhardstein et al., 2000; Hell et al., 1993; Hulme et al., 2005; Hulme et al., 2006; Lai et al., 1990). This proteolysis produces a 30–45 kDa distal C-terminal fragment, which acts as an auto-inhibitory domain (Hulme et al., 2006). Relief of this autoinhibition is believed to underlie the sympathetic nerve stimulation-induced increase of cardiac and skeletal muscle calcium currents, part of the “fight or flight” response (Fuller et al., 2010). In addition to this Ct fragment, a spectrum of other fragments has been observed in Western blots of L-, N- and P/Q-type Cavα1 (Kordasiewicz et al., 2006; Leenders et al., 2008; Leenders et al., 2002; Ramakrishnan et al., 2006; Sakurai et al., 1995; Schiff et al., 2000; Scott et al., 1998; Westenbroek et al., 1995; Woppmann et al., 1994); the most consistent and prominent include a 90-kDa, a 150-kDa, and a 170-kDa fragment. These fragments have generally been thought to be non-specific degradation products. Intriguingly, however, short isoforms of L- and P/Q-type Cavα1 have been found in neurons and muscle cells (Malouf et al., 1992; Okagaki et al., 2001; Scott et al., 1998). Moreover, truncated P/Q-type Cavα1, generated by disease-causing mutations, are present in neurons (Jeng et al., 2008; Mezghrani et al., 2008; Page et al., 2004; Pietrobon, 2010; Scott et al., 1998; Wappl et al., 2002).
VGCCs are typically composed of a pore-forming Cavα1 and auxiliary α2δ and β (Cavβ) subunits. Full length Cavα1 is a large protein (with a predicted molecular mass of 190–280 kDa) consisting of four homologous repeats, each containing six transmembrane segments; the four repeats are connected by cytoplasmic loops termed I–II loop, II–III loop, and III–IV loop. The aforementioned findings motivated us to investigate the existence and functional importance of proteolytic cleavage in the core (i.e., the four repeats and the tethering cytosolic loops) of Cavα1. We find that indeed the core of native brain L-type Cavα1, Cav1.2, undergoes extensive regulated proteolysis, generating Cav1.2 fragments on the plasma membrane and greatly influencing channel activity. We further find that this proteolysis is age-dependent and can be reversed in vivo by reducing L-type channel activity. To distinguish this proteolytic event from C-terminal proteolysis, we refer to it as “mid-channel proteolysis”.
RESULTS
Biochemical detection of mid-channel proteolysis of native L-type channels
We first studied mid-channel proteolysis of native L-type channels in cortical brain slices freshly isolated from 6-week old rats. Surface channels were biotinylated and analyzed by Western blot. When probed with an antibody against the Cav1.2 II–III loop (anti-LII–III, epitope=T821-S838 of rat brain Cav1.2, Figure 1A), two prominent bands were routinely observed: 240 kDa (full-length Cav1.2) and 150 kDa (Figures 1B–1I). An 85-kDa band was also sometimes detected (Figures 1B–1G). The 150-kDa band was also recognized (Figure 1D, arrow) by an antibody against the distal C-terminus (anti-Ct, epitope=G2127-L2143, Figure 1A). Thus, this fragment appears to contain part of II–III loop, repeats III and IV, and the C-terminus (Figure 1A). Anti-Ct also labeled bands at 100 kDa and 70 kDa (Figure 1D, arrowheads). Probing with an antibody against the N-terminus (anti-Nt, epitope=V2-N14, Figure 1A) also revealed several low molecular weight (MW) bands, including those at 175 kDa, 100 kDa, and 90 kDa (Figure 1E, arrowheads and arrow). These results suggest that native Cav1.2 in cortical neurons undergo extensive proteolysis in vivo and that the cleaved products reside in the plasma membrane as fragment-channels. The 150-kDa fragment detected by both anti-LII–III and anti-Ct (Figures 1C, 1D, arrow) and the 90-kDa fragment detected by anti-Nt (Figure 1E, arrow) are complementary, adding up to 240 kDa (expected full-length Cav1.2 MW). As the 150-kDa fragment was the most robust, we focused subsequent studies on this fragment.
Figure 1. Mid-channel proteolysis of native Cav1.2 in cortical neurons and its dependence on channel activity.

(A) Domain topology of Cav1.2. Indicated are epitope locations for three antibodies (anti-LII–III, anti-Ct and anti-Nt) and predicted molecular masses for full-length Cav1.2 and two fragment-channels generated by a presumed proteolytic cut (scissors).
(B) Western blot with anti-LII–III of native Cav1.2 in surface-biotinylated (+) and non-biotinylated (−) cortical slices from 6-week old rats, showing a 150-kDa band (arrow).
(C–E) Western blot with anti-LII–III (C), anti-Ct (D) or anti-Nt (E) of native Cav1.2 from the same sample of surface-biotinylated cortical slices.
(F–I) Channel activity-dependent regulation of mid-channel proteolysis. Left: representative Western blot with anti-LII–III of Cav1.2 in cortical slices treated with either vehicle (control) or the indicated reagent(s) before surface biotinylation: (F) verapamil (VP, 65 μM, 2 hr); (G) nifedipine (Nif, 10 μM, 2 hr) and CNQX (21.5 μM, 2 hr); (H) ionomycin (Iono, 3 μM, 45 min); (I) BayK8644 (14 μM, 40 min) and 65 mM KCl (40 min). Middle: bar graph depicting the proteolysis index (intensity ratio of 150-kDa/240-kDa band) for the representative gel. Right: summary graph showing data pooled from the indicated number of independent experiments. In this and all subsequent figures, data in bar graphs are represented as mean±s.e.m. and asterisks denote statistical differences, with P<0.01, unless indicated otherwise. See also Figure S5.
Mid-channel proteolysis is bidirectionally regulated
We next investigated whether Cav1.2 mid-channel proteolysis is a regulated event occurring in vivo. To minimize non-specific degradation, abundant protease inhibitors were added and all procedures were performed rapidly at 4°C. More critically, as non-specific degradation is an unregulated event, we investigated whether mid-channel proteolysis could instead be disrupted or enhanced. Agents that affect intracellular Ca2+, L-type channel activity, and/or cell excitability were used to treat cortical slices prior to surface biotinylation. To quantify mid-channel proteolysis, densitometry was used to define a proteolysis index as the intensity ratio of the 150-kDa/240-kDa bands detected by anti-LII–III. This index is unaffected by the total protein amount since it is the ratio of two bands from the same lane/sample. The non-normalized proteolysis index differed among preparations (Figures 1F–1I), reflecting intrinsic animal-to-animal variation. However, this variation does not affect pair-wise comparison of control and test results, which were obtained from parallel experiments from the same animal.
Mid-channel proteolysis was decreased by the L-type channel antagonist verapamil (Figure 1F), or by an activity-suppressing cocktail of nifedipine (another L-type channel antagonist) and the glutamate receptor inhibitor CNQX (Figure 1G). In contrast, mid-channel proteolysis was increased by the Ca2+-ionophore ionomycin (Figure 1H), and by an activity-enhancing cocktail of high extracellular K+ and L-type channel agonist BayK8644 (Figure 1I). Thus, mid-channel proteolysis correlated with L-type channel activity and intracellular Ca2+ levels. This bidirectional regulation suggests that Cav1.2 mid-channel proteolysis takes place in vivo.
Regulated mid-channel proteolysis of native Cav1.2 was also observed in cultured hippocampal neurons (Figure 2A and Figure S1A). After surface biotinylation and Western blot, anti-LII–III robustly detected bands at 240 kDa and 150 kDa (Figure 2A, left, arrow). Both bands were also detected by anti-Ct (Figure 2A, middle, arrow), as were a 100-kDa band and a 70-kDa band (arrowheads), which were also present in cortical slices (Figure 1D, arrowheads). In the same samples, anti-Nt visualized the 240-kDa band and a 90-kDa band (Figure 2A, right, arrow). The detection of the complementary 150-kDa and 90-kDa bands in both cortical slices and cultured hippocampal neurons is consistent with proteolysis in the II–III loop of Cav1.2.
Figure 2. Visualization of mid-channel proteolysis of Cav1.2 in the plasma membrane of cultured hippocampal neurons.

(A) Western blot with the indicated antibodies of native Cav1.2 from the same preparation of surface-biotinylated neurons.
(B) Confocal images of a representative dendritic segment of a neuron expressing LGH3. Left: surface and intracellular LGH3 indicated by GFP. Middle: surface LGH3 indicated by anti-HA+Alexa594 secondary antibodies. Right: overlay. Exemplar clusters of red/green colocalization and non-colocalization are marked by yellow and white arrows, respectively. Scale bar: 5 μm.
(C) Fluorescence intensity profile (bottom) of another dendritic segment (top). Exemplar clusters of red/green colocalization and non-colocalization are marked by * and **, respectively.
(D) Quantification of red/green colocalization in two dendritic segments displaying visually different extents of mid-channel proteolysis. Left and middle: images of GFP (lane 1), HA-Alexa594 (lane 2), overlay (lane 3) and the “voxels” selected according to our analysis protocol (lane 4). Right: cumulative distribution of the non-colocalization index (NCI) for the two selected dendritic segments. Scale bar: 10 μm.
(E) Ensemble cumulative distribution of NCI from the dendrites of neurons expressing LGH3 randomly divided into two groups (n=15 each, same culture).
(F) Ensemble cumulative distribution of NCI from the dendrites of neurons expressing LGH1 (n=23), LGH2 (n=15) and LGH3 (n=13). All experiments were performed in parallel. The three distributions were significantly different. See also Figures S1 and S2.
Visualization of mid-channel proteolysis reveals separation of cleaved fragment-channels
The above biochemical results indicate that the complementary 150-kDa and 90-kDa Cav1.2 fragments are present on the plasma membrane. Do these cleaved fragments remain associated on the cell surface? To address this question, we transfected cultured hippocampal neurons with “LGH3”, a Cav1.2 tagged with GFP on the N-terminus and HA on an extracelluar loop of repeat III (Figure S1B), and visualized the channels by confocal microscopy. LGH3 generated currents in Xenopus oocytes (Figure S1C) and expressed robustly in cultured hippocampal neurons (Figure S2). Labeling the HA tag with an anti-HA antibody and Alexa594 under non-permeabilizing conditions revealed LGH3 on the plasma membrane (Figure S2A, red). Cav1.2 with GFP but without HA tag (LGN) showed no surface labeling (Figure S2B), indicating that the anti-HA labeling was specific.
In optical sections, Alexa594-labeled dendrites of LGH3-expressing neurons often displayed a membrane-associated pattern (Figure 2B, middle), consistent with red labeling representing surface Cav1.2. Surface Cav1.2 channels tend to form clusters (Figures 2B and 2C), as has been reported (Di Biase et al., 2011). Intriguingly, in some locations green and red clustered separately (Figure 2B, left, and 2C). Green-only clusters likely represent intracellular LGH3 and are expected, but red-only clusters are anomalous - in theory, GFP and HA signals should colocalize since the two tags are on the same protein. The separation of red and green, however, is consistent with cleavage of Cav1.2 somewhere between the two tags. Furthermore, it suggests that the cleavage products on the plasma membrane dissociate from one another.
We developed an unbiased procedure to quantify red/green separation in imaging experiments: (1) A software routine scanned optical sections of dendrites and automatically detected red “voxels”, each with a dimension of 0.211 x 0.211 x 0.211 μm (typical dendrites are <2 μm in diameter), and ~10,000 voxels were typically found per neuron; (2) The intensity of red and green for each voxel was measured; (3) The red/green ratio, termed non-colocalization index (NCI), was calculated, binned, and graphed in a cumulative frequency (ordinate) vs. NCI (abscissa) plot (Figures 2D–2F).
Three conclusions apply to the results of this analysis protocol: (i) Voxels of high NCI are likely proteolysis hot spots and contain proteolytically cleaved, HA-containing fragment-channels, including the 150-kDa fragment; (ii) the higher the NCI, the more extensive the proteolysis; and (iii) a shift of the distribution curve to the right signifies greater proteolysis.
The above analysis protocol was calibrated in two dendritic segments selected for their different extent of red/green separation (Figure 2D). As expected, the segment displaying a higher number of visual red-only spots (segment y) showed a right-shifted NCI distribution (Figure 2D). In another critical test, LGH3-expressing neurons from the same culture randomly divided into two groups showed identical ensemble NCI distributions (Figure 2E), strongly validating the analysis protocol.
Visualization of mid-channel proteolysis suggests multiple cleavage sites
If red/green separation represents mid-channel proteolysis of Cav1.2, it should decrease when GFP and HA are closer together on the channel. Moreover, the appearance of multiple Cav1.2 fragments in Western blots (Figures 1D, 1E and 2A) suggests that there may be more than one cleavage site in the Cav1.2 core domain. To test these predictions, we constructed two additional GFP/HA double-tagged Cav1.2 subunits named LGH1 and LGH2 (HA positioned extracellularly on repeats I or II, respectively). LGH1 and LGH2 produced currents in oocytes (Figure S1C), confirming they traffic to the plasma membrane and are functional. Parallel imaging experiments showed markedly reduced red/green separation as the two tags were moved closer together (Figure 2F). These results further validate the analysis protocol and support the notion that red/green separation is indicative of mid-channel proteolysis. They also suggest proteolysis not only in the II–III loop but also in the I–II loop.
Molecular determinants of mid-channel proteolysis
To examine the signaling pathways of mid-channel proteolysis, we first tested the role of calpain, a Ca2+-sensitive protease likely responsible for the cleavage of Cav1.2 C-terminus (Hell et al., 1996; Hulme et al., 2006). A cocktail of calpain inhibitors significantly reduced mid-channel proteolysis in hippocampal neurons, detected by both Western blot and imaging (Figures 3A and 3B), supporting calpain’s involvement. However, residual mid-channel proteolysis persisted (Figure 3A), suggesting additional proteases. We thus tested the role of the ubiquitin-proteasome system, a common route for protein degradation. The mid-channel proteolysis of LGH3 was markedly reduced by a cocktail of ubiquitin aldehyde, a general inhibitor of ubiquitination, and MG-132, a proteasome inhibitor (Figure 3C), and by mutating a putative ubiquitination motif on LGH3 (Figure 3D). Two PEST sequences have been found in Cav1.2, in the I–II and II–III loops (Catalucci et al., 2009) (named PEST1 and PEST3, respectively, Figure 3E); PEST sequences serve as signals for rapid proteolysis and possible degradation by the ubiquitin-proteasome system in various proteins (Rechsteiner and Rogers, 1996). Mid-channel proteolysis was greatly reduced by PEST3 deletion (Figure 3F) and was virtually abolished by PEST1 deletion (Figure 3G and Figure S3C). These results identify structural elements regulating mid-channel proteolysis and suggest a compelling role for the ubiquitin-proteasome system.
Figure 3. Signaling pathways and molecular determinants of Cav1.2 mid-channel proteolysis.

(A) Role of calpain. Left: representative Western blot with anti-LII–III in hippocampal neurons treated, before surface biotinylation, with a cocktail of calpain inhibitors (200 nM calpeptin, 1 μM ALLN, and 270 nM calpain inhibitor III) for 80 min at 37°C. Middle: proteolysis index for the representative gel. Right: summary graph showing data pooled from 4 independent experiments. P<0.05.
(B) Ensemble cumulative distribution of NCI from the dendrites of neurons expressing LGH3 treated with DMSO (control, n=24) or calpain inhibitors (n=19).
(C) Ensemble cumulative distribution of NCI from the dendrites of neurons expressing LGH3 (n=13) treated with DMSO (control) or a cocktail of MG-132 (7 μM) and ubiquitin aldehyde (1 μM) for 75 min at 37°C.
(D) Ensemble cumulative distribution of NCI from the dendrites of neurons expressing LGH3 (n=16) or LGH3_PY/AA (n=17), where residues P1364 and Y1365 of LGH3 were mutated to alanine.
(E) Schematic domain topology of LGH3, marking the positions and amino acid sequences of the PEST1 site, the PEST3 site, and the PY motif.
(F) Ensemble cumulative distribution of NCI from the dendrites of neurons expressing LGH3 (n=19) or LGH3_ΔPEST3 (n=17), where residues H840-R861 of LGH3 were deleted.
(G) Ensemble cumulative distribution of NCI from the dendrites of neurons expressing LGH3 (n=19) or LGH3_ΔPEST1 (n=15), where residues D446-D459 of LGH3 were deleted. Representative dendrites are shown in Figure S3C. In (B–D), (F) and (G), all experiments in each panel were performed in parallel, and the two distributions were significantly different. See also Figure S3.
Separation of fragment-channels is regulated by channel activity
Mid-channel proteolysis of LGH3, like that of endogenous Cav1.2, was regulated by L-type channel activity. Depolarizing neurons with high extracellular K+, in the absence or presence of BayK8644, increased mid-channel proteolysis in both imaging and Western blot experiments (Figures 4A and 4B). On the other hand, treatment with nifedipine, even in the presence of high extracellular K+, decreased it (Figures 4C, 4D and Figure S4). These results further support the notion that the red/green separation is a consequence and manifestation of mid-channel proteolysis.
Figure 4. Channel activity-dependent regulation of Cav1.2 mid-channel proteolysis and Ca2+ channel currents in cultured hippocampal neurons.
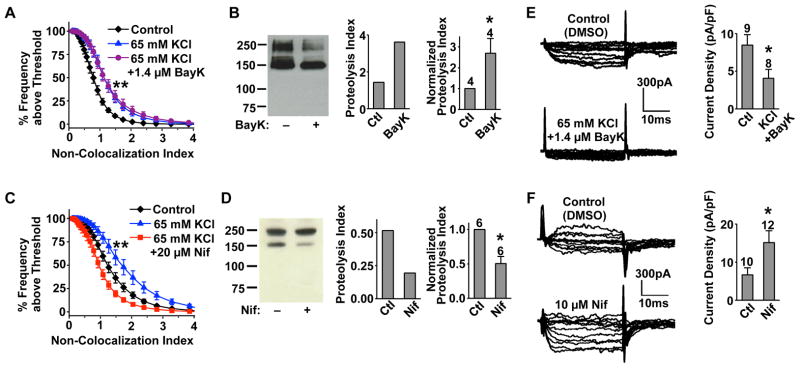
(A and C) Ensemble cumulative distribution of NCI from the dendrites of neurons expressing LGH3. Neurons were treated for 30 min with DMSO (control), DMSO and 65 mM KCl, or 1.4 μM BayK8644 and 65 mM KCl (n=13 for all) in (A); or with DMSO (control) (n=19), DMSO and 65 mM KCl (n=14), or 20 μM nifedipine and 65 mM KCl (n=18) in (C). Representative dendrites for each condition are shown in Figure S4A. All experiments in each panel were performed in parallel. In (A), the two treated groups were significantly different from control but not from each other; in (C), all three distributions were significantly different. The same results were obtained from two other independent cultures.
(B and D) Channel activity-dependent regulation of mid-channel proteolysis. Left: representative Western blot with anti-LII–III in neurons treated (1hr) with DMSO (ctl) or BayK8644 (1.4 μM) (B), or nifedipine (10 μM) (D), before surface biotinylation. Middle: proteolysis index for the representative gel. Right: summary graph showing data pooled from the indicated number of independent experiments.
(E and F) Whole-cell Ca2+ channel currents from neurons blindly treated for 30 min with DMSO (ctl), or 65 mM KCl and 1.4 μM BayK8644 (E), or 10 μM nifedipine (F). Left: representative family of currents recorded from the indicated neuron. Right: summary graph of the maximal current density for the indicated group of neurons. Number of blind recordings is indicated above the bar. P<0.05. See also Figure S4.
Functional impact of mid-channel proteolysis
We next investigated the functional effect of mid-channel proteolysis on calcium channel currents in several ways. First, we tested the long-term effect of two treatments shown to differentially alter mid-channel proteolysis on native VGCC currents in hippocampal neurons. Incubating neurons with high K+ and BayK8644 (followed by washout) increased mid-channel proteolysis (Figures 4A and 4B) and reduced VGCC currents (Figure 4E), whereas incubation with nifedipine (followed by washout) decreased mid-channel proteolysis (Figures 4C and 4D) and enhanced VGCC currents (Figure 4F). These results are consistent with a hypothesis that mid-channel proteolysis serves to homeostatically regulate VGCC activity, keeping at bay excessive Ca2+ influx that could have a potential deleterious effect to neurons.
Second, in another test of the long-term effect of mid-channel proteolysis, we inserted a cleavage motif for the tobacco etch virus protease (TEVp) in the II–III loop of LGH3 (between D815 and G816, upstream of the anti-LII–III epitope T821-S838), generating LGH3_TEVp (Figure 5A). Xenopus oocytes expressing LGH3, LGH3_TEVp, or LGH3 with TEVp had comparable currents (Figure 5B, top), but those expressing LGH3_TEVp with TEVp had much smaller currents (Figure 5B, top). The latter group showed a prominent 150-kDa fragment detected by anti-LII–III on the plasma membrane, with a drastic concomitant reduction of the 270-kDa (Cav1.2 + 27-kDa GFP) full-length band (Figure 5B, bottom). This 150-kDa fragment, largely absent in the three control groups, most likely represents the C-terminal product of specific TEVp cleavage of LGH3_TEVp. The decreased current of LGH3_TEVp by TEVp proteolysis validates the hypothesis that mid-channel proteolysis down-regulates VGCC currents.
Figure 5. Functional effect of mid-channel cleavage at an engineered site on Ca2+ channel currents and properties.

(A) Schematic of LGH3_TEVp, which contains a TEVp cutting site (yellow circle) in the II–III loop between D815 and G816, upstream of the anti-LII–III epitope T821-S838.
(B) Whole-cell currents (top) recorded at −10 mV from oocytes expressing the indicated constructs (middle). Currents were normalized to the mean value of the left-most control group. Number of measurements indicated above the bar. Bottom: Western blot with anti-LII–III of surface-biotinylated oocytes from the exact same groups.
(C) Voltage-dependence of activation of currents recorded from inside-out macropatches excised from oocytes expressing Cav2.1_TEVp or WT Cav2.1, before (top) or after (bottom) bath application of 100 μM purified TEVp or TEVp(C151A). Standard error is smaller than the symbols (n=7–10). See also Figure S6A.
Third, we examined the acute effect of mid-channel proteolysis. To accomplish this, we engineered TEVp cleavage sites in the I–II and II–III loops of Cav2.1 (this mutant is called Cav2.1_TEVp), and tested the effect of purified recombinant TEVp on Cav2.1_TEVp channels in inside-out membrane macro-patches excised from Xenopus oocytes. Cav2.1 was chosen because its currents run down much slower than Cav1.2 currents do. A 2-min application of TEVp did not abolish channel activity, but did produce an irreversible left shift of the activation curve of Cav2.1_TEVp, but not WT Cav2.1 channels (Figure 5C, bottom). A catalytically inactive TEVp (carrying the C151A mutation) had no effect (Figure 5C, bottom). These results indicate that mid-channel proteolysis alters VGCC gating, leaving a biophysical imprint.
Fourth, we constructed three pairs of complementary Cav1.2 fragment-channels, mimicking mid-channel proteolysis in loop I–II, II–III or III–IV (Figure 6A), and tested their activity in oocytes by two-electrode voltage clamp (TEVC). None of the six recombinant fragment-channels, named A1, A2, B1, B2, C1 and C2, produced currents when individually expressed in oocytes (Figure 6B). However, all three complementary pairs produced sizeable currents, albeit their amplitude was smaller than that of CaV1.2 currents (Figure 6C). Channels formed by all three complementary pairs displayed a right-shifted I–V curve (Figure 6D) and a change in the voltage-dependence of inactivation (Figure 6E). Thus, although individual fragment-channels do not conduct current, when properly paired they can assemble and reach the plasma membrane to form functional channels with distinct biophysical properties. We also examined expression of four non-complementary fragment pairs, A1+C2, A2+B1, A2+C1 and B2+C1, in oocytes. The first three pairs did not produce any currents while the last pair produced a small current (Figure S6B). These results suggest that all four repeats of Cavα1 are needed to form functional channels and that certain non-complementary Cavα1 fragments containing, altogether, more than four repeats may still assemble and form functional channels, albeit poorly.
Figure 6. Functional properties and effects of fragment-channels.

(A) Schematic of three possible cuts (scissors) of Cav1.2 and three pairs of recombinant complementary fragment-channels.
(B and C) Whole-cell currents recorded at −10 mV from oocytes expressing the indicated recombinant fragment-channels (B) or proper pairs (C).
(D and E) Current-voltage relationship (D) and voltage-dependence of inactivation (E) of currents recorded from oocytes expressing the indicated constructs. Standard error is smaller than the symbols (n=6–18).
(F) Whole-cell currents recorded at −10 mV from oocytes expressing full-length Cav1.2, with or without the indicated recombinant fragment-channel coexpressed.
(G–L) Current-voltage (I–V) relationship (G, I, and K) and voltage-dependence of inactivation (H, J, and L) of currents recorded from oocytes expressing the indicated Cav1.2 constructs. Standard error is smaller than the symbols (n=3 for (L) and n=6–14 for other panels). The effect of C2 could not be assessed because the whole-cell current in those experiments was too small to allow accurate measurements (see (F), right-most bar). See also Figure S6B.
Lastly, we examined whether the recombinant fragment-channels change the properties of full-length Cav1.2. Previous studies have shown that coexpression of Cavα1-fragments with full-length Cavα1 often suppresses WT channel currents in a dominant-negative manner and sometimes alters their biophysical properties (Ebihara et al., 2002; Jeng et al., 2008; Mezghrani et al., 2008; Page et al., 2004; Page et al., 2010; Raghib et al., 2001; Raike et al., 2007). We found that fragment C2 greatly dampened Cav1.2 current amplitude while other fragments did not have a significant dominant-negative effect (Figure 6F). Fragments A1 and A2 shifted the Cav1.2 I–V curve to the right (Figure 6G) and increased Cav1.2 inactivation (Figure 6H). Fragments B1 and B2 did not have a significant effect (Figures 6I and 6J). Fragment C1 shifted Cav1.2’s I–V curve to the left (Figure 6K) and markedly increased Cav1.2 inactivation (Figure 6L). Thus, Cav1.2 fragment-channels can have multifaceted effects on full-length Cav1.2 channels.
Mid-channel proteolysis is age-dependent and can be reversed in vivo
Because changes in L-type Ca2+ channel activity have been linked to normal aging (Moyer et al., 1992; Thibault and Landfield, 1996; Thibault et al., 1998), we examined whether mid-channel proteolysis of Cav1.2 is regulated across the life span. Cortical slices were freshly isolated, in strict parallel, from rats of four age groups (10 days, 6 weeks, 6 months and 16 months), and cell-surface Cav1.2 was examined by Western blot (Figure 7A). Mid-channel proteolysis increased steadily and significantly with age, being ~7 times more pronounced in 16-month old rats than in 10-day old rats (Figure 7A). Moreover, the elevated mid-channel proteolysis in the 16-month old rats could be partially reversed by a 3–5 week treatment with verapamil, a L-type VGCC blocker commonly used for hypertension, cardiac arrhythmia, cluster headache and bipolar disorder (Figure 7B), at a dosage equivalent to that used for human patients, adjusted for body weight and metabolic rate.
Figure 7. Mid-channel proteolysis is age-dependent and can be reversed by a L-type VGCC blocker in vivo.

(A) Progressive increase of mid-channel proteolysis with age. Left: representative Western blot with anti-LII–III of native Cav1.2 in surface-biotinylated rat cortical slices from the indicated age groups. Middle: proteolysis index for the representative gel. Right: summary graph showing data pooled from the indicated number of independent experiments. Every independent experiment consisted of parallel dissections of the age groups involved (see Experimental Procedures).
(B) Reduction of mid-channel proteolysis by oral administration of verapamil. Left: representative Western blot with anti-LII–III of native Cav1.2 in surface-biotinylated cortical slices from 16-month old rats fed with water, or water medicated with 12.5 mg per day of verapamil for 3–5 weeks. Middle: proteolysis index for the representative gel. Right: summary graph showing data pooled from five independent experiments. See also Figure S7.
DISCUSSION
We have uncovered a new form of regulation of L-type VGCCs, namely, proteolytic cleavage of the main body of native Cav1.2 channels. Strikingly, cleaved fragment-channels are present on the plasma membrane and can dissociate from each other. This mid-channel proteolysis is not a result of non-specific protein degradation since it is bidirectionally regulated, is inversely correlated with Ca2+ channel activity, and is dependent on age. The finding that mid-channel proteolysis in freshly isolated cortical slices and cultured hippocampal neurons can be reduced by inhibiting L-type Ca2+ channel activity (Figures 1F, 1G, and 4C, 4D) suggests that it is an on-going physiological event occurring in native cells. This finding, together with the observation that mid-channel proteolysis can be enhanced by increased intracellular Ca2+ (Figure 1H and Figure S1A) or increased L-type Ca2+ channel activity (Figures 1I and 4A, 4B) suggests that mid-channel proteolysis is a homeostatic/neuroprotective mechanism to regulate intracellular Ca2+. The dramatic increase of Cav1.2 mid-channel proteolysis with age in vivo is likely a manifestation of such a homeostatic/neuroprotective mechanism: as neurons age, their L-type Ca2+ channel currents increase (Moyer et al., 1992; Thibault and Landfield, 1996; Thibault et al., 1998), leading to an increased intracellular Ca2+ and a compensatory increase of Cav1.2 mid-channel proteolysis.
The conditions shown in this study that enhance Cav1.2 mid-channel proteolysis, such as increased intracellular Ca2+, increased Ca2+ channel activity and increased age, did not change the levels of surface Na+-K+ ATPases and did not increase proteolysis of PARP (Figures S5A–S5D), an apoptotic protein marker whose proteolytic cleavage has been correlated with programmed cell death (Chaitanya et al., 2010), suggesting that mid-channel proteolysis of Cav1.2 is not simply an early step of L-type VGCC degradation, is not due to cell damage, and is not a prelude to cell death. That mid-channel proteolysis is robustly detected in freshly isolated cortical slices and hippocampal neurons (Figures 1–4 and 7), is bidirectionally regulated (Figures 1F–1I and 4A–4D), is strongly linked to aging (Figure 7A), and is reversible in animals by a L-type VGCC blocker (Figure 7B), suggest that mid-channel proteolysis is a physiological mechanism of feedback regulation of L-type VGCCs in intact cells in vivo.
In our imaging experiments, we postulated that the red/green separation is indicative of mid-channel proteolysis of Cav1.2, and that the lateral shifts of the ensemble NCI plots represent changes in mid-channel proteolysis. Is it possible, however, that such shifts are due to changes in the relative expression level of Cav1.2 in the plasma membrane versus intracellular compartments? To examine this possibility, we plotted the ratio of total red over total green (i.e., surface plus intracellular) fluorescence for four drug treatments that produced shifts in the NCI: calpain inhibitors, proteasome inhibitors, 65 mM KCl or 65 mM KCl+BayK, and 65 mM KCl or 65 mM KCl + nifedipine. The exact same neurons used for the NCI plots were used in the total fluorescence plots. In each case, the drug treatment did not significantly change total red/total green fluorescence compared to its untreated control group (Figures S3A, S3B, and S4B, S4C). This analysis is consistent with the notion that NCI shifts reflect a redistribution of red and green in the plasma membrane rather than a change of intracellular GFP.
Mid-channel proteolysis is distinct from the well-studied C-terminal proteolysis (Brawley and Hosey, 1992; De Jongh et al., 1994; De Jongh et al., 1991; Gao et al., 2001; Gerhardstein et al., 2000; Hell et al., 1993; Hulme et al., 2005; Hulme et al., 2006; Lai et al., 1990) in cleavage sites and consequences: the core of Cav1.2 remains intact after C-terminal proteolysis but is split following mid-channel proteolysis. Our biochemical and imaging experiments both suggest that mid-channel proteolysis takes place at several locations of Cav1.2 (Figures 1D, 1E, and 2A, 2F). As a result, Cav1.2 channels on the plasma membrane of native cells may be heterogeneous, with some being full-length Cav1.2 subunits and some being Cav1.2 fragments of various lengths. Our results from recombinant fragment-channels show that they display biophysical properties distinct from full-length channels (Figures 6C–6E). Furthermore, our results show that cleaved Cav1.2 fragments can dissociate from one another (Figures 2B, 2C and 2F), and while these fragments do not form functional channels on their own (Figure 6B), some of them can alter the biophysical properties of full-length channels (Figures 6F–6L). Thus, Cav1.2 currents in native cells could be produced by a highly heterogeneous population of channels. How fragment-channels change full-length Cav1.2 properties is unclear; possibilities include competition for the ancillary subunits (β and/or α2δ) or a direct association with Cav1.2.
VGCCs are regulated by a host of Ca2+-binding proteins and undergo Ca2+-dependent inactivation (CDI) involving calmodulin (Christel and Lee, 2012). Why do neurons need yet another Ca2+-dependent negative feedback mechanism, and one as drastic as mid-channel proteolysis? For neuroprotection, it is not surprising if neurons utilize multiple or even redundant means to diligently control the activity of channels as essential as VGCCs. There may also be significant differences between CDI and mid-channel proteolysis for neurons to exploit. For example, CDI can occur quickly to affect VGCC activity within milliseconds (Tadross et al., 2008, Christel, 2012 #197); mid-channel proteolysis, on the other hand, takes longer and may affect not only VGCC activity but also intracellular Ca2+ homeostasis. Furthermore, while CDI mainly assists VGCC inactivation, the consequences of mid-channel proteolysis can involve Ca2+ current attenuation, channel biophysical property changes, and perhaps putative non-channel functions of the nascent fragments.
It has been shown that Cav1.2 and Cav2.2 undergo ubiquitination and proteasomal degradation, and that these events are regulated by Cavβ (Altier et al., 2011; Waithe et al., 2011). In the absence of Cavβ, Cav1.2 is robustly ubiquitinated and is targeted to the proteasome for degradation; association of Cavβ attenuates Cav1.2 ubiquitination and prevents endoplasmic reticulum (ER)-associated protein degradation (ERAD), leading to an increased surface expression of Cav1.2 (Altier et al., 2011). It is unclear if and how mid-channel proteolysis relates to ERAD, but imaging experiments revealed that separation of proteolytically cleaved Cav1.2 fragments was unaltered by the overexpression of α2δ and β subunits (Figures S2C, S2D), suggesting that either these auxiliary subunits do not affect mid-channel proteolysis, or the channels undergoing mid-channel proteolysis already have associated endogenous α2δ and Cavβ subunits.
Where does Cav1.2 mid-channel proteolysis take place, on the plasma membrane or in an intracellular compartment? Although our results do not provide a definitive answer, they are consistent with the possibility that mid-channel proteolysis occurs on the plasma membrane: (1) Cleaved complementary Cav1.2 fragments are present on the plasma membrane (Figures 1C–1E and Figure 2A). (2) It is not affected by the overexpression of α2δ and β subunits (Figures S2C, S2D). (3) It is dependent on the ubiquitin-proteasome system, being greatly reduced by a cocktail of ubiquitination and proteasome inhibitors or when a putative ubiquitination site on Cav1.2 is mutated (Figures 3C and 3D). (4) It is significantly reduced (Figure 3F) or virtually abolished (Figure 3G) when PEST sequences in Cav1.2 are deleted. PEST sequences serve as signals for rapid proteolysis by yet unknown proteases (with calpain as a candidate) or by proteasomal degradation, presumably by recruiting proper proteases to the target protein or directing the target protein to proteasomes (Rechsteiner and Rogers, 1996). It has been reported that the two PEST sequences in Cav1.2 are involved in Akt-mediated increase of calcium channel currents (Catalucci et al., 2009). Akt is thought to phosphorylate Cavβ2, resulting in the masking of the PEST sequences and, consequently, decreased degradation of surface Cav1.2. Consistent with this notion, deleting each PEST sequence individually increases the stability and current density of Cav1.2 channels expressed in COS-7 or tsA-201 cells (Catalucci et al., 2009). The precise role of the two PEST sequences and why PEST1 is more effective than PEST3 in aiding Cav1.2 mid-channel proteolysis remain to be investigated. These sequences are probably not the cleavage sites themselves. We speculate that PEST1, because of its location and/or conformation in the three-dimensional structure of Cav1.2, is more effective than PEST3 in recruiting calpain to Cav1.2.
Many other questions remain to be elucidated, including the kinetics of mid-channel proteolysis, additional proteases involved, the precise cleavage sites in Cavα1, and the fate and function of the resulting fragment-channels. It will be interesting to examine whether other types of VGCCs and other multi-repeat ion channels such as Na+ channels also undergo mid-channel proteolysis. Truncated forms of Cavα1, generated by either alternative splicing or disease-causing mutations, are naturally present in muscles and neurons (Jeng et al., 2008; Malouf et al., 1992; Mezghrani et al., 2008; Okagaki et al., 2001; Page et al., 2004; Pietrobon, 2010; Scott et al., 1998; Wappl et al., 2002). The fragment-channels produced by regulated mid-channel proteolysis, as well as these short forms of Cavα1, may play important roles in both physiological and pathological conditions.
EXPERIMENTAL PROCEDURES
Constructs
Rat (Rattus norvegicus) brain Cav1.2 was used for transfection in hippocampal neurons. GFP was linked to the N-terminus of Cav1.2 to generate LGN. HA epitopes were cloned on LGN at different extracellular locations to generate GFP- and HA-tagged LGH1, LGH2, and LGH3, in which the HA tag was placed, respectively, between residues T320-G321, Q683-T684, and G1136-P1137. A proteolytic motif (ENLYFQG) for TEVp was introduced on LGH3 between II–III loop residues D815-G816 (LGH3_TEVp). On LGH3_PY/AA, P1364 and Y1365 were each mutated to alanine. Residues 840–861 and 446–459 were deleted to generate LGH3_ΔPEST3 and LGH3_ΔPEST1, respectively. Cav1.2 fragment-channels were engineered to encompass the following channel regions: A1: M1-D449, A2: E450-L2143; B1: M1-S866, B2: M867-L2143; C1: M1-W1216, C2: Y1217-L2143. For oocyte macropatch recordings, rabbit Cav2.1 was used. Cav2.1_TEVp carried the TEVp cutting motif at three different locations: G419-A420 (loop I–II), L1096-S1097 and G1218-P1219 (loop II–III).
Cortical Slice Surface Protein Biotinylation
Neocortical slices (400-μm thick, cut horizontally) were obtained from 6-week old male rat brain and were incubated at 35–37°C in oxygenated artificial cerebrospinal fluid (ACF, in mM: NaCl 119, NaHCO3 26, NaH2PO4 1.25, KCl 2.5, glucose 15, myo-inositol 1, pyruvate 2, ascorbic acid 0.4) for 20–60 min before any pharmacological treatments. For biotinylation of surface proteins, slices were rapidly collected into ice-cold bubbled ACF containing 1mg/ml sulfo-NHS-SS-biotin (Pierce) for 45 min. Quenching solution was added for 5 min. Solubilization, incubation with neutravidin-agarose beads, washing and elution of surface proteins for SDS-PAGE and Western blot, were performed according to Pierce’s instructions, with modifications for neocortical slices described in detail in Supplemental Experimental Procedures.
Cortical Slice Age Comparison
For the aging study of Figure 7A, the procedure described above was upgraded to handle 4 or more animals of different ages in strict parallel, as described in detail in Supplemental Experimental Procedures.
Verapamil Feeding of Aged Animals
Verapamil was used to medicate the drinking water of aged rats, at 12.5 mg per diem, for 3 to 5 weeks. Dosage calculation and details of verapamil administration are explained in Supplemental Experimental Procedures.
Hippocampal Neuron Culture, Transfection and Surface Biotinylation
Embryonic hippocampi were isolated and primary cultures were grown using standard procedures (Blanpied et al., 2002). 24 h after plating and then every 4 days, neurobasal medium containing B-27 and I-glutamax (Invitrogen) was used to replace 50% of the culture medium. Neurons were kept at 37°C in a 5% CO2 humid atmosphere. Hippocampal neurons DIV10-13 were transfected with an optimized method using Lipofectamine 2000 (Invitrogen). 1.5 μg of DNA in 100 μl Opti-MEM (Invitrogen) were used to transfect each 12 mm (diameter) coverslip. Surface biotinylation was similar to that described for cortical slices.
Hippocampal Neuron Immunofluorescence and Imaging
Hippocampal neurons were fixed with 2% paraformaldehyde and immunostained 24–48 h post-transfection. To visualize surface HA tags, neurons were incubated with a mouse monoclonal anti-HA (Covance) for 1 h in PBS containing 0.5% fish gelatin and 10% goat serum, then washed with PBS 4 times. The goat anti-mouse secondary antibody conjugated with the Alexa594 fluorophore (Invitrogen) was added to the neurons for 1 h in the same buffer composition. The stained coverslips were washed and mounted on imaging slides using an anti-fade reagent (Biomeda). All procedures were done at room temperature.
Confocal imaging was performed using a spinning disc microscope. Optical slice thickness was 300 nm. Confocal images for each fluorophore in multi-labeling experiments were acquired separately (sequential scans). Images were analyzed using Volocity (PerkinElmer) and MatLab.
Imaging Data Quantification and Histogram Construction
A software routine was created to scan optical sections of dendrites and automatically select the red objects, which presumably represent surface CaV1.2. These objects vary in size and are divided into a volume unit called voxel, which has a dimension of 0.211x0.211x0.211μm and a volume of 0.00944 μm3. Typically, ~10,000–15,000 voxels were generated for each neuron. The red and green intensity was measured for each voxel and the red/green ratio (i.e., non-colocalization index or NCI) was determined. The NCI of all the voxels was binned and plotted in a frequency (ordinate, Y-axis) vs. NCI (abscissa, X-axis) graph. This resulting distribution (curve) shows the percentage of voxels that exhibit NCI above a threshold value.
In ensemble %Frequency-above-threshold vs. NCI curves using data pooled from multiple neurons, the X-axis consisted of step thresholds used to bin the entire population of NCI values. Typically, a group of ~15 neurons produced ~150,000–200,000 voxels. X-axis thresholds were a sequence of logarithmically spaced numbers generated by MatLab to represent values between 0.1 and 10 (listed in Supplemental Experimental Proceudures). Y-axis data points from all the neurons in any given group were averaged and plotted.
Xenopus Oocyte Preparation, Injection and Surface Biotinylation
Female oocyte-positive Xenopus laevis (African clawed) frogs were purchased from Xenopus I, Xenopus Express or Nasco, and stage V–VI oocytes were isolated. Briefly, frogs were anesthetized in a 0.3% tricaine solution. Ovarian lobes were excised in OR2 (Ca2+-free) solution (mM: NaCl 82.4, KCl 2.5, MgCl2 1, HEPES 5) and digested in OR2 supplemented with collagenase A (0.2–0.5 mg/ml, Roche) for 2–3 h at room temperature. Oocytes were washed and recovered in ND96 solution (mM: NaCl 96, KCl 2.5, MgCl2 1, HEPES 5, CaCl2 1.8, supplemented with penicillin/streptomycin). mRNA injection and oocyte surface biotinylation protocol are presented in detail in Supplemental Experimental Procedures.
Electrophysiology
For whole-cell recording of hippocampal neurons, the pipette solution contained (in mM): CsCl 122, HEPES 10, EGTA 10, MgCl2 5, MgATP 4 and GTP 0.4, pH 7.2 with CsOH. Recording electrodes had resistances of 2–4 MΩ. The bath solution contained (in mM): NaCl 115, TEA·OH 20, KCl 5, MgCl2 2, BaCl2 5, HEPES 10, D-glucose 10, pH 7.4 with NaOH. 1 μM TTX was added before recordings.
For two-electrode voltage-clamp recording of oocytes, the bath solution contained (in mM): BaCl2 10, KCl 5, tetraethyl ammonium hydroxide 60, NaOH 20, HEPES 5 (pH 7.4 adjusted with methanesulfonic acid).
For inside-out macropatch recordings from oocytes, Cav2.1 (P/Q-type) channels were used because of their slower rundown (Zhen et al., 2006). Electrodes had a diameter of 15–30 μm and a resistance of 0.2–0.4 MΩ when filled with a solution containing (in mM): BaCl2 45, KCl 80, HEPES 10, pH 7.3 with KOH. The bath solution contained (in mM): CsCl 125, NaCl 4, HEPES 10, EGTA 10, pH 7.3 with KOH. The purified WT or mutant TEV proteases were perfused in the bath solution for 2 min, followed by 1 min of wash.
Data were analyzed with Clampfit. All experiments were performed at 22–23°C.
Western Immunoblotting
Protein samples were run in 8% acrylamide (BioRad) gels or 4–12% precast gradient gels (Invitrogen). Electrical transfer to PVDF membranes (BioRad) was performed in a standard 25 mM Tris, 192 mM glycine, pH~8.3 buffer supplemented with 0.002% SDS for 90 min at 90 V, at 4°C. Membranes were handled in PBS containing 0.2% Tween-20 (PBST). Blocking buffer was 10% newborn calf serum (NCS, Gibco) plus 1% fish gelatin (Sigma) in PBST. Primary antibodies were used at 1:750–1:1000 dilutions, and were purchased from Sigma (anti-LII–III and anti-Nt), Cell Signaling (anti-PARP), and Abcam (anti-Na+/K+-ATPase). Anti-Ct, generated against residues 2155–2171 of the rabbit cardiac Cav1.2 (Hulme et al., 2006), was a courteous gift from Drs. W.A. Catterall and R. Westenbroek (University of Washington, Seattle). Secondary antibody (goat anti-rabbit, HRP-conjugated, SantaCruz Biotechnologies) was used at 1:2000 dilution. Protein bands were visualized using enhanced chemiluminescence reagents (Pierce) on X-ray film (Kodak). For stripping and reprobing of PVDF membranes, the stripping buffer was 100 mM β-mercaptoethanol, 2% SDS, 62.5 mM Tris-HCl, pH 6.8. Coomassie Blue staining was performed using Biosafe Coomassie (BioRad) according to the manufacturer’s instructions, or using a stain consisting of 0.1% Coomassie Brilliant Blue R-250 in 40% MeOH and 1% acetic acid.
Purification of Tobacco etch virus protease
For protein synthesis in E. coli, DE3 bacteria were used for cDNA transformation and protein expression. The expressed recombinant tobacco etch virus protease (TEVp, Addgene Plasmid 8827: pRK793) construct contained an MBP molecule for enhanced expression, a TEVp self-cleavage recognition site (ENLYFQG), a His-tag, and finally TEVp itself. Ultimately, TEVp was isolated from transformed DE3 bacteria using a nickel-bead column system as described in Supplemental Experimental Procedures. Western blot with an antibody against TEVp (courtesy of Dr. Michael Ehrmann at University of Duisburg-Essen, Germany) revealed that the purified TEVp had the expected molecular mass of TEVp plus the His tag (27 kDa), indicating that the tagged MBP molecule had been removed from the parent construct by TEVp self-cleavage (Figure S6A). In contrast, the molecular mass of the purified C151A mutant protease was significantly higher (70 kDa) than that of WT TEVp (Figure S6A), as expected for the original MBP-tagged parent construct, confirming the loss of catalytic activity caused by the C151A mutation.
Statistics
Data are represented as mean±s.e.m. and asterisks denote statistical differences throughout. For all statistical tests used and their resulting p-values, see Supplemental Experimental Procedures.
Supplementary Material
HIGHLIGHTS.
The core of L-type VGCC pore-forming subunit Cav1.2 undergoes regulated cleavage
Cleaved Cav1.2 fragments stay on the plasma membrane but can dissociate
Aging, channel activity, calpain and PEST sequences play a role in Cav1.2 proteolysis
Cav1.2 core cleavage greatly changes L-type VGCC properties and currents
Acknowledgments
We thank Drs. William Catterall and Ruth Westenbroek of University of Washington for the anti-Ct antibody, Dr. Michael Ehrmann of University of Duisburg-Essen for the anti-TEVp antibody, Glynis Gordon and Rachel Schenkel for technical assistance, and Dr. Zafir Buraei of Pace University and members of Yang laboratory for commenting on the manuscript. This work was supported by National Institutes of Health Grants NS053494 and NS045383 (to J.Y), the Established Investigator Award of the American Heart Association (to J.Y), the Top Talents Program of Yunnan Province, China (to J.Y), and a Postdoctoral Fellowship (0625908T) from the American Heart Association (to I.E.M).
References
- Altier C, Garcia-Caballero A, Simms B, You H, Chen L, Walcher J, Tedford HW, Hermosilla T, Zamponi GW. The Cavβ subunit prevents RFP2-mediated ubiquitination and proteasomal degradation of L-type channels. Nat Neurosci. 2011;14:173–180. doi: 10.1038/nn.2712. [DOI] [PubMed] [Google Scholar]
- Blanpied TA, Scott DB, Ehlers MD. Dynamics and regulation of clathrin coats at specialized endocytic zones of dendrites and spines. Neuron. 2002;36:435–449. doi: 10.1016/s0896-6273(02)00979-0. [DOI] [PubMed] [Google Scholar]
- Brawley RM, Hosey MM. Identification of two distinct proteins that are immunologically related to the α1 subunit of the skeletal muscle dihydropyridine-sensitive calcium channel. J Biol Chem. 1992;267:18218–18223. [PubMed] [Google Scholar]
- Cain SM, Snutch TP. Voltage-gated calcium channels and disease. Biofactors. 2011;37:197–205. doi: 10.1002/biof.158. [DOI] [PubMed] [Google Scholar]
- Catalucci D, Zhang DH, DeSantiago J, Aimond F, Barbara G, Chemin J, Bonci D, Picht E, Rusconi F, Dalton ND, et al. Akt regulates L-type Ca2+ channel activity by modulating Cavα1 protein stability. J Cell Biol. 2009;184:923–933. doi: 10.1083/jcb.200805063. [DOI] [PMC free article] [PubMed] [Google Scholar]
- Catterall WA. Structure and regulation of voltage-gated Ca2+ channels. Annu Rev Cell Dev Biol. 2000;16:521–555. doi: 10.1146/annurev.cellbio.16.1.521. [DOI] [PubMed] [Google Scholar]
- Chaitanya GV, Steven AJ, Babu PP. PARP-1 cleavage fragments: signatures of cell-death proteases in neurodegeneration. Cell Commun Signal. 2010;8:31. doi: 10.1186/1478-811X-8-31. [DOI] [PMC free article] [PubMed] [Google Scholar]
- Christel C, Lee A. Ca2+-dependent modulation of voltage-gated Ca2+ channels. Biochim Biophys Acta. 2012;1820:1243–1252. doi: 10.1016/j.bbagen.2011.12.012. [DOI] [PMC free article] [PubMed] [Google Scholar]
- De Jongh KS, Colvin AA, Wang KK, Catterall WA. Differential proteolysis of the full-length form of the L-type calcium channel α1 subunit by calpain. J Neurochem. 1994;63:1558–1564. doi: 10.1046/j.1471-4159.1994.63041558.x. [DOI] [PubMed] [Google Scholar]
- De Jongh KS, Warner C, Colvin AA, Catterall WA. Characterization of the two size forms of the α1 subunit of skeletal muscle L-type calcium channels. Proc Natl Acad Sci U S A. 1991;88:10778–10782. doi: 10.1073/pnas.88.23.10778. [DOI] [PMC free article] [PubMed] [Google Scholar]
- Deisseroth K, Mermelstein PG, Xia H, Tsien RW. Signaling from synapse to nucleus: the logic behind the mechanisms. Curr Opin Neurobiol. 2003;13:354–365. doi: 10.1016/s0959-4388(03)00076-x. [DOI] [PubMed] [Google Scholar]
- Di Biase V, Tuluc P, Campiglio M, Obermair GJ, Heine M, Flucher BE. Surface traffic of dendritic CaV1.2 calcium channels in hippocampal neurons. J Neurosci. 2011;31:13682–13694. doi: 10.1523/JNEUROSCI.2300-11.2011. [DOI] [PMC free article] [PubMed] [Google Scholar]
- Dolmetsch R. Excitation-transcription coupling: signaling by ion channels to the nucleus. Sci STKE. 2003:PE4. doi: 10.1126/stke.2003.166.pe4. [DOI] [PubMed] [Google Scholar]
- Ebihara T, Komiya Y, Izumi-Nakaseko H, Adachi-Akahane S, Okabe S, Okamura Y. Coexpression of a Cav1.2 protein lacking an N-terminus and the first domain specifically suppresses L-type calcium channel activity. FEBS Lett. 2002;529:203–207. doi: 10.1016/s0014-5793(02)03340-9. [DOI] [PubMed] [Google Scholar]
- Fuller MD, Emrick MA, Sadilek M, Scheuer T, Catterall WA. Molecular mechanism of calcium channel regulation in the fight-or-flight response. Sci Signal. 2010;3:ra70. doi: 10.1126/scisignal.2001152. [DOI] [PMC free article] [PubMed] [Google Scholar]
- Gao T, Cuadra AE, Ma H, Bunemann M, Gerhardstein BL, Cheng T, Eick RT, Hosey MM. C-terminal fragments of the α1C (CaV1.2) subunit associate with and regulate L-type calcium channels containing C-terminal-truncated α1C subunits. J Biol Chem. 2001;276:21089–21097. doi: 10.1074/jbc.M008000200. [DOI] [PubMed] [Google Scholar]
- Gerhardstein BL, Gao T, Bunemann M, Puri TS, Adair A, Ma H, Hosey MM. Proteolytic processing of the C terminus of the α1C subunit of L-type calcium channels and the role of a proline-rich domain in membrane tethering of proteolytic fragments. J Biol Chem. 2000;275:8556–8563. doi: 10.1074/jbc.275.12.8556. [DOI] [PubMed] [Google Scholar]
- Hell JW, Westenbroek RE, Breeze LJ, Wang KK, Chavkin C, Catterall WA. N-methyl-D-aspartate receptor-induced proteolytic conversion of postsynaptic class C L-type calcium channels in hippocampal neurons. Proc Natl Acad Sci U S A. 1996;93:3362–3367. doi: 10.1073/pnas.93.8.3362. [DOI] [PMC free article] [PubMed] [Google Scholar]
- Hell JW, Yokoyama CT, Wong ST, Warner C, Snutch TP, Catterall WA. Differential phosphorylation of two size forms of the neuronal class C L-type calcium channel α1 subunit. J Biol Chem. 1993;268:19451–19457. [PubMed] [Google Scholar]
- Hulme JT, Konoki K, Lin TW, Gritsenko MA, Camp DG, 2nd, Bigelow DJ, Catterall WA. Sites of proteolytic processing and noncovalent association of the distal C-terminal domain of CaV1.1 channels in skeletal muscle. Proc Natl Acad Sci U S A. 2005;102:5274–5279. doi: 10.1073/pnas.0409885102. [DOI] [PMC free article] [PubMed] [Google Scholar]
- Hulme JT, Yarov-Yarovoy V, Lin TW, Scheuer T, Catterall WA. Autoinhibitory control of the CaV1.2 channel by its proteolytically processed distal C-terminal domain. J Physiol. 2006;576:87–102. doi: 10.1113/jphysiol.2006.111799. [DOI] [PMC free article] [PubMed] [Google Scholar]
- Jeng CJ, Sun MC, Chen YW, Tang CY. Dominant-negative effects of episodic ataxia type 2 mutations involve disruption of membrane trafficking of human P/Q-type Ca2+ channels. J Cell Physiol. 2008;214:422–433. doi: 10.1002/jcp.21216. [DOI] [PubMed] [Google Scholar]
- Kordasiewicz HB, Thompson RM, Clark HB, Gomez CM. C-termini of P/Q-type Ca2+ channel α1A subunits translocate to nuclei and promote polyglutamine-mediated toxicity. Hum Mol Genet. 2006;15:1587–1599. doi: 10.1093/hmg/ddl080. [DOI] [PubMed] [Google Scholar]
- Lai Y, Seagar MJ, Takahashi M, Catterall WA. Cyclic AMP-dependent phosphorylation of two size forms of α1 subunits of L-type calcium channels in rat skeletal muscle cells. J Biol Chem. 1990;265:20839–20848. [PubMed] [Google Scholar]
- Leenders AG, Lin L, Huang LD, Gerwin C, Lu PH, Sheng ZH. The role of MAP1A light chain 2 in synaptic surface retention of Cav2.2 channels in hippocampal neurons. J Neurosci. 2008;28:11333–11346. doi: 10.1523/JNEUROSCI.3078-08.2008. [DOI] [PMC free article] [PubMed] [Google Scholar]
- Leenders AG, van den Maagdenberg AM, Lopes da Silva FH, Sheng ZH, Molenaar PC, Ghijsen WE. Neurotransmitter release from tottering mice nerve terminals with reduced expression of mutated P- and Q-type Ca2+-channels. Eur J Neurosci. 2002;15:13–18. doi: 10.1046/j.0953-816x.2001.01839.x. [DOI] [PubMed] [Google Scholar]
- Liao P, Soong TW. CaV1.2 channelopathies: from arrhythmias to autism, bipolar disorder, and immunodeficiency. Pflugers Arch. 2010;460:353–359. doi: 10.1007/s00424-009-0753-0. [DOI] [PubMed] [Google Scholar]
- Malouf NN, McMahon DK, Hainsworth CN, Kay BK. A two-motif isoform of the major calcium channel subunit in skeletal muscle. Neuron. 1992;8:899–906. doi: 10.1016/0896-6273(92)90204-q. [DOI] [PubMed] [Google Scholar]
- Mezghrani A, Monteil A, Watschinger K, Sinnegger-Brauns MJ, Barrere C, Bourinet E, Nargeot J, Striessnig J, Lory P. A destructive interaction mechanism accounts for dominant-negative effects of misfolded mutants of voltage-gated calcium channels. J Neurosci. 2008;28:4501–4511. doi: 10.1523/JNEUROSCI.2844-07.2008. [DOI] [PMC free article] [PubMed] [Google Scholar]
- Moyer JR, Jr, Thompson LT, Black JP, Disterhoft JF. Nimodipine increases excitability of rabbit CA1 pyramidal neurons in an age- and concentration-dependent manner. J Neurophysiol. 1992;68:2100–2109. doi: 10.1152/jn.1992.68.6.2100. [DOI] [PubMed] [Google Scholar]
- Okagaki R, Izumi H, Okada T, Nagahora H, Nakajo K, Okamura Y. The maternal transcript for truncated voltage-dependent Ca2+ channels in the ascidian embryo: a potential suppressive role in Ca2+ channel expression. Dev Biol. 2001;230:258–277. doi: 10.1006/dbio.2000.0119. [DOI] [PubMed] [Google Scholar]
- Page KM, Heblich F, Davies A, Butcher AJ, Leroy J, Bertaso F, Pratt WS, Dolphin AC. Dominant-negative calcium channel suppression by truncated constructs involves a kinase implicated in the unfolded protein response. J Neurosci. 2004;24:5400–5409. doi: 10.1523/JNEUROSCI.0553-04.2004. [DOI] [PMC free article] [PubMed] [Google Scholar]
- Page KM, Heblich F, Margas W, Pratt WS, Nieto-Rostro M, Chaggar K, Sandhu K, Davies A, Dolphin AC. N terminus is key to the dominant negative suppression of CaV2 calcium channels: implications for episodic ataxia type 2. J Biol Chem. 2010;285:835–844. doi: 10.1074/jbc.M109.065045. [DOI] [PMC free article] [PubMed] [Google Scholar]
- Pietrobon D. CaV2.1 channelopathies. Pflugers Arch. 2010;460:375–393. doi: 10.1007/s00424-010-0802-8. [DOI] [PubMed] [Google Scholar]
- Raghib A, Bertaso F, Davies A, Page KM, Meir A, Bogdanov Y, Dolphin AC. Dominant-negative synthesis suppression of voltage-gated calcium channel Cav2.2 induced by truncated constructs. J Neurosci. 2001;21:8495–8504. doi: 10.1523/JNEUROSCI.21-21-08495.2001. [DOI] [PMC free article] [PubMed] [Google Scholar]
- Raike RS, Kordasiewicz HB, Thompson RM, Gomez CM. Dominant-negative suppression of Cav2.1 currents by α12.1 truncations requires the conserved interaction domain for β subunits. Mol Cell Neurosci. 2007;34:168–177. doi: 10.1016/j.mcn.2006.10.011. [DOI] [PMC free article] [PubMed] [Google Scholar]
- Ramakrishnan NA, Drescher MJ, Sheikhali SA, Khan KM, Hatfield JS, Dickson MJ, Drescher DG. Molecular identification of an N-type Ca2+ channel in saccular hair cells. Neuroscience. 2006;139:1417–1434. doi: 10.1016/j.neuroscience.2006.01.064. [DOI] [PubMed] [Google Scholar]
- Rechsteiner M, Rogers SW. PEST sequences and regulation by proteolysis. Trends Biochem Sci. 1996;21:267–271. [PubMed] [Google Scholar]
- Sakurai T, Hell JW, Woppmann A, Miljanich GP, Catterall WA. Immunochemical identification and differential phosphorylation of alternatively spliced forms of the α1A subunit of brain calcium channels. J Biol Chem. 1995;270:21234–21242. doi: 10.1074/jbc.270.36.21234. [DOI] [PubMed] [Google Scholar]
- Schiff ML, Siderovski DP, Jordan JD, Brothers G, Snow B, De Vries L, Ortiz DF, Diverse-Pierluissi M. Tyrosine-kinase-dependent recruitment of RGS12 to the N-type calcium channel. Nature. 2000;408:723–727. doi: 10.1038/35047093. [DOI] [PubMed] [Google Scholar]
- Scott VE, Felix R, Arikkath J, Campbell KP. Evidence for a 95 kDa short form of the α1A subunit associated with the ω-conotoxin MVIIC receptor of the P/Q-type Ca2+ channels. J Neurosci. 1998;18:641–647. doi: 10.1523/JNEUROSCI.18-02-00641.1998. [DOI] [PMC free article] [PubMed] [Google Scholar]
- Smoller JW, Craddock N, Kendler K, Lee PH, Neale BM, Nurnberger JI, Ripke S, Santangelo S, Sullivan PF. Identification of risk loci with shared effects on five major psychiatric disorders: a genome-wide analysis. Lancet. 2013;381:1371–1379. doi: 10.1016/S0140-6736(12)62129-1. [DOI] [PMC free article] [PubMed] [Google Scholar]
- Striessnig J, Bolz HJ, Koschak A. Channelopathies in Cav1.1, Cav1.3, and Cav1.4 voltage-gated L-type Ca2+ channels. Pflugers Arch. 2010;460:361–374. doi: 10.1007/s00424-010-0800-x. [DOI] [PMC free article] [PubMed] [Google Scholar]
- Tadross MR, Dick IE, Yue DT. Mechanism of local and global Ca2+ sensing by calmodulin in complex with a Ca2+ channel. Cell. 2008;133:1228–1240. doi: 10.1016/j.cell.2008.05.025. [DOI] [PMC free article] [PubMed] [Google Scholar]
- Thibault O, Landfield PW. Increase in single L-type calcium channels in hippocampal neurons during aging. Science. 1996;272:1017–1020. doi: 10.1126/science.272.5264.1017. [DOI] [PubMed] [Google Scholar]
- Thibault O, Porter NM, Chen KC, Blalock EM, Kaminker PG, Clodfelter GV, Brewer LD, Landfield PW. Calcium dysregulation in neuronal aging and Alzheimer’s disease: history and new directions. Cell Calcium. 1998;24:417–433. doi: 10.1016/s0143-4160(98)90064-1. [DOI] [PubMed] [Google Scholar]
- Waithe D, Ferron L, Page KM, Chaggar K, Dolphin AC. β-Subunits promote the expression of CaV2.2 channels by reducing their proteasomal degradation. J Biol Chem. 2011;286:9598–9611. doi: 10.1074/jbc.M110.195909. [DOI] [PMC free article] [PubMed] [Google Scholar]
- Wappl E, Koschak A, Poteser M, Sinnegger MJ, Walter D, Eberhart A, Groschner K, Glossmann H, Kraus RL, Grabner M, et al. Functional consequences of P/Q-type Ca2+ channel Cav2.1 missense mutations associated with episodic ataxia type 2 and progressive ataxia. J Biol Chem. 2002;277:6960–6966. doi: 10.1074/jbc.M110948200. [DOI] [PubMed] [Google Scholar]
- Westenbroek RE, Sakurai T, Elliott EM, Hell JW, Starr TV, Snutch TP, Catterall WA. Immunochemical identification and subcellular distribution of the α 1A subunits of brain calcium channels. J Neurosci. 1995;15:6403–6418. doi: 10.1523/JNEUROSCI.15-10-06403.1995. [DOI] [PMC free article] [PubMed] [Google Scholar]
- Wheeler DG, Groth RD, Ma H, Barrett CF, Owen SF, Safa P, Tsien RW. CaV1 and CaV2 channels engage distinct modes of Ca2+ signaling to control CREB-dependent gene expression. Cell. 2012;149:1112–1124. doi: 10.1016/j.cell.2012.03.041. [DOI] [PMC free article] [PubMed] [Google Scholar]
- Woppmann A, Ramachandran J, Miljanich GP. Calcium channel subtypes in rat brain: biochemical characterization of the high-affinity receptors for ω-conopeptides SNX-230 (synthetic MVIIC), SNX-183 (SVIB), and SNX-111 (MVIIA) Mol Cell Neurosci. 1994;5:350–357. doi: 10.1006/mcne.1994.1042. [DOI] [PubMed] [Google Scholar]
- Zamponi GW, Currie KP. Regulation of CaV2 calcium channels by G protein coupled receptors. Biochim Biophys Acta. 2013;1828:1629–1643. doi: 10.1016/j.bbamem.2012.10.004. [DOI] [PMC free article] [PubMed] [Google Scholar]
- Zamponi GW, Lory P, Perez-Reyes E. Role of voltage-gated calcium channels in epilepsy. Pflugers Arch. 2010;460:395–403. doi: 10.1007/s00424-009-0772-x. [DOI] [PMC free article] [PubMed] [Google Scholar]
- Zhen XG, Xie C, Yamada Y, Zhang Y, Doyle C, Yang J. A single amino acid mutation attenuates rundown of voltage-gated calcium channels. FEBS Lett. 2006;580:5733–5738. doi: 10.1016/j.febslet.2006.09.027. [DOI] [PMC free article] [PubMed] [Google Scholar]
Associated Data
This section collects any data citations, data availability statements, or supplementary materials included in this article.