

Abstract
Transmural heterogeneities in Na/K pump current (IP), transient outward K+-current (Ito), and Ca2+-current (ICaL) play an important role in regulating electrical and contractile activities in the ventricular myocardium. Prior studies indicated angiotensin II (A2) may determine the transmural gradient in Ito, but the effects of A2 on IP and ICaL were unknown. In this study, myocytes were isolated from five muscle layers between epicardium and endocardium. We found a monotonic gradient in both Ip and Ito, with the lowest currents in ENDO. When AT1Rs were inhibited, EPI currents were unaffected, but ENDO currents increased, suggesting endogenous extracellular A2 inhibits both currents in ENDO. IP- and Ito-inhibition by A2 yielded essentially the same K0.5 values, so they may both be regulated by the same mechanism. A2/AT1R-mediated inhibition of IP or Ito or stimulation of ICaL persisted for hours in isolated myocytes, suggesting continuous autocrine secretion of A2 into a restricted diffusion compartment, like the T-system. Detubulation brought EPI IP to its low ENDO value and eliminated A2 sensitivity, so the T-system lumen may indeed be the restricted diffusion compartment. These studies showed that 33–50% of IP, 57–65% of Ito, and a significant fraction of ICaL reside in T-tubule membranes where they are transmurally regulated by autocrine secretion of A2 into the T-system lumen and activation of AT1Rs. Increased AT1R activation regulates each of these currents in a direction expected to increase contractility. Endogenous A2 activation of AT1Rs increases monotonically from EPI to ENDO in a manner similar to reported increases in passive tension when the ventricular chamber fills with blood. We therefore hypothesize load is the signal that regulates A2-activation of AT1Rs, which create a contractile gradient that matches the gradient in load.
Introduction
Regional heterogeneities in action potential morphology in canine left ventricle have been reported for decades (reviewed in Di Diego et al. (1)). These differences are due to transmural differences in functional expression of multiple membrane currents including the transient outward potassium current (Ito) (2–4), L-type calcium current (ICa,L) (5), and Na/K ATPase pump current (IP) (6). Moreover, previous studies (4) have shown Ito can be modulated by extracellular angiotensin II (A2). But despite decades of work, regional heterogeneities are incompletely understood. In this article, we build upon previous work and provide new data suggesting overall hypotheses on why these regional heterogeneities exist and how they are established.
As shown in the Results, Ito, IP, and ICaL appear to be regulated in a sustained manner by A2. A2 is the primary effector of the renin-angiotensin system (RAS) and has been most extensively studied in the vasculature, where it is a vasoconstrictor. A2 is known to be produced by and secreted from the kidneys (reviewed in Zhuo et al. (7)). However, there is also a local RAS in cardiac tissue (8), and autocrine A2 activation of angiotensin II type 1 receptors (AT1Rs) induces cardiac hypertrophy (9). Thus, A2 not only regulates systemic pressure, but also contributes to the regulation of ventricular chamber pressure via structural remodeling (reviewed in Lijnen and Petrov (10)).
The AT1R is a member of the family of seven trans-membrane, G-protein-coupled receptors (11). Binding of A2 to AT1Rs activates receptor signaling in two sequential phases. During the first phase, the heterotrimeric G-proteins Gq and Gi are activated. Their signaling cascades activate phosphokinase C, and inhibit phosphokinase A and phosphoinositide 3 kinase (PI3K). However, these responses are active for just a few minutes (11) and are therefore not relevant to the chronic A2 effects we have studied in isolated canine myocytes. During the second phase of signaling, G-protein-coupled receptor kinases (reviewed in Penela et al. (12)) phosphorylate the activated AT1Rs, which then bind with β-Arrestins, ending the G-protein-mediated signaling phase. The β-Arrestins bring the receptor to clathrin-coated pits for endocytosis (reviewed in DeWire et al. (13)). In the case of the AT1R, the interaction with β-Arrestins is strong and internalization is relatively long in duration. The β-Arrestins act as signal transduction scaffolds for internalized AT1R/β-Arrestin complexes. In heart muscle, this scaffold is known to bind directly with Akt and its phosphatase PP2A, Raf-1, and extracellular signal-related kinase ERK1/2, and indirectly with MEK1. Thus, a number of pathways could potentially be activated once the receptor is internalized.
Autocrine secretion of A2 by cardiac myocytes has been shown to increase in response to myocardial stretch (9). Moreover, in the canine left ventricle, there is a transmural gradient in both diastolic stretch and systolic contraction (14–16), with the greatest stretch and contraction in ENDO. Lastly, as described in the Discussion, the currents studied here (ICaL, Ito, and IP) all affect contraction. These observations suggest that a transmural gradient in autocrine A2 secretion may be generated by the transmural gradient in stretch during chamber filling. Further, the gradient in A2 may generate transmural gradients in ICaL, Ito, and IP, which create the gradient in contraction. One test of this hypothesis is to determine whether the transmural gradient in AT1R activation correlates with the transmural gradient in stretch. Another test is to determine whether A2/AT1R values coherently regulate ICaL, Ito, and IP in a manner to create the observed transmural gradient in contraction. The main purpose of this study was to investigate the transmural effects of A2/AT1Rs on IP, Ito, and ICaL. However, there was also a longstanding puzzle that needed to be understood if our data were to be taken seriously.
The results presented here, as well as in earlier publications, indicate that A2 effects in the heart are through extracellular binding to its receptor. The source of A2 appears to be autocrine secretion. The puzzle was that while extracellular A2 would rapidly diffuse away from isolated myocytes, we also observed A2 effects that persist for many hours after myocyte isolation. This contradiction could be resolved if A2 is continuously secreted into a diffusionally restricted compartment, such as the lumen of the transverse tubular system (T-system). We provide both experimental data and theoretical calculations that support the idea of persistent autocrine A2 secretion into the T-system lumen, where it regulates ICaL, Ito, and IP in T-system membranes.
Methods
Canine left ventricular myocyte isolation
Myocytes were acutely isolated from the left ventricle of adult mongrel dogs. A modified Langendorf procedure was used, in which a wedge of left ventricle was perfused through a coronary artery with 0.5 mg/mL collagenase (Type 2 collagenase; Worthington Biochemical, Lakewood Township, NJ) and 0.08 mg/mL protease (Type XVI protease; Sigma, St. Louis, MO). Perfusion lasted for 12–15 min followed by tissue mincing (6,17). In most experiments, cells were obtained from five distinct transmural layers (EPI, EPI-MID, CENTER-MID, ENDO-MID, and ENDO), to expand upon a previous study (6). Cell groups from each layer were separately stored at room temperature (22–25°C) in KB (Kraft Brühe) solution containing 83 mM KCl, 30 mM K2HPO4, 5 mM MgSO4, 5 mM Na-pyruvic acid, 5 mM β-OH-butyric acid, 5 mM creatine, 20 mM taurine, 10 mM glucose, 0.5 mM EGTA, 2 mM KOH, and 5 mM Na2-ATP (pH = 7.2). Cells were kept in KB solution for the duration of the experiments, which lasted up to 24 h postisolation. For the in situ delivery of A2 study shown in Fig. S4 of the Supporting Material, 5 μM A2 was delivered at 37°C through the coronary artery for 1 h before collagenase/protease digestion; cells were studied immediately after digestion.
Cell preparation
Some cell groups were incubated in KB solution at room temperature in the presence of either A2 (10 nM to 5 μM) or the AT1R inhibitor saralasin (2 μM) and compared with untreated control groups. Incubations with A2 or saralasin lasted 2–24 h.
Cell detubulation
Cells were detubulated with the following procedure: After 1 h of incubation in KB solution, cells were transferred to a detubulation solution containing 113 mM NaCl, 5 mM KCl, 1 mM MgSO4, 1 mM Na2HPO4, 20 mM Na-Acetate, 10 mM glucose, and 10 mM HEPES (pH = 7.4 adjusted with NaOH). Then, detubulation was induced by osmotic shock as described by Brette et al. (18). In brief, cells were first exposed to detubulation solution containing 1.5 M formamide for 15–20 min. Detubulation was induced by osmotic shock when cells were returned to detubulation solution without formamide. After another 10–15 min in detubulation solution, cells were transferred to KB solution before experimentation.
Electrophysiological recordings
IP and Ito were measured using the whole-cell patch-clamp technique at room temperature. For IP recordings, the internal pipette solution contained 70 mM Na-aspartic acid, 20 mM K-aspartic acid, 30 mM CsOH, 20 mM TEA Cl (tetraethylammonium chloride), 7 mM MgSO4, 5 mM HEPES, 11 mM EGTA, 1 mM CaCl2, 10 mM glucose, and 5 mM Na2-ATP (pH = 7.2 adjusted with CsOH). Pipette resistances were 2–3 MΩ before sealing. During patch-clamp recording, cells were perfused with an external solution containing 137.7 mM NaCl, 2.3 mM NaOH, 1 mM MgCl2, 5.4 mM KCl, 10 mM glucose, 5 mM HEPES, 2 mM BaCl2, and 1 mM CdCl2 (pH = 7.4 adjusted with NaOH). In whole-cell mode, cells were held at 0 mV and IP was measured as the drop in whole-cell current upon introduction of a saturating concentration of strophanthidin (0.5 mM) into the external solution (Fig. 1 A).
Figure 1.
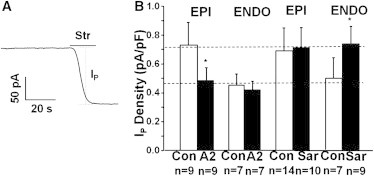
A transmural gradient in the Na/K ATPase current IP due to AT1R receptor activation. (A) Representative trace of IP from a whole-cell patch-clamp recording. Strophanthidin (Str), a specific inhibitor of the Na/K ATPase, was used to block and quantify IP. (B) Application of 5 μM A2 made IP the same everywhere at the low ENDO level (lower dashed line), whereas Sar, an inhibitor of the AT1R, made IP the same everywhere at its high EPI level (upper dashed line). Significance is denoted by the asterisk (∗) (P < 0.05).
For Ito recordings, the pipette solution contained 95 mM K-aspartic acid, 11 mM EGTA, 15 mM KCl, 10 mM glucose, 10 mM HEPES, 30 mM KOH, and 3 mM Mg-ATP (pH = 7.2 adjusted with KOH). The external solution contained 137.7 mM NaCl, 2.3 mM NaOH, 1 mM MgCl2, 5.4 mM KCl, 10 mM glucose, 5 mM HEPES, 2 mM MnCl2, and 1 mM CdCl2 (pH = 7.4 adjusted with NaOH). A quantity of 100 μM tetrodoxin (TTX) or 3 mM 4-AP was added to the external solution in some experiments. Ito was measured in response to 400-ms test potentials ranging from −50 to +50 mV from a holding potential of 60 mV in the presence of TTX. Peak Ito was measured as the difference between peak current and current at the end of the 400-ms test pulse. The accuracy of this protocol in measuring pure Ito was confirmed by comparing measured Ito with the current trace inhibited by 4-AP. In some experiments, instead of using TTX, a 10-ms prepulse to 0 mV was applied to deactivate INa.
For ICaL recordings, other currents were minimized by setting the concentrations of intracellular Na+ and K+ to zero by replacement with aspartic acid (105 mM), cesium hydroxide (105 mM), and (20 mM); the concentrations of external Na+ and K+ were also set to zero by replacement with cesium Cl (6 mM) and TEA Cl (140 mM). We added 10 μM ryanodine to block Ca2+ release from the sarcoplasmic reticulum, and 20 μM ouabain to block IP, if any. At a holding potential of −50 mV, ICaT was inactivated so that the currents represent only ICaL.
Whole-cell currents were recorded using an Axopatch-1D Patch-Clamp Amplifier (Axon Instruments, Molecular Devices, Sunnyvale, CA) that was interfaced to a computer with a DigiData 1200 Digitizer and the software PCLAMP Ver. 8.2 (both by Axon Instruments, Molecular Devices). Current measurements were normalized by the cell capacitance (Cm), which was measured in each cell using the PCLAMP Membrane Test function.
Data analysis and statistics
Voltage-clamp data were analyzed using the softwares CLAMPFIT, Ver. 8.2 (Axon Instruments, Molecular Devices), Microsoft EXCEL (Microsoft, Redmond, WA), and SIGMAPLOT (Systat Software, St. Jose, CA).
Membrane currents are herein displayed as current densities (current amplitude normalized by Cm, pA/pF), unless the term “amplitude” is used to indicate an un-normalized current value. Pooled results, having sample size n, are expressed as mean ± SD. Differences between groups were assessed with the Student’s t-test.
Results
Transmural gradients in the effects of endogenous [A2] on IP and Ito
Fig. 1 A shows a typical whole-cell patch-clamp recording of the Na/K ATPase pump current (IP) from an isolated canine ventricular myocyte. In each cycle, the Na/K ATPase translocates 3 Na+ out of and 2 K+ into the cell, so there is a net outward current IP. External application of a saturating concentration of strophanthidin, a specific inhibitor of the Na/K ATPase, blocks the outward current and causes the holding current to shift inward by an amount equal to the maximum value of IP. Similar experiments done in myocytes isolated from EPI and ENDO regions of the ventricular wall show a transmural gradient in maximum IP (Fig. 1 B), consistent with previously reported data (6). To determine whether A2 and AT1Rs might be involved, a saturating concentration of exogenous A2 or a saturating concentration of the AT1R antagonist saralasin were used on EPI and ENDO myocytes. Fig. 1 B shows that 2 h incubation with 5 μM A2 inhibited IP in EPI to ENDO levels, but did not significantly affect IP in ENDO (lower dashed line). In contrast, 2 h incubation with 2 μM saralasin increased IP in ENDO to EPI levels (upper dashed line), but did not significantly affect IP in EPI.
These data suggest:
-
1.
Na/K ATPase protein is uniform across the ventricular wall; and
-
2.
IP is transmurally regulated through autocrine secretion of endogenous A2 and activation of AT1Rs.
These data do not indicate, however, whether it is a transmural gradient in the sensitivity of the AT1Rs with a uniform endogenous A2, or a transmural gradient in endogenous A2 with uniform AT1R properties. These two models are described and investigated below.
Model 1
Model 1 is that [A2] is uniform but there are two types of receptors—one with a high affinity for A2, so these would always be essentially saturated, and the other with a low affinity for A2, so these would always be essentially inactive. There could be a transmural gradient from all high-affinity receptors in ENDO to all low-affinity receptors in EPI, possibly through posttranslational modifications of the receptors in response to the transmural gradient in strain.
Model 2
Model 2 is that all affected receptors are the same, but there is a transmural gradient in autocrine A2 secretion, possibly in response to the transmural gradient in strain.
Although the data in Fig. 2 do not distinguish between these two models, the interpretation of each panel would be quite different, depending on which model is correct.. EPI myocytes were used to construct an exogenous [A2] dose-inhibition curve for IP (Fig. 2 A). Based on the curve-fit, we calculated the maximal IP inhibition by A2 to be 37% with an effective K0.5 of 185 nM. The K0.5 would represent the low-affinity type receptors in Model 1, or it would represent all involved receptors in Model 2. We next determined the fraction of A2/AT1R-mediated inhibition of IP in each of the five transmural layers. Cells from each layer were incubated with external A2 at a saturating concentration (5 μM) and external A2-induced inhibition of IP was documented for each layer (Fig. 2 B). The transmural percentages of maximum inhibition are shown in Fig. 2 C. This would be close to the percentage of high-affinity receptors in Model 1. To derive transmural concentrations of endogenous A2 predicted by Model 2, the concentrations of A2 were back-calculated from the dose-inhibition relationship in Fig. 2 A given the inhibitions shown in Fig. 2 B.
Figure 2.
Possible mechanisms of A2/AT1R regulation of IP. (A) An A2 dose-inhibition curve established by measuring IP from EPI cells incubated in [A2]. Maximum inhibition was 37% and K0.5 was 185 nM. (B) IP was maximally inhibited in all five layers with exogenous A2 and compared to endogenous IP. (C) Percentages of maximum inhibition of IP by endogenous A2 activating AT1Rs in the corresponding layers. (D) Endogenous [A2] was predicted from the inhibitions in panel B based on the dose-inhibition relationship in panel A.
Yu et al. (4) reported Ito in ENDO could be increased to EPI values by incubating ENDO cells with the AT1R antagonist losartan, and Ito in EPI could be reduced to ENDO values by incubating EPI cells with saturating A2. These observations suggest that the transmural gradient in Ito, like the gradient in IP, is due to a transmural gradient in A2/AT1Rs. Similar to our observations using IP, we also observed a transmural gradient in Ito (Fig. 3, A and B). The current increased continuously and monotonically from a value of 4 pA/pF in ENDO to a maximum of 13 pA/pF in EPI. The maximum increase in Ito was therefore ∼69%, consistent with Yu et al. (4). The voltage dependence of Ito was essentially the same in each transmural layer, based on Ito values relative to Ito in EPI at every test potential (Fig. 3 C). This suggests the number of functional Ito channels is different in each layer. The voltage dependence of Ito was also not affected by A2, because the ratio of Ito(EPI+A2)/Ito(EPI) was the same at each voltage (Fig. 3 D). These observations are consistent with:
-
1.
Ito protein is uniform across the ventricular wall; and
-
2.
Ito is transmurally regulated through autocrine secretion of endogenous A2 and activation of AT1Rs.
Figure 3.
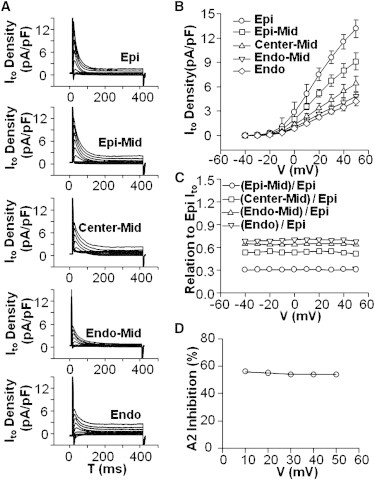
A transmural gradient in Ito. (A) Representative traces of outward currents from five transmural layers. (B) Peak Ito current-voltage relationships exhibit a transmural gradient in Ito magnitude at test potentials >20 mV. (C) The Ito gradient can be attributed to changes in the amplitude and not the voltage dependence of Ito. (D) A2 does not shift the voltage dependence but only affects the amplitude of Ito.
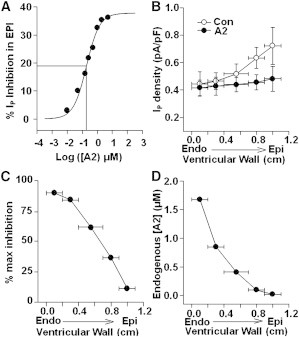
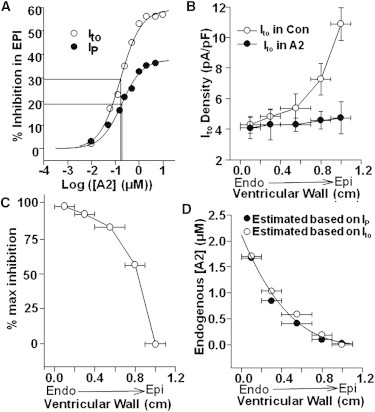
As was done for IP, EPI myocytes were used to construct an [A2] dose-inhibition curve for Ito (Fig. 4 A). The curve-fit yielded a maximal inhibition of 56% and a K0.5 of 169 nM. The dose-inhibition curve of IP is also plotted (Fig. 4 A) to illustrate the similarity of the two curves. Inhibition by exogenous A2 was recorded at five locations across the ventricular wall (Fig. 4 B). The percentage of maximum inhibition was calculated (Fig. 4 C). These data are very similar to the data in Fig. 2 C, so the same transmural gradient in either high-affinity AT1Rs or endogenous A2 appears to regulate both Ito and IP. Predicted values of endogenous [A2] were back-calculated from the dose-inhibition curve of Ito in Fig. 4 A and the inhibitions in Fig. 4 B. The values are graphed in Fig. 4 D where they are compared to the concentrations of A2 predicted from IP data. Based on the similarity of concentrations derived from Ito to the values obtained with IP, if Model 2 is correct, the same transmural gradient in A2 regulates both IP and Ito. The smooth curve-fit through these points is based on a simple relationship between myocardial strain and position in the ventricular wall, provided in the Discussion (see Corollary 4: A2 is Secreted in Response to Load and Causes Increased Contractility).
Figure 4.
Possible mechanisms of A2/AT1R regulation of Ito. (A) An A2 dose-inhibition curve was constructed by measuring Ito from EPI cells incubated in [A2]. Maximum inhibition was 56% and K0.5 was 169 nM. The dose-inhibition curve based on IP is overplotted. (B) Ito was maximally inhibited in all five layers with saturating A2 and compared to endogenous Ito. (C) Percentages of maximum inhibition of Ito by endogenous A2 activating AT1Rs in the corresponding layers. (D) Endogenous [A2] was predicted from the inhibitions in panel B based on the dose-inhibition relationship in panel A.
Based on the above results, there is no compelling reason to choose between Model 1 and Model 2. However, there are other data showing increases in autocrine secretion of A2 by cardiac myocytes subjected to stretch (9), so these data provide some support for Model 2. Moreover, if Model 1 is correct and there are two types of AT1Rs, they might run differently on Western blots. Fig. S1 shows Western blots of AT1Rs from EPI and ENDO recorded in cells from both left and right ventricles, and there is no difference. Thus, we found no data to support Model 1, and there are data to support Model 2. Our working hypothesis is that the transmural gradient in [A2], shown in Fig. 4 C, is responsible for the transmural gradients in ion transport.
Another area of investigation concerns the mechanism by which AT1R-activation signals reductions in both IP and Ito. It was previously shown that Kv4.3, the α-subunit of Ito, serves as a co-immunoprecipitator with the AT1R and is internalized with receptor activation and internalization (19). Fig. S2 shows that the α1-subunit of IP also co-immunoprecipitates with the AT1R in ventricular myocytes. Moreover, inhibiting trafficking by disruption of microtubules eliminates the inhibitory effect of AT1R activation on both IP and Ito (20,21). These data suggest that AT1Rs are associated with IP and Ito protein, such that activation and internalization of AT1Rs carries IP and Ito protein along with the receptor and reduces the totality of functional transporters in the plasma membrane.
Localization of A2 effects in the T-system
Even though the cells were isolated, and secreted molecules should diffuse away, effects of endogenous A2 were seen to persist for hours. This is consistent with continuous renewal into a restricted diffusion space. The existence of T-tubules in cardiac myocytes has been well documented, and the lumen of the T-system certainly could allow a relatively high concentration of A2 to be sequestered. We therefore tested whether A2-dependent reductions of IP are dependent on the presence of the T-system.
Isolated EPI and ENDO cells were detubulated using formamide shock (22). Detubulation was indicated by a decrease in Cm of 28% in EPI myocytes (Fig. 5 A) and 23% in ENDO myocytes (Fig. 5 B). The T-system membrane capacitance was calculated as the difference between control and detubulated myocytes (EPI: 59 pF; ENDO: 47 pF). These results indicate that ∼25% of the cell’s surface membrane resides in the T-system, a result consistent with electron microscopy literature (23,24). When EPI myocytes were detubulated, the amplitude of IP was reduced to essentially the same value as that of ENDO (Fig. 5 C). Whereas, when ENDO myocytes were detubulated, IP amplitude was minimally reduced (Fig. 5 D). Based on these results, the T-system IP amplitude in ENDO was calculated to be just 3 pA, implying that most of IP in the ENDO T-system is inhibited by endogenous A2 activating AT1Rs. Conversely, EPI IP amplitude dramatically decreased in detubulated cells (Fig. 5 C), although the change in Cm was comparable to that of ENDO. EPI IP amplitude in the T-system was calculated to be 54 pA, which was much larger than that in the T-system of ENDO. These results suggest the absence of endogenous A2 effects results in high IP in EPI T-system membranes.
Figure 5.
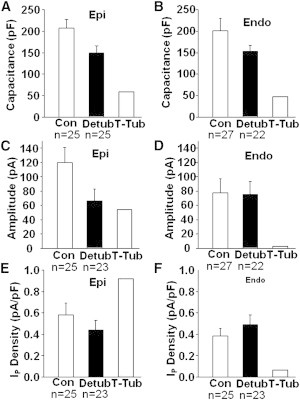
EPI and ENDO differences in T-system IP. (A) In detubulated cells (Detub), cell capacitance (Cm) declined 28% in EPI. T-system (T-Tub) membrane capacitance, and hence the membrane area, was calculated to be the difference between Con and Detub Cm. (B) Cm decreased by 23% in ENDO. T-Tub membrane capacitance was calculated as in panel A. (C) Detubulation caused a significant decrease in EPI IP amplitude. Taking the difference between Con and Detub IP amplitudes yielded T-Tub IP amplitude. (D) Detubulation minimally decreased ENDO IP amplitude. T-Tub IP was calculated as in panel C. (E and F) IP membrane density for total cell (Con), cell surface (Detub), and T-Tub were calculated by dividing the IP amplitude by the corresponding Cm. The density of IP in T-system membranes appears to be much higher than that in surface cell membrane, but in ENDO most of T-system IP is inhibited by endogenous A2.
To determine the density of IP in the total cell (control myocytes) in the cell surface (detubulated myocytes) and in the T-system membranes (Fig. 5, E and F), the IP amplitudes were divided by the corresponding Cm values. These results demonstrate that the cell surface IP density is not significantly different between EPI and ENDO myocytes, but that T-system IP amplitude is dramatically higher in EPI. Therefore, the difference in IP amplitude between EPI and ENDO (and hence the difference in autocrine A2 effects) can be attributed to the T-system membrane and not to the cell surface membrane.
EPI myocytes were detubulated then incubated in the presence of high exogenous [A2]. The Cm value was reduced by detubulation but was essentially unaffected by A2 (Fig. 6 A). Conversely, in EPI myocytes, IP could be significantly reduced by either detubulation or exogenous A2 (Fig. 6 B). However, application of A2 to detubulated EPI myocytes did not affect IP amplitude (Fig. 6 B), indicating that autocrine A2 effects are localized to membranes lining the T-system lumen.
Figure 6.
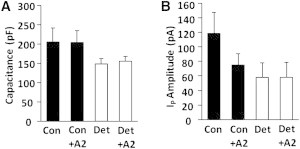
Summary of exogenous A2 effects in EPI control (Con) and detubulated (Det) myocytes. (A) Cm decreased similarly upon detubulation in both Con and A2 myocytes. (B) In Con myocytes, application of A2 induced a significant decrease in IP amplitude but had no effect in Det myocytes. These results suggest that A2/AT1R effects on IP mostly take place in the T-system.
The detubulation data imply endogenous [A2] does not decrease due to diffusion away from isolated myocytes because it is continuously secreted into a small restricted compartment, the T-system lumen (see Corollary 2: A Transmural Gradient in A2).
However, one expects A2 secretion to eventually run down. Fig. S3 shows that this is indeed the case, and IP in isolated ENDO myocytes increases to EPI levels over a period of 28–29 h, whereas IP in EPI does not change. At the end of this time period, addition of 5 μM exogenous A2 caused IP in ENDO to return to its original low value. This is consistent with the idea of a transmural gradient in A2 secretion eventually running down.
A transmural gradient in ICaL is regulated by endogenous A2
Wang and Cohen (5) first demonstrated ICaL was significantly higher in ENDO than EPI. Fig. 7 shows ICaL data recorded from ENDO and EPI and also shows the effect of exogenous A2 on the gradient. Moreover, in the Introduction, we described what is known about AT1R signaling, which occurs in two sequential phases. Fig. 7 also shows two sequential phases of effects of A2 on ICaL. Note that G-protein-mediated signaling leads initially to inhibition. However, after 2 h of incubation with A2, internalization of receptors leads to increased ICaL. Because all of our other data were recorded after 2 h of incubation in either A2 or an AT1R inhibitor, Fig. 7 suggests these other data also show effects of receptor internalization.
Figure 7.
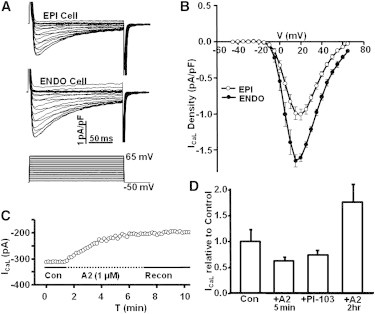
The L-Type Ca2+-current (ICaL) is transmurally regulated by A2 through two sequential phases of AT1R activation. (A) The protocol for measuring the time dependence of ICaL at a series of different voltages in a cell from EPI and ENDO. (B) There is a transmural gradient in the peak inward ICaL, with the value in ENDO being ∼70% larger than that in EPI. (C) Upon application of A2 to an EPI myocyte, the acute response is a decrease in peak inward ICaL. This appears to be due to the G-protein-mediated initial phase of AT1R signaling. (D) A summary of the effects of A2 on ICaL in EPI myocytes. The initial response over the first 5 min is a 35% decrease, which could be mimicked by application of the PI3K inhibitor PI-103. After 2 h, the G-protein phase of AT1R activation has ended, the receptor has internalized with β-arrestins to form a signal transduction scaffold that activates a number of different pathways, resulting in a 70% increase in peak inward ICaL.
Fig. 7 A shows the time dependence of a typical set of calcium currents measured from ENDO and EPI myocytes. Averages of the inward currents are graphed as a function of voltage in Fig. 7 B, where the peak inward current in ENDO is ∼1.7 pA/pF, but that in EPI is ∼1 pA/pF, indicating a significant transmural gradient. These data represent the steady-state conditions in ENDO and EPI. Similar results were initially published by Wang and Cohen (5), but they did not investigate the mechanism of regulation.
Fig. 7 C shows the short-term, transient effect of A2 on ICaL in an EPI myocyte. The protocol was the same as shown in Fig. 7 A; peak inward current is graphed versus time. Over a period of ∼5 min, ICaL is reduced on average by 35% (Fig. 7 D). The PI3K inhibitor, PI-103, caused a similar decrease in ICaL (Fig. 7 D). The short-term A2 response is possibly through the canonical signaling pathway in which Gq inhibits PI3K. When A2 was removed from the bathing solution, there was no short-term recovery over the period the patch lasted (Fig. 7 C).
Exposure to A2 for 2 h caused stimulation of ICaL. Fig. 7 D shows the average effects of the various interventions. When EPI was exposed to A2 for 2 h, peak inward ICaL increased by ∼70% to a value very similar to that in ENDO. This increase is thought to be through signaling by the internalized AT1R/β-Arrestin complex (reviewed in the Introduction). The AT1R/β-Arrestin complex terminates G-protein signaling by the AT1R and initiates a number of new signal transduction cascades. Fig. 7 D also shows that either short-term exposure to A2 or direct inhibition of PI3K with the inhibitor PI-103 causes an ∼35% decrease in ICaL in EPI. This outcome is consistent with the AT1R canonical pathway of Gq activation, which inhibits PI3K, causing the initial inhibition of ICaL. Long-term (2 h) incubation with A2 causes ICaL to increase, which is in the opposite direction to the long-term effects on IP and Ito, but the changes in all three transporters are in the direction to increase contractility in ENDO over EPI.
In situ effects of A2 on the transmural gradient in IP
All of the above experiments considered the effects of 2 h incubation with A2 in isolated myocytes at room temperature. Fig. S4 shows A2 inhibits the transmural gradient in IP when delivery is through the vasculature to a chunk of canine heart tissue maintained at 37°C. Fig. 7 A shows that IP in EPI and ENDO is the same when 5 μM A2 is delivered through the vasculature for ∼1 h before the whole-cell patch-clamp study. Fig. 7 B shows the usual transmural gradient in IP is present when this protocol is employed without exogenous A2.
Discussion
The data presented here, in connection with previous studies, suggest the following hypotheses, which unify a number of observations:
-
1.
Canine ventricular myocytes express an autocrine RAS that is localized to the transverse tubular system (T-system).
-
2.
There is normally a transmural gradient in the effects of [A2], with the effects in ENDO being highest.
-
3.
Increases in [A2] coherently reduce Ito and IP, and increase ICaL.
-
4.
This autocrine RAS modifies A2/AT1R interaction in response to load, and the consequent reductions in Ito and IP and increase in ICaL all increase contractility.
-
5.
The total number of transport proteins responsible for either Ito or IP is uniform across the ventricular wall, but those localized to T-system membranes can be reversibly internalized with activated AT1Rs to create the transmural gradients.
The corollary to Hypothesis 5 is that the transmural gradient in KChIP2 is not related to the transmural gradient in Ito. These are presented as working hypotheses that are consistent with available data, as discussed below.
Hypothesis 1: an autocrine RAS in the T-system
The presence of an autocrine RAS in ventricular myocytes is supported by several studies. Pan et al. (25) demonstrated message for the RAS components renin, angiotensinogen, angiotensinogen-converting enzyme, and the AT1R in canine ventricular myocytes. Sadoshima and Izumo (9) stretched neonatal cardiac myocytes in vitro and observed acute A2 secretion that resulted in the hypertrophic response, which was inhibited in the presence of AT1R antagonists. In this study, both IP and Ito were inhibited by a saturating concentration of exogenous A2 or increased by AT1R inhibition using saralasin or losartan (4), consistent with the presence of endogenous A2 and AT1Rs.
The T-system seemed the logical place for an autocrine RAS, based on several observations: A2 in cardiac tissue is largely obtained via self-production (8), where its half-life is 15–30 min, in contrast to 30 s in circulation (26). Based on our IP and Ito measurements, effects of endogenous A2 were essentially unchanged for hours in the isolated ENDO myocytes. Persistent autocrine A2 effects without immediate rundown could be explained if continuous secretion occurred into a small restricted compartment like the T-system lumen.
Our detubulization studies directly support the above conclusion. In mammalian species, T-tubular membrane makes up a significant percentage of the total membrane area that contacts the extracellular environment, with values of 39.6% in guinea pig left ventricle (LV) (23) and 32.6% in the rat LV (24). In our experiments with canine LV, we observed that cell capacitance declined ∼25% in detubulated myocytes, consistent with previous reports. Elimination of the T-system caused IP in EPI to drop to the same value as in ENDO, whereas IP in ENDO did not change. In detubulated myocytes IP in EPI became insensitive to exogenous A2. Because IP and Ito appear to be coherently regulated, the same conclusions should apply to Ito.
If AT1R stimulation takes place within the T-system, a significant percentage of Na/K pumps and ICaL and Ito channels must localize to the T-system membranes. Indeed, previous reports have described such localization. Localization of the majority of plasma membrane ICa,L channels to the T-system has been documented in rat myocytes (22). Takeuchi et al. (27) presented evidence for high Kv4.2 localization to the T-system of rat, although these channels were appreciably detected in nontubular membrane as well. Further, different isoforms of the α-subunit of the Na/K ATPase are expressed in the T-system and surface membranes of rat ventricular myocytes (28). There is also a higher density of both Na/K pumps and Na/Ca exchangers in the T-system than in surface membranes of these cells (29).
Hypothesis 2: a transmural gradient in A2
We assayed for the effects of A2 through the thickness of the LV wall by measuring IP and Ito in five transmural layers. We proposed two models that could explain our observations:
-
1.
The affinity of AT1Rs for A2 changed from high in ENDO to low in EPI; or
-
2.
The concentration of A2 changed from high in ENDO to low in EPI.
Our Fig. S1 detected no difference between ENDO and EPI receptors, whereas Sadoshima and Izumo (9) showed autocrine secretion of A2 increased with strain. We therefore adopt Model 2 as our working hypothesis, but Model 1 has not been ruled out. A2 dose-inhibition relationships for IP and Ito were constructed using myocytes from EPI, where AT1R activation by endogenous A2 appeared to be essentially zero. Based on the measured inhibitions in each region, the concentrations of endogenous A2 were back-calculated from the dose-inhibition curves. The results shown in Fig. 4 D indicate endogenous [A2] monotonically decreases from ∼1.4 μM in ENDO to essentially zero in EPI. The discussion in the previous section supports the hypothesis that these concentrations are in the lumen of the T-system. However, if A2 is secreted into the T-system lumen, it will also diffuse out of the T-system lumen, so these A2 concentrations are spatial averages within each tubule. Fig. S5 sketches the difference between exogenous and endogenous A2.
The concentration of endogenous A2 is quantitatively estimated by considering a simple model of a typical T-tubule, which is assumed to be a right circular cylinder whose length a = 8 μm and radius is 0.1 μm. A2 is assumed to be secreted uniformly by the membranes of the T-tubule. The steady-state diffusion equation for A2 is
| (1) |
where the closed end of the tubule is at x = 0 and the open end at the cell surface is at x = a, the diffusion coefficient is D ≈ 0.6 × 10⁻⁶ cm2/s, the surface/volume of the T-tubule is Sm/VT ≈ 2 × 105 cm−1, and the rate of secretion of A2 is given by jA2 moles/(cm2 s). The solution to Eq. 2 is
| (2) |
The timescale for A2 to develop the above parabolic concentration profile depends on the size of the tubule and is given by a2/D ≈ 1 s. Thus the concentration of A2 in the T-system can change rather quickly in comparison to the 2-h wait before whole-cell patch-clamp data were collected. The effect of A2 on the AT1Rs and subsequent steps are therefore rate-limiting for the development of the effect of A2 on ICaL, IP, or Ito.
Our data indicate the average [A2] in ENDO is 1.36 μM. Based on Eq. 3, this implies [A2] varies from [A2](0) = 2.0 μM to [A2](a) = 0. Inserting [A2](0) = 2 × 10⁻⁹ moles/cm3 into Eq. 3 gives jA2 = 0.02 pmoles/(cm2 s). Because we found the T-system capacitance per myocyte is ∼50 pF, corresponding to ∼50 × 10−6 cm2 of membrane, each myocyte is secreting A2 at the rate of ∼0.01 fmole/s. Thus, despite a fairly rapid time constant, a low rate of secretion into a compartment as small as the T-system lumen can generate a significant concentration of A2. This is because the surface/volume for the T-tubule is very large.
Conversely, it would require a high rate of A2 secretion across surface membranes to generate a significant concentration at the surface of the myocyte; indeed, the rate of secretion might generate a concentration of A2 that affected nonspecific targets outside of the heart. Given evolution has selected an autocrine system, one that requires extracellular binding, the system clearly needs to be located in a small restricted compartment, like the T-system, to regulate the local extracellular concentration without significantly perturbing the global extracellular concentration. Moreover, if the receptors in this autocrine system respond only to local [A2] and not systemic [A2], they need to have a much lower affinity for A2 than systemic receptors, and this is indeed the case. Because the receptors respond to AT1R inhibitors as normal AT1Rs, we speculate there are some posttranslational modifications that have conferred the relatively low A2-affinity.
Hypothesis 3: increasing [A2] coherently reduces Ito and IP, and increases ICaL
Coherent regulation of Ito and IP is primarily based on A2 dose-inhibition relationships (shown in Fig. 4 A). The K0.5 values of the two curves are essentially identical, suggesting that A2 regulation involves the same mechanisms. This hypothesis is also consistent with Hypothesis 5 that both transporters are internalized with activated AT1Rs. With regard to ICaL, it is larger in ENDO than EPI (21) (our data shown in Fig. 7 B), and exogenous A2 applied for 2 h to isolated EPI myocytes caused ICaL to increase to ENDO levels (Fig. 7 D), but its relationship to A2 concentration is not known. Because the transmural gradient in ICaL is opposite to that of IP or Ito, Hypothesis 3 cannot apply to ICaL. The mechanism, therefore, requires more steps in the signal transduction cascade for activated, internalized AT1Rs. Nevertheless, the existing data suggest that regulation of ICaL through autocrine A2 is present in the T-system of these myocytes.
Hypothesis 4: A2 is secreted in response to load and causes increased contractility
Support for the first part of this hypothesis was provided by Sadoshima and Izumo (9), who stretched neonatal cardiac myocytes in vitro and observed acute A2 release. Previous reports have shown that a transmural gradient in stress distribution and deformation exists in the LV wall, in which mechanical strain and cell shortening are highest in ENDO (14–16). Mechanical strain is approximately a linear function of position along the thickness of the LV wall (16), so transmural variations in electrical properties may be generated via a linear gradient in mechanical strain-induced autocrine A2 secretion. Indeed, the following basic assumptions lead to Eq. 3:
-
1.
Autocrine secretion of A2 is a sigmoidal function of strain developed in the ventricular wall when the chamber fills with blood.
-
2.
Strain is approximately a linear function of position across the ventricular wall, varying from 0.2 in ENDO to 0.06 in EPI (16).
-
3.
There is a threshold strain, then strain could be sensed and transduced through a series of steps to secretion of A2.
Steps 1–3 can be lumped into a Hill equation of the form
| (3) |
where S is strain. Thus, while Eq. 3 is heuristic, it is consistent with the results of Sadoshima and Izumo (9), suggesting a relationship between A2 secretion and load. Our data support the idea that A2 secretion is a function of passive stretch-tension in the myocardium during diastole (see Eq. 3, Fig. 4 D, and related text). Autocrine A2 secretion is higher in regions that are subjected to higher mechanical strain.
Consistent with the strain hypothesis, previous reports indicate that when the mouse LV is subjected to pressure overload, transmural differences in Ito (30) are abolished with overall reductions in Ito to ENDO levels, in tandem with the development of cardiac hypertrophy (3,31). In this case, it appears likely that A2 secretion increased in all layers, but only had a significant effect in regions, such as EPI or MID, where physiological levels of endogenous A2 were originally low and had marginal effect in regions such as ENDO, where endogenous A2 was already saturating. As a result, overall increases in A2 secretion led to Ito reduction uniformly to ENDO levels.
The second part of this idea is that A2 causes increased contractility. The data presented here in connection with the results of Sadoshima and Izumo (9) suggest there is a transmural concentration gradient in endogenous A2, which correlates with a transmural gradient in contractility (32). The connection between A2 and contractility is presumably through the ion transporters that are regulated by A2, and their effects on calcium dynamics. Higher A2 in ENDO over EPI causes inhibition of ENDO IP, which causes increased intracellular sodium and reduced Na/Ca exchange and increased intracellular calcium (33), which increases contractility. Higher A2 in ENDO also caused inhibition of Ito. Dong et al. (34) used the dynamic clamp to introduce Ito to the action potential in EPI myocytes, where it increased phase-1 repolarization, reduced the amplitude of calcium transients, and reduced contractions. Thus A2-mediated inhibition of Ito in ENDO relative to EPI should increase contractility in ENDO relative to EPI. The higher ICaL in ENDO relative to EPI, first reported by Wang and Cohen (5) and also shown here in Fig. 7 B, appears to be due to endogenous A2. Elevated ICaL in ENDO relative to EPI will also contribute to increased contractility in ENDO relative to EPI. Thus all of the currents that are known to be regulated by A2 are coherently regulated in the direction to cause increased contractility in response to increased A2.
If this hypothesis is correct, it implies a feedback control system in which changes in A2 secretion are driven by the difference between load and contractile force. When the cells were isolated from the heart for these studies, both load and contractions ceased to exist. Without knowing the details of the control system, one cannot predict the effect of cell isolation on A2 secretion. Our observation is that secretion continued for at least 24 h, but eventually ran down in 28–29 h (see Fig. S3). In the working heart, where both signals are present, secretion could change much more quickly. However, because the response appears to require the second phase of AT1R signaling (internalization of the receptors), the minimum response time is probably in the range of tens of minutes to 1 h.
Hypothesis 5: A2-mediated inhibition of Ito and IP is via internalization with activated AT1Rs
This idea implies the transport proteins responsible for IP and Ito are uniformly expressed across the ventricular wall, but those residing in membranes of the T-system are associated with the AT1Rs. The entire T-system membrane complex of AT1R-Na/K pumps-Kv4.3/KChIP2 is reversibly internalized to a submembrane pool of endosomal vesicles when the AT1Rs are activated and internalized. Kv4.3, the α-subunit of Ito, has been shown by Western blotting to be uniform across the wall. However, Western blots do not distinguish among protein in endosomal vesicle membrane, surface membrane, or T-system membrane. Kv4.3 co-immunoprecipitates with AT1Rs (19), so it is likely that Kv4.3 protein in the T-system membranes will internalize when the AT1R is internalized.
Here we show that the Na/K pump also associates with AT1Rs (see Fig. S2), and that blockade of AT1Rs makes both Ito and IP uniform across the wall at their high EPI values. This should represent the amounts expressed in T-system plus surface membranes. Application of saturating exogenous A2 also makes both currents uniform across the wall, but at their low ENDO values. This should represent the amounts expressed in surface membranes. Subtraction gives the amounts expressed in T-system membranes. Based on our data recorded from different groups of cells at different times, 33–50% of IP is expressed in T-system membranes, 56–65% of Ito is expressed in T-system membranes, and T-system membranes comprise 25% of the total plasma membrane. Moreover, 100% of the T-system protein responsible for each current can be internalized with AT1Rs.
Both Ito and IP appear to be regulated by trafficking, probably with the AT1R. Because IP and Ito are coherently regulated, the proteins responsible for IP are probably internalized in the same signal transduction complex. Moreover, microtubules are important in membrane trafficking. Our previous work has shown that the effects of A2 on Ip and Ito are eliminated in the presence of colchicine, a microtubule inhibitor (20,21). Thus both currents appear to be regulated through trafficking, and because the K0.5 for A2-mediated inhibition is the same for both currents, they most likely traffic together.
One corollary to this hypothesis is that the transmural gradient in KChIP2 (35–37), the β-subunit of Ito, does not contribute to the transmural gradient in Ito. This implies that the amount of KChIP2 expressed in ENDO, where KChIP2 is lowest, exceeds the amount of Kv4.3 that is expressed. Thus, the gradient in KChIP2 appears to be present for some purpose other than transmural regulation of Ito.
A possible feedback control system for A2 secretion
We should note at the outset that if Model 1 (regulation of AT1R affinity for A2) was correct, an almost identical feedback system could regulate AT1R affinity. Data discussed above suggest an overall feedback control system (Fig. 8) that dynamically regulates contractile force in the heart. As the ventricular chamber fills, parallel elastic elements are stretched, and that stretch would need to be sensed. Although there is no direct evidence that the sensor is composed of the TRP channels, these channels are known to be present in heart cell membranes where they respond to stretch (38). In Fig. 8, they have been indicated with a question mark as the sensor of parallel elastic stretch. Stretch of the cell membrane would stimulate A2 secretion. Contractile force would also need to be sensed in the series elastic element. Again, there is no direct evidence that Titin Kinase is the sensor, but it is present at the Z-line of cardiac myocytes, where it responds to stretch as the sarcomeres contract (39), so it has been included as a candidate for the sensor of series elastic stretch. Stretch of the series elastic element would inhibit secretion of A2. If load and contractile forces are in proper balance, A2 secretion would be constant; however, if load exceeded force production, more A2 would be secreted, causing decreases in IP and Ito, and increases in calcium current, resulting in increases in contractile force until balance is restored.
Figure 8.
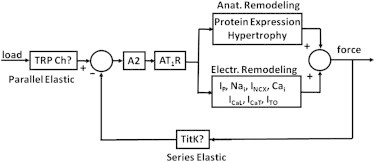
A simplified block diagram for feedback control of contractile force. When load is greater than force, the concentration of A2 in the T-system lumen increases, activating AT1Rs, which initially leads to electrical remodeling. If electrical remodeling is insufficient to restore balance between load and contractile force, then anatomical remodeling eventually occurs.
These changes would be posttranslational modifications of existing transport proteins, so they would occur more rapidly than anatomical remodeling, which requires synthesis and expression of new protein. However, if electrical remodeling is insufficient to restore balance, A2 secretion would continue to increase and eventually cause anatomical remodeling and hypertrophy to increase contractile force. All of this is summarized in Fig. 8, which implicitly includes many signal transduction steps, a number of which have not been experimentally characterized, but the input-output relationships are consistent with the data discussed above.
Acknowledgments
We are grateful to Drs. Michael Rosen and Thomas White for critical readings of this manuscript.
This work was supported by National Institutes of Health grants No. HL85221, No. HL094910, and No. HL11401.
Supporting Material
References
- 1.Di Diego J.M., Sicouri S., Antzelevitch C. Optical and electrical recordings from isolated coronary-perfused ventricular wedge preparations. J. Mol. Cell. Cardiol. 2013;54:53–64. doi: 10.1016/j.yjmcc.2012.10.017. [DOI] [PMC free article] [PubMed] [Google Scholar]
- 2.Litovsky S.H., Antzelevitch C. Transient outward current prominent in canine ventricular epicardium but not endocardium. Circ. Res. 1988;62:116–126. doi: 10.1161/01.res.62.1.116. [DOI] [PubMed] [Google Scholar]
- 3.Wang Y., Cheng J., Hill J.A. Remodeling of outward K+ currents in pressure-overload heart failure. J. Cardiovasc. Electrophysiol. 2007;18:869–875. doi: 10.1111/j.1540-8167.2007.00864.x. [DOI] [PubMed] [Google Scholar]
- 4.Yu H., Gao J., Cohen I.S. Effects of the renin-angiotensin system on the current Ito in epicardial and endocardial ventricular myocytes from the canine heart. Circ. Res. 2000;86:1062–1068. doi: 10.1161/01.res.86.10.1062. [DOI] [PubMed] [Google Scholar]
- 5.Wang H.S., Cohen I.S. Calcium channel heterogeneity in canine left ventricular myocytes. J. Physiol. 2003;547:825–833. doi: 10.1113/jphysiol.2002.035410. [DOI] [PMC free article] [PubMed] [Google Scholar]
- 6.Gao J., Wang W., Mathias R.T. Transmural gradients in Na/K pump activity and [Na+]I in canine ventricle. Biophys. J. 2005;89:1700–1709. doi: 10.1529/biophysj.105.062406. [DOI] [PMC free article] [PubMed] [Google Scholar]
- 7.Zhuo J.L., Ferrao F.M., Li X.C. New frontiers in the intrarenal renin-angiotensin system: a critical review of classical and new paradigms. Front Endocrinol. (Lausanne) 2013;4:166. doi: 10.3389/fendo.2013.00166. [DOI] [PMC free article] [PubMed] [Google Scholar]
- 8.van Kats J.P., Danser A.H., Schalekamp M.A. Angiotensin production by the heart: a quantitative study in pigs with the use of radiolabeled angiotensin infusions. Circulation. 1998;98:73–81. doi: 10.1161/01.cir.98.1.73. [DOI] [PubMed] [Google Scholar]
- 9.Sadoshima J., Izumo S. Molecular characterization of angiotensin II-induced hypertrophy of cardiac myocytes and hyperplasia of cardiac fibroblasts. Critical role of the AT1 receptor subtype. Circ. Res. 1993;73:413–423. doi: 10.1161/01.res.73.3.413. [DOI] [PubMed] [Google Scholar]
- 10.Lijnen P., Petrov V. Renin-angiotensin system, hypertrophy and gene expression in cardiac myocytes. J. Mol. Cell. Cardiol. 1999;31:949–970. doi: 10.1006/jmcc.1999.0934. [DOI] [PubMed] [Google Scholar]
- 11.Aplin M., Bonde M.M., Hansen J.L. Molecular determinants of angiotensin II type 1 receptor functional selectivity. J. Mol. Cell. Cardiol. 2009;46:15–24. doi: 10.1016/j.yjmcc.2008.09.123. [DOI] [PubMed] [Google Scholar]
- 12.Penela P., Ribas C., Mayor F., Jr. Mechanisms of regulation of the expression and function of G protein-coupled receptor kinases. Cell. Signal. 2003;15:973–981. doi: 10.1016/s0898-6568(03)00099-8. [DOI] [PubMed] [Google Scholar]
- 13.DeWire S.M., Ahn S., Shenoy S.K. Beta-arrestins and cell signaling. Annu. Rev. Physiol. 2007;69:483–510. doi: 10.1146/annurev.physiol.69.022405.154749. [DOI] [PubMed] [Google Scholar]
- 14.LeWinter M.M., Kent R.S., Covell J.W. Regional differences in myocardial performance in the left ventricle of the dog. Circ. Res. 1975;37:191–199. doi: 10.1161/01.res.37.2.191. [DOI] [PubMed] [Google Scholar]
- 15.Streeter D.D., Jr., Vaishnav R.N., Sonnenblick E.H. Stress distribution in the canine left ventricle during diastole and systole. Biophys. J. 1970;10:345–363. doi: 10.1016/S0006-3495(70)86306-8. [DOI] [PMC free article] [PubMed] [Google Scholar]
- 16.Waldman L.K., Fung Y.C., Covell J.W. Transmural myocardial deformation in the canine left ventricle. Normal in vivo three-dimensional finite strains. Circ. Res. 1985;57:152–163. doi: 10.1161/01.res.57.1.152. [DOI] [PubMed] [Google Scholar]
- 17.Zygmunt A.C. Intracellular calcium activates a chloride current in canine ventricular myocytes. Am. J. Physiol. 1994;267:H1984–H1995. doi: 10.1152/ajpheart.1994.267.5.H1984. [DOI] [PubMed] [Google Scholar]
- 18.Brette F., Komukai K., Orchard C.H. Validation of formamide as a detubulation agent in isolated rat cardiac cells. Am. J. Physiol. Heart Circ. Physiol. 2002;283:H1720–H1728. doi: 10.1152/ajpheart.00347.2002. [DOI] [PubMed] [Google Scholar]
- 19.Doronin S.V., Potapova I.A., Cohen I.S. Angiotensin receptor type 1 forms a complex with the transient outward potassium channel Kv4.3 and regulates its gating properties and intracellular localization. J. Biol. Chem. 2004;279:48231–48237. doi: 10.1074/jbc.M405789200. [DOI] [PubMed] [Google Scholar]
- 20.Gao J., Sun X., Mathias R.T. Inhibition of the Na/K pump current by angiotensin II is via pump protein internalization. Biophys. J. 2005 (Abstract) [Google Scholar]
- 21.Özgen N., Lu Z., Rosen M.R. Microtubules and angiotensin II receptors contribute to modulation of repolarization induced by ventricular pacing. Heart Rhythm. 2012;9:1865–1872. doi: 10.1016/j.hrthm.2012.07.014. [DOI] [PMC free article] [PubMed] [Google Scholar]
- 22.Kawai M., Hussain M., Orchard C.H. Excitation-contraction coupling in rat ventricular myocytes after formamide-induced detubulation. Am. J. Physiol. 1999;277:H603–H609. doi: 10.1152/ajpheart.1999.277.2.H603. [DOI] [PubMed] [Google Scholar]
- 23.Forbes M.S., van Neil E.E. Membrane systems of guinea pig myocardium: ultrastructure and morphometric studies. Anat. Rec. 1988;222:362–379. doi: 10.1002/ar.1092220409. [DOI] [PubMed] [Google Scholar]
- 24.Page E. Quantitative ultrastructural analysis in cardiac membrane physiology. Am. J. Physiol. 1978;235:C147–C158. doi: 10.1152/ajpcell.1978.235.5.C147. [DOI] [PubMed] [Google Scholar]
- 25.Pan Z., Wang H.S., Cohen I.S. Possible molecular mechanism underlying transmural electrical heterogeneity in canine ventricle. Biophys. J. 2004;8:298A. [Google Scholar]
- 26.van Kats J.P., de Lannoy L.M., Schalekamp M.A. Angiotensin II type 1 (AT1) receptor-mediated accumulation of angiotensin II in tissues and its intracellular half-life in vivo. Hypertension. 1997;30:42–49. doi: 10.1161/01.hyp.30.1.42. [DOI] [PubMed] [Google Scholar]
- 27.Takeuchi S., Takagishi Y., Kodama I. Voltage-gated K+ channel, Kv4.2, localizes predominantly to the transverse-axial tubular system of the rat myocyte. J. Mol. Cell. Cardiol. 2000;32:1361–1369. doi: 10.1006/jmcc.2000.1172. [DOI] [PubMed] [Google Scholar]
- 28.Swift F., Tovsrud N., Sejersted O.M. The Na+/K+-ATPase α2-isoform regulates cardiac contractility in rat cardiomyocytes. Cardiovasc. Res. 2007;75:109–117. doi: 10.1016/j.cardiores.2007.03.017. [DOI] [PubMed] [Google Scholar]
- 29.Despa S., Brette F., Bers D.M. Na/Ca exchange and Na/K-ATPase function are equally concentrated in transverse tubules of rat ventricular myocytes. Biophys. J. 2003;85:3388–3396. doi: 10.1016/S0006-3495(03)74758-4. [DOI] [PMC free article] [PubMed] [Google Scholar]
- 30.Brunet S., Aimond F., Nerbonne J.M. Heterogeneous expression of repolarizing, voltage-gated K+ currents in adult mouse ventricles. J. Physiol. 2004;559:103–120. doi: 10.1113/jphysiol.2004.063347. [DOI] [PMC free article] [PubMed] [Google Scholar]
- 31.Marionneau C., Brunet S., Nerbonne J.M. Distinct cellular and molecular mechanisms underlie functional remodeling of repolarizing K+ currents with left ventricular hypertrophy. Circ. Res. 2008;102:1406–1415. doi: 10.1161/CIRCRESAHA.107.170050. [DOI] [PMC free article] [PubMed] [Google Scholar]
- 32.Cordeiro J.M., Greene L., Antzelevitch C. Transmural heterogeneity of calcium activity and mechanical function in the canine left ventricle. Am. J. Physiol. Heart Circ. Physiol. 2004;286:H1471–H1479. doi: 10.1152/ajpheart.00748.2003. [DOI] [PubMed] [Google Scholar]
- 33.Wang W., Gao J., Mathias R.T. A transmural gradient in the cardiac Na/K pump generates a transmural gradient in Na/Ca exchange. J. Membr. Biol. 2010;233:51–62. doi: 10.1007/s00232-010-9224-y. [DOI] [PMC free article] [PubMed] [Google Scholar]
- 34.Dong M., Yan S., Wang H.S. Role of the transient outward current in regulating mechanical properties of canine ventricular myocytes. J. Cardiovasc. Electrophysiol. 2010;21:697–703. doi: 10.1111/j.1540-8167.2009.01708.x. [DOI] [PubMed] [Google Scholar]
- 35.Alday A., Urrutia J., Casis O. α1-adrenoceptors regulate only the caveolae-located subpopulation of cardiac KV4 channels. Channels (Austin) 2010;4:168–178. doi: 10.4161/chan.4.3.11479. [DOI] [PubMed] [Google Scholar]
- 36.Rossow C.F., Dilly K.W., Santana L.F. Differential calcineurin/NFATc3 activity contributes to the Ito transmural gradient in the mouse heart. Circ. Res. 2006;98:1306–1313. doi: 10.1161/01.RES.0000222028.92993.10. [DOI] [PubMed] [Google Scholar]
- 37.Rosati B., Pan Z., McKinnon D. Regulation of KChIP2 potassium channel β-subunit gene expression underlies the gradient of transient outward current in canine and human ventricle. J. Physiol. 2001;533:119–125. doi: 10.1111/j.1469-7793.2001.0119b.x. [DOI] [PMC free article] [PubMed] [Google Scholar]
- 38.Watanabe H., Iino K., Ito H. Possible involvement of TRP channels in cardiac hypertrophy and arrhythmia. Curr. Top. Med. Chem. 2013;13:283–294. doi: 10.2174/1568026611313030006. [DOI] [PubMed] [Google Scholar]
- 39.Gautel M. Cytoskeletal protein kinases: titin and its relations in mechanosensing. Pflugers Arch. 2011;462:119–134. doi: 10.1007/s00424-011-0946-1. [DOI] [PMC free article] [PubMed] [Google Scholar]
Associated Data
This section collects any data citations, data availability statements, or supplementary materials included in this article.