

Abstract
Purple photosynthetic bacteria harvest light using pigment-protein complexes which are often arranged in pseudo-organelles called chromatophores. A model of a chromatophore from Rhodospirillum photometricum was constructed based on atomic force microscopy data. Molecular-dynamics simulations and quantum-dynamics calculations were performed to characterize the intercomplex excitation transfer network and explore the interplay between close-packing and light-harvesting efficiency.
Introduction
Life on earth is sustained through photosynthetic light harvesting (1,2). The efficiency with which plants and bacteria absorb sunlight and convert the resulting electronic excitation energy, before it dissipates, into more stable forms of energy has made this process the subject of many studies (3–10). The studies showed that in natural light harvesting systems, the initial photoexcitation of pigment molecules (with the latter held in place by a protein matrix to form pigment-protein complexes (11–13) is followed by rapid, long-distance energy migration in the form of electronic excited states to reach a photosynthetic reaction center (RC) (5,14). The RC, found in all photosynthetic species, performs the first key energy conversion of electronic excitation, namely to a transmembrane charge separation (15–17).
For light harvesting pigment-protein complexes organized in supramolecular arrangements, purple bacteria use chromatophores, which are structurally much simpler than the corresponding systems from evolutionarily more advanced cyanobacteria and plants (1,18,19). Light harvesting in purple bacteria is performed mainly by three pigment-protein complexes: the reaction center (RC), the light harvesting complex 1 (LH1), and the light harvesting complex 2 (LH2). In the case of the purple bacterium Rhodospirillum photometricum, these complexes are arranged in lamellar chromatophores (20) as opposed to spherical chromatophores found, for example, in Rhodobacter sphaeroides (21,22).
Combining the available crystallographic (11) and modeled (23) structures of LH2 and a complex of LH1 and RC, the LH1-RC core complex, with spectroscopic and AFM data characterizing the organization of pigment-protein complexes, has resulted in atomic-detailed models of whole spherical chromatophores from Rb. sphaeroides (21,22). It was shown, using these models, that chromatophores from Rb. sphaeroides have remarkably high light-harvesting efficiency (the probability of an absorbed photon resulting in a charge gradient). It was shown that, due to the short (∼1 ns) lifetime of excitations (21,22), light harvesting efficiency depends strongly on the distance that excitation has to travel from the initially excited complex to reach the reaction center.
Atomic force microscopy (AFM) data elucidated the arrangement of light harvesting complexes in the lamellar chromatophores of Rps. photometricum (20). The AFM data can be used to model light absorption, excitation transfer, and RC trapping under different light conditions (24,25). Although the schematic model employed in Caycedo-Soler et al. (24,25) provided insight into adaptation of photosynthetic systems to different light conditions, key details of the photosynthetic membrane, in particular the actual arrangement of light harvesting complexes, were described using the raw imaging data with the distance dependence of excitation transfer neglected. In particular, the raw image data, as published in Scheuring and Sturgis (20), need to be subjected to atomic level modeling including lipids, water, ions, protein, and pigment to construct a photosynthetic membrane that is physically realistic while it remains as close as is feasible to the AFM image taken under extracellular conditions.
Excitation transfer is known to vary strongly with intercomplex separation R (22). In the case of completely incoherent excitation transfer, the transfer rates decrease by a factor R−6 (5). Knowledge of the placement of pigment-protein complexes is thus vital to accurately model light harvesting in a realistic membrane.
Combining AFM data (20) with atomic structures from prior investigations (11,23,26,27) makes it possible, to our knowledge for the first time, to model in atomic detail a multicomplex photosynthetic membrane as it most likely appears in the cell. The model’s structural integrity was tested through a molecular-dynamics simulation combining light harvesting proteins, reaction centers, lipids, ions, and aqueous solvent into a complete model. The resulting 20,000,000 atom model, one of the largest biological systems modeled to date at the atomic level, was simulated using the molecular-dynamics program NAMD 2.9 (28). Quantum-dynamics calculations were then performed using the software PHI (29) to determine a set of transfer rates that quantitatively characterize the intercomplex excitation transfer network, which was then used to calculate two key system characteristics—the excited state lifetime and the light harvesting efficiency of the system.
Methods
In this section, the construction and simulation methods used to investigate the chromatophore membrane are presented as follows:
-
1.
The all-atom model, along with details of the molecular-dynamics simulation employed to derive and equilibrate the model, is summarized; and
-
2.
The quantum-mechanical description of excitation transport under thermal conditions employed for determining the excited state lifetime and efficiency is described.
Construction of chromatophore patch
AFM data from a chromatophore membrane of the purple bacterium Rsp. photometricum (20, 32) (see Fig. 1 A), which includes information regarding location and rotational orientation of the proteins in the membrane patch, served as a starting point for building two all-atom models: the first model contained 36 LH2s and 7 LH1 monomers, as shown in Fig. 1 B, and the second model, constructed later, contained 39 LH2s and 7 LH1 monomers, with one of the LH1 monomers left open near the quinone QB binding site, as shown in Fig. 1, C and D.
Figure 1.
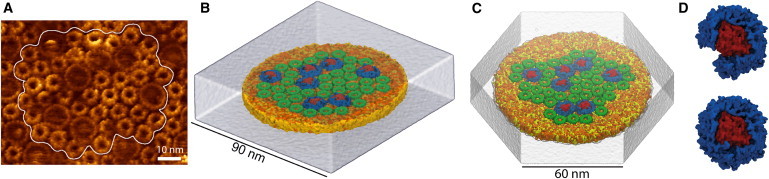
(A) AFM topograph of the native Rps. photometricum photosynthetic membrane (20) with modeled section highlighted. (B) First all-atom model of chromatophore patch, including 36 LH2 and 7 LH1-RC pigment-protein complexes. (C) Second model of the chromatophore patch, containing 39 LH2 and 7 LH1-RC complexes. (D) Close-up of the open LH1 monomer (top) added to the second model, next to a closed LH1 monomer (bottom). To see this figure in color, go online.
The LH2 and LH1 structures used were the crystal structure of LH2 from Rhodospirillum acidophila (11) and a modeled Rps. acidophila LH1 monomer structure (12,27), respectively, both preequilibrated in a lipid membrane. The two structures were chosen because, at this time, there are no LH1 or LH2 structures for Rsp. photometricum available, and because the two species., i.e., Rsp. photometricum and Rps. acidophila, are similar in that both have lamellar chromatophores and express 16-fold LH1 monomers and ninefold LH2s. At the time of modeling, there were no crystal structures for an LH1-RC monomer complex available, so the modeled LH1-RC monomer from previous simulations (27) was used. A crystal structure for the LH1-RC complex from Thermochromatium tepidum has very recently been published (33), which displays an arrangement similar to our model, with 16 heterodimers of LH1-αβ subunits encircling the RC. The open LH1 monomer was constructed by removing two αβ subunits near the QB binding site, as shown in Fig. 1 D.
Rigid-body mapping of LH1 and LH2 onto the AFM data leads to sterical overlap between adjacent proteins, due to not capturing the flexibility of the LH1 rings or the tilt of some LH1 and LH2 complexes seen in the AFM-imaged membrane. After rigid-body mapping, the protein complexes were manually moved apart until all sterical clashes were resolved, while keeping the overall protein packing density as close as possible to what is seen in the AFM image. The initial placement of the proteins, although based on AFM data, did not take into account the myriad physical interactions responsible for protein packing and placement in the membrane. By simulating the complete system, including protein, cofactors, lipids, and solvent, these interactions are accounted for and a biologically reasonable structure is obtained with only minor deviation from the starting structure. System construction and analysis were performed using the software VMD (31).
The light-harvesting proteins were embedded into a large membrane patch, which had been constructed to represent a realistic chromatophore membrane of POPC (PC), POPE (PE), and POPG (PG) lipids (34–36) with an asymmetric distribution of POPG across the two lipid leaflets (36–38). The overall lipid distribution was 16% PG, 23% PC, and 61% PE, with 70% of the charged PG lipids on the cytoplasmic side, giving 22% PG, 22% PC, and 56% PE for the cytoplasmic side and 10% PG, 24% PC, and 66% PE for the periplasmic side. As in the case of previous simulations (26,27), the membrane patch was intended to be simulated in isolation from its periodic images in the molecular-dynamics simulation, meaning that the circular edge of the membrane was exposed to solvent. To minimize distortion resulting from exposure to solvent, small detergent-like lipids were placed around the edge of the membrane (with PE, PC, and PG headgroups in the same ratio as the membrane). Lipids were removed from the large membrane patch where they overlapped with the protein complexes.
In the second model, 150 quinone molecules were added in random places in the membrane so that their local diffusion could be studied in different environments (the first, earlier model contained no quinones). Three additional LH2s were added in the second model so that the open LH1 monomer would not be exposed at the edge of the protein-rich part of the membrane.
The first model was solvated in a rectangular (949 × 880 × 257 Å) water box, and the second was solvated in a hexagonal water cell of side length 600 Å. In both cases, sodium ions were added to neutralize the simulation system. The first model contained a total of 20,325,225 atoms, and the second contained a total of 23,699,480 atoms. The first model was used for the quantum-mechanical calculations in this paper. The second model, built after the authors had more experience with constructing and simulating large systems, was used to analyze the local movements of the protein complexes, lipids, and quinones.
Molecular-dynamics minimization and relaxation of the chromatophore patch
After minimization and several short construction simulations, the first Rsp. photometricum chromatophore patch was simulated on the following supercomputing resources: Jaguar (Oak Ridge National Laboratory, Oak Ridge, TN); Tsubame (Tokyo Institute of Technology, Tokyo, Japan); and Blue Waters (National Center for Supercomputing Applications, Urbana, IL). The second chromatophore patch was equilibrated on Blue Waters and TITAN (Oak Ridge National Laboratory). The large memory requirement for the simulation was overcome by employing the software NAMD 2.9 (28), which is capable of simulating up to 100,000,000 atoms and had been attuned to each of the supercomputers (39). Simulations were performed at 310 K and 1 atm using a 2-fs timestep, employing a Langevin thermostat and barostat (28) to enforce constant temperature and pressure. The CHARMM force field was employed for the simulation of lipids, protein, and ions (40,41); TIP3P (42) parameters were used to describe water. Parameters from prior investigations of LH2 (26) and LH1-RC (27) were employed to describe the protein cofactors.
Quantum dynamics and excitation energy transport
Efficient excitation transfer between pigment-protein complexes is vital to efficient light harvesting. It has been shown that the excitation transfer strongly depends on intercomplex separation (21) and that intracomplex quantum coherence plays a vital role in excitation transport (4,43). Previous investigations into excitation transport in chromatophores have employed either separation-independent (24,25) rates or rates calculated using generalized Förster theory (21,22). In this investigation, transfer rates were determined using the hierarchy equations of motion (HEOM) that describe the dynamics of a quantum system in contact with a thermal environment (44–46); the actual separation between light harvesting proteins LH1 and LH2 was taken into account in the calculations.
The HEOM furnish the time evolution of the density matrix ρ(t) describing excitation dynamics in full for arbitrary interpigment coupling values and arbitrarily strong fluctuations arising from thermal motion at 300 K. The computational expense of the HEOM method has prohibited its prior use in large, multicomplex systems, which is overcome in this case by using the program PHI (29). PHI distributes the workload of solving the HEOM on a parallel computer, such that each processor is responsible for solving only a subset of the many equations required for large systems.
Although it has been shown that generalized Förster theory can adequately account for excitation transfer between separated pigment clusters, separation between light harvesting proteins and, therefore, the intercluster spacing in this system, as shown in Fig. 1, is closer than previously investigated (29,46,47) and so the applicability of generalized Förster theory needs to be tested anew.
Excitation dynamics within each pigment protein complex n is determined by the effective Hamiltonian Hn, and the interaction between two complexes by an interaction Hamiltonian HInm. The Hamiltonians Hnm = Hn + Hm +HInm describe the excited state interactions between all pairs of LH1 and LH2 complexes (see Appendix A). Excitation dynamics for each pair of LH1 and LH2 complexes were calculated using the HEOM, with parameters taken from prior investigations (29,46,48,49). Because the spacing between LH1 and the RC remained the same, prior results were used for all LH1-RC pairs (49). HEOM calculations result in the density matrix trajectory ρ(t) that describes in full the quantum dynamics of intercomplex excitation transfer.
The HEOM employs a set of additional density matrices that couple to the system density matrix ρ(t) to account for non-Markovian excitation dynamics. Due to the coherent coupling and strong environmental influence in the system, the number of additional matrices that need to be computed scales nearly exponentially with the number of pigments N in the system. The calculation of excitation transfer between a single pair of complexes requires integrating the HEOM for up to 50 ps. Using adaptive timestep integration, the software PHI (29) completes 50 ps of integration in 24 h on a single (32-processor) node of the RANGER Supercomputer (Texas Advanced Computing Center, Austin, TX), even in the case of two LH1 complexes (64 pigments). Employing a single RANGER node per pair calculation (114 in total), excitation transfer between all neighboring complexes could be completed in 24 h using the software PHI.
For a system consisting of two complexes, i and j, and containing thus a total of N = Ni + Nj pigments, the probability of complex i being excited at time t is calculated using
| (1) |
where tri is the partial trace over pigments in complex i.
Assuming that excitation transfers incoherently between complexes i and j, the occupation probability Pi(t) is governed, in the simplest case, by the kinetic equation
| (2) |
where kij is the rate of excitation transfer from complex i to complex j. The transfer rates kij can be obtained by fitting Eq. 2 to the occupation probability obtained from the density matrix dynamics using Eq. 1. The transfer rates kij can alternatively also be calculated using generalized Förster theory as (22)
| (3) |
where Cij is dependent on the relative orientations of complexes i and j, and rij is their center-to-center separation.
The light harvesting efficiency q and lifetime τ of excitation in the system can be determined using (21,22,50)
| (4) |
| (5) |
where kCS = 1/(3 ps) is the charge-separation rate,
is as a sum over RCs,
and where |i〉 = |ϕ1…ϕi∗…ϕN〉 is the basis vector in which the ith bacteriochlorophyll is in the Qy-excited state and all the other bacteriochlorophylls are in the ground state (22), p(0) specifies the initially excited complex at t = 0, and the transition matrix K is determined from intercomplex transfer rates kij through
where kdiss = 1/(1 ns) is the rate of excitation loss due to fluorescence and internal conversion.
Results and Discussion
In this section the results of the molecular-dynamics simulations and excitation dynamics calculations are presented. The model of the photosynthetic membrane is compared with the AFM topograph. Next, the excitation transfer rates resulting from the structure are presented and the effect of light harvesting on the protein packing density is examined.
Molecular dynamics
The first chromatophore patch model was equilibrated for an aggregate 40 ns of simulation time, which allowed the protein and lipid components from the chromatophore patch to equilibrate from the closely packed starting structure. The final state of the Rsp. photometricum chromatophore system is shown in Fig. 2 A. Fig. 2 B shows the approximate positions of the chlorophyll rings at the end of the simulation (solid circles), and as placed by the raw AFM data (dashed circles). The equilibrated structure was used for the excitation transport calculations described below.
Figure 2.
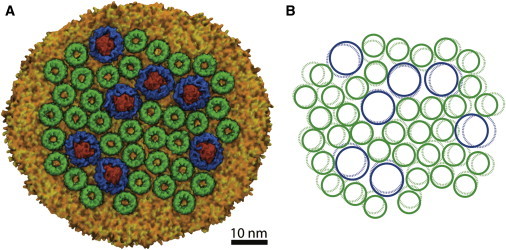
(A) Structure of chromatophore patch after 40 ns of equilibrium molecular-dynamics simulation. (B) Positions of the chlorophyll rings, as placed by the raw AFM data (dashed blue and green circles), and at the end of the simulation (solid blue and green circles). To see this figure in color, go online.
The second chromatophore patch model was equilibrated for a total of 150 ns. The average RMSDs of the LH2 and LH1 complexes are shown in Fig. 3 A, and are consistent with reports that LH1 complexes are more flexible than LH2 complexes (51,52). The open LH1 monomer was not found to be less stable than the closed LH1 monomers on the timescale of the simulation, the stability stemming from close adhesion to the RC of the LH1 subunits rather than from the ring closure. Because some bacterial species naturally exhibit open LH1 monomers (53,54), the apparent stability of the open LH1 monomer is unsurprising.
Figure 3.
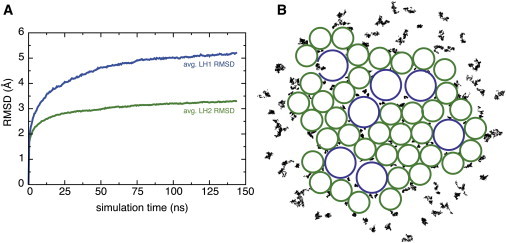
(A) Average RMSD of the LH2 complexes and of the LH1 monomer complexes. (B) Visualization of quinone (black dots) mobility in different local environments around the LH1 and LH2 complexes (blue and green circles). To see this figure in color, go online.
The local random movement of the quinone molecules was also examined. The quinone molecules in the lipid-rich region outside of the protein complexes, or in the large, lipid-filled gaps between protein complexes, showed much more mobility than quinones placed in smaller gaps between proteins. Fig. 3 B shows the center of each quinone as it moves over the course of the trajectory, superimposed with circles representing the positions of the LH1 and LH2 complexes.
Excitation transport
A subsystem composed of one LH1-RC complex and three LH2 complexes is used to illustrate the determination of transfer rates from density matrix trajectories. Fig. 4 A shows the organization of the subsystem, which is taken directly from the simulated structure shown in Fig. 2. A HEOM calculation was performed for each of the six pairs of neighboring complexes in the subsystem. The occupation probabilities Pi(t) of the donor complex in each calculation is shown in Fig. 4 B along with the fit to the kinetic model (Eq. 2). In each case the fit is excellent, as can be seen in Fig. 4 B, despite the close packing of the complexes. Fig. 4 C depicts the resulting excitation transfer network along with time constants tij = 1/kij.
Figure 4.
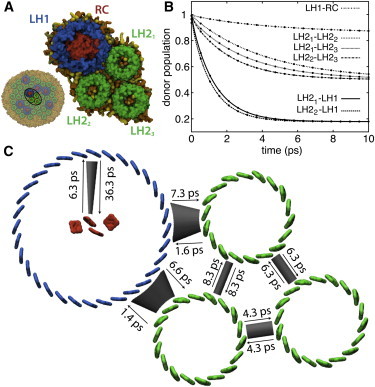
(A) Subsystem comprising one LH1-RC and three LH2 to illustrate results of transfer rate calculations using the HEOM. (B) Relaxation of donor excited state population as calculated by the HEOM (lines) and using fitted transfer rates of a simple kinetic model (circles). (C) Excitation transfer network with excitation transfer times obtained from fitted transfer rates. To see this figure in color, go online.
The excitation transfer network for the full 43 complex system (Fig. 2 A) was determined using the procedure described for the four-complex subsystem. Due to the computational expense, HEOM calculations were performed only for complexes with center-to-center separations of <13.5 nm. In total, excitation dynamics for 114 pairs of light harvesting complexes LH1 and LH2 were calculated. Intercomplex excitation transfer rates were determined from the resulting density matrix trajectories and are presented in Fig. 5.
Figure 5.
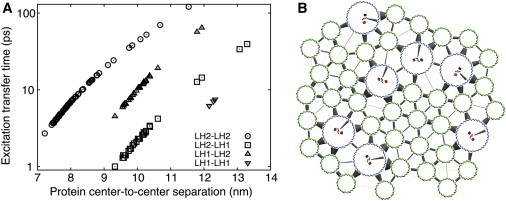
(A) Intercomplex excitation transfer times as determined from HEOM calculations. (B) Excitation transfer network between B850 (green) and B875 (blue), and RC (red) bacteriochlorophylls. The thicker the connection at a cluster, the higher the rate of excitation transfer to that cluster. To see this figure in color, go online.
The range of intercomplex separations of neighboring complexes is shown in Fig. 5 A along with the associated intercomplex excitation transfer times. Complexes within 1 nm of steric contact have a range of excitation transfer times between 3 and 20 ps for LH2 to LH2, 1 and 4 ps for LH2 to LH1, 4 and 20 ps for LH1 to LH2, and between 5 and 8 ps for LH1 to LH1. Even with the tightly packed membrane patch studied here, the small variation in separation distance accounts for a large variation in excitation transfer times between light harvesting complexes (21,43,55–58).
The excitation transfer network of the simulated chromatophore patch is depicted in Fig. 5 B. Employing the transfer rates calculated according to Eqs. 4 and 5 yields an exciton lifetime of τ = 94.9 ps and a light harvesting efficiency of q = 90.5%. Lifetime and efficiency are consistent with those from prior calculations (21,22,24,25,59).
Indeed, excitation transfer computed via generalized Förster theory (22) results in a lifetime of 97.3 ps and an efficiency of 90.3%, values which are very close to those obtained using PHI.
There are many photosynthetic processes that occur simultaneous to excitation transfer, such as the diffusion of quinones from LH1-RC to cytochrome bc1 (1). While the dense packing of complexes in the chromatophore membrane favors rapid excitation transfer, it hinders quinone diffusion. A question that naturally arises is whether the observed dense packing is a strict requirement for efficient light harvesting. The low computational cost of generalized Förster theory permits one to examine the effect of packing density on light harvesting efficiency. Fig. 6 shows this dependence. Reducing the light harvesting protein packing density by 50% relative to the density shown in Fig. 2 A results in an average neighbor edge-to-edge separation of 3.7 nm and only a 4% decrease in light harvesting efficiency.
Figure 6.
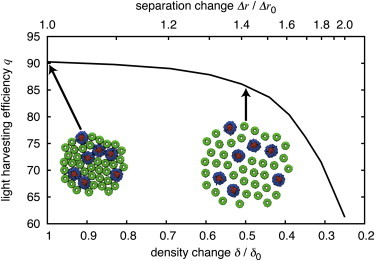
Dependence of light harvesting efficiency on packing density. Reducing the packing density of light harvesting proteins, e.g., by a factor of 2 corresponding to δ = δ0/2, results in an average neighbor edge-to-edge separation of 3.7 nm and a 4% decrease in light harvesting efficiency from the efficiency for a δ = δ0 value. To see this figure in color, go online.
Conclusion
The excitation transport network of a chromatophore membrane from purple bacterium Rsp. photometricum has been determined for a membrane patch as observed through AFM (20). The computation was achieved by using a combination of topographical data from AFM experiments (20), molecular modeling (28), and excitation dynamics calculations (49). An AFM topograph (20) was used to generate an all-atom model for the placement of 36 LH2 and 7 LH1-RC complexes in a chromatophore membrane patch. Subsequent molecular-dynamics calculations yielded a relaxed structure of the membrane patch to serve as input for excitation transport calculations.
Low image resolution and imaging effects due to movement of the protein complexes resulted in apparent steric overlap between complexes, which was removed by an all-atom molecular-dynamics simulation. The simulation kept the membrane close to the starting conformation while allowing it to relax to a physically reasonable structure. The relaxed chromatophore membrane structure served as input to quantum-dynamics calculations to determine the rates of excitation transport between complexes.
Excitation transfer times between neighboring pigment-protein complexes were determined using the HEOM that describes excitation dynamics in a nonperturbative manner (45). Due to variation of interprotein distances, the resulting transfer times also showed great variation, even between complexes spaced <1 nm apart. This variation indicates the importance of accounting for the separation dependence of excitation transfer and the need to model the supramolecular organization as accurately as possible.
The procedure employed in this investigation does not rely on prior assumptions of membrane organization or packing and yields the excitation transport network of a large system from low-resolution data. It is thus an attractive procedure to use in studying other, possibly more complex systems for which only low-resolution data on membrane organization is available. Using molecular-dynamics simulations as input to study quantum processes allows one to account for the hierarchy of physical interactions prevalent in biological systems.
Acknowledgments
Funding was provided by National Science Foundation grants No. PHY-0822613 and MCB-1157615, and National Institutes of Health grant No. 9P41GM104601. This study used computer resources provided in the framework of the Extreme Science and Engineering Discovery Environment (XSEDE), which is supported by National Science Foundation grant No. OCI-1053575, and also received computer time from the Tsubame supercomputer (Tokyo Institute of Technology, Japan). The research used resources of the Titan supercomputer at the Oak Ridge Leadership Computing Facility at Oak Ridge National Laboratory, which is supported by the Office of Science of the Department of Energy under grant No. DE-AC05-00OR22725. Furthermore, the investigation is also part of the Blue Waters Sustained-Petascale Computing Project, which is supported by the National Science Foundation (grant No. OCI 07-25070) and the State of Illinois. Blue Waters is a joint effort of the University of Illinois at Urbana-Champaign and its National Center for Supercomputing Applications. The study was also made possible by the Petascale Computational Resource grant “The Computational Microscope,” which is supported by the National Science Foundation (grant No. OCI-0832673). All molecular graphics images were produced using the QUICKSURF (30) representation in the software VMD (31).
Appendix A: Effective Hamiltonian
The effective Hamiltonian of each light harvesting complex n is given by
| (6) |
where |i〉 represents the Qy excited state of pigment i, εi the excitation energy, and Vij the electronic coupling between pigments i and j. The pigments in LH1 and LH2 are bound to the protein in antialigned pairs, with the excitation energy of each pigment in a pair given by ε1 and ε2, the coupling between them by v1, and coupling between pigments in different pairs by v2. The non-nearest-neighbor interactions are approximated well by the induced-dipole coupling (43),
| (7) |
where di is the transition dipole of the Qy state of pigment i and rij is the vector from pigment i to pigment j. The parameters defining the effective Hamiltonians of LH2 and LH1 are presented in Table 1.
Table 1.
Parameters for LH2 and LH1 effective Hamiltonians (46,48)
| LH | ε1 (cm−1) | ε2 (cm−1) | v1 (cm−1) | v2 (cm−1) | di (Debye) |
|---|---|---|---|---|---|
| 2 | 12,457 | 12,653 | 363 | 320 | 8.3 |
| 1 | 12,710 | 12,710 | 377 | 806 | 6.3 |
The interaction Hamiltonian between two complexes n and m is given by
| (8) |
with the intercomplex coupling Vij given by Eq. 7 and parameters taken also from Table 1.
References
- 1.Blankenship R.E. Blackwell Science; Malden, MA: 2002. Molecular Mechanisms of Photosynthesis. [Google Scholar]
- 2.Fromme P. Wiley; New York: 2008. Photosynthetic Protein Complexes: a Structural Approach. [Google Scholar]
- 3.Blankenship R.E., Tiede D.M., Sayre R.T. Comparing photosynthetic and photovoltaic efficiencies and recognizing the potential for improvement. Science. 2011;332:805–809. doi: 10.1126/science.1200165. [DOI] [PubMed] [Google Scholar]
- 4.Strümpfer J., Sener M., Schulten K. How quantum coherence assists photosynthetic light harvesting. J. Phys. Chem. Lett. 2012;3:536–542. doi: 10.1021/jz201459c. [DOI] [PMC free article] [PubMed] [Google Scholar]
- 5.Şener M., Strümpfer J., Schulten K. Förster energy transfer theory as reflected in the structures of photosynthetic light-harvesting systems. ChemPhysChem. 2011;12:518–531. doi: 10.1002/cphc.201000944. [DOI] [PMC free article] [PubMed] [Google Scholar]
- 6.Noy D. Natural photosystems from an engineer’s perspective: length, time, and energy scales of charge and energy transfer. Photosynth. Res. 2008;95:23–35. doi: 10.1007/s11120-007-9269-7. [DOI] [PubMed] [Google Scholar]
- 7.Berera R., van Grondelle R., Kennis J.T.M. Ultrafast transient absorption spectroscopy: principles and application to photosynthetic systems. Photosynth. Res. 2009;101:105–118. doi: 10.1007/s11120-009-9454-y. [DOI] [PMC free article] [PubMed] [Google Scholar]
- 8.Scholes G.D., Fleming G.R., van Grondelle R. Lessons from nature about solar light harvesting. Nat. Chem. 2011;3:763–774. doi: 10.1038/nchem.1145. [DOI] [PubMed] [Google Scholar]
- 9.Şener M.K., Lu D., Schulten K. Robustness and optimality of light harvesting in cyanobacterial photosystem I. J. Phys. Chem. B. 2002;106:7948–7960. [Google Scholar]
- 10.Treutlein H., Schulten K., Michel H. Chromophore-protein interactions and the function of the photosynthetic reaction center: a molecular dynamics study. Proc. Natl. Acad. Sci. USA. 1992;89:75–79. doi: 10.1073/pnas.89.1.75. [DOI] [PMC free article] [PubMed] [Google Scholar]
- 11.McDermott G., Prince S.M., Isaacs N.W. Crystal structure of an integral membrane light-harvesting complex from photosynthetic bacteria. Nature. 1995;374:517–521. [Google Scholar]
- 12.Koepke J., Hu X., Michel H. The crystal structure of the light-harvesting complex II (B800-850) from Rhodospirillum molischianum. Structure. 1996;4:581–597. doi: 10.1016/s0969-2126(96)00063-9. [DOI] [PubMed] [Google Scholar]
- 13.Nelson N. Photosystems and global effects of oxygenic photosynthesis. Biochim. Biophys. Acta Bioenerg. 2011;1807:856–863. doi: 10.1016/j.bbabio.2010.10.011. [DOI] [PubMed] [Google Scholar]
- 14.Freiberg A. Coupling of antennas to reaction centers. In: Blenkenship R.E., Madigan M.T., Bauer C.E., editors. Anoxygenic Photosynthetic Bacteria. Kluwer Academic; Dordrecht, The Netherlands: 2004. pp. 385–398. [Google Scholar]
- 15.Allen J.P., Feher G., Rees D.C. Structure of the reaction center from Rhodobacter sphaeroides R-26: the cofactors. Proc. Natl. Acad. Sci. USA. 1987;84:5730–5734. doi: 10.1073/pnas.84.16.5730. [DOI] [PMC free article] [PubMed] [Google Scholar]
- 16.Deisenhofer J., Michel H. The photosynthetic reaction center from the purple bacterium Rhodopseudomonas viridis. Science. 1989;245:1463–1473. doi: 10.1126/science.245.4925.1463. [DOI] [PubMed] [Google Scholar]
- 17.van Brederode M.E., van Mourik F., van Grondelle R. Multiple pathways for ultrafast transduction of light energy in the photosynthetic reaction center of Rhodobacter sphaeroides. Proc. Natl. Acad. Sci. USA. 1999;96:2054–2059. doi: 10.1073/pnas.96.5.2054. [DOI] [PMC free article] [PubMed] [Google Scholar]
- 18.Xiong J., Fischer W.M., Bauer C.E. Molecular evidence for the early evolution of photosynthesis. Science. 2000;289:1724–1730. doi: 10.1126/science.289.5485.1724. [DOI] [PubMed] [Google Scholar]
- 19.Sener M.K., Jolley C., Schulten K. Comparison of the light-harvesting networks of plant and cyanobacterial photosystem I. Biophys. J. 2005;89:1630–1642. doi: 10.1529/biophysj.105.066464. [DOI] [PMC free article] [PubMed] [Google Scholar]
- 20.Scheuring S., Sturgis J.N. Atomic force microscopy of the bacterial photosynthetic apparatus: plain pictures of an elaborate machinery. Photosynth. Res. 2009;102:197–211. doi: 10.1007/s11120-009-9413-7. [DOI] [PubMed] [Google Scholar]
- 21.Sener M.K., Olsen J.D., Schulten K. Atomic-level structural and functional model of a bacterial photosynthetic membrane vesicle. Proc. Natl. Acad. Sci. USA. 2007;104:15723–15728. doi: 10.1073/pnas.0706861104. [DOI] [PMC free article] [PubMed] [Google Scholar]
- 22.Sener M., Strümpfer J., Schulten K. Photosynthetic vesicle architecture and constraints on efficient energy harvesting. Biophys. J. 2010;99:67–75. doi: 10.1016/j.bpj.2010.04.013. [DOI] [PMC free article] [PubMed] [Google Scholar]
- 23.Hu X., Damjanović A., Schulten K. Architecture and mechanism of the light-harvesting apparatus of purple bacteria. Proc. Natl. Acad. Sci. USA. 1998;95:5935–5941. doi: 10.1073/pnas.95.11.5935. [DOI] [PMC free article] [PubMed] [Google Scholar]
- 24.Caycedo-Soler F., Rodríguez F.J., Johnson N.F. Interplay between excitation kinetics and reaction-center dynamics in purple bacteria. New J. Phys. 2010;12:095008. [Google Scholar]
- 25.Caycedo-Soler F., Rodríguez F.J., Johnson N.F. Light-harvesting mechanism of bacteria exploits a critical interplay between the dynamics of transport and trapping. Phys. Rev. Lett. 2010;104:158302. doi: 10.1103/PhysRevLett.104.158302. [DOI] [PubMed] [Google Scholar]
- 26.Chandler D.E., Hsin J., Schulten K. Intrinsic curvature properties of photosynthetic proteins in chromatophores. Biophys. J. 2008;95:2822–2836. doi: 10.1529/biophysj.108.132852. [DOI] [PMC free article] [PubMed] [Google Scholar]
- 27.Chandler D.E., Gumbart J., Schulten K. Membrane curvature induced by aggregates of LH2s and monomeric LH1s. Biophys. J. 2009;97:2978–2984. doi: 10.1016/j.bpj.2009.09.007. [DOI] [PMC free article] [PubMed] [Google Scholar]
- 28.Phillips J.C., Braun R., Schulten K. Scalable molecular dynamics with NAMD. J. Comput. Chem. 2005;26:1781–1802. doi: 10.1002/jcc.20289. [DOI] [PMC free article] [PubMed] [Google Scholar]
- 29.Strümpfer J., Schulten K. Open quantum dynamics calculations with the hierarchy equations of motion on parallel computers. J. Chem. Theory Comput. 2012;8:2808–2816. doi: 10.1021/ct3003833. [DOI] [PMC free article] [PubMed] [Google Scholar]
- 30.Krone M., Stone J.E., Schulten K. EuroVis 2012 Short Papers. Computer Graphics Forum; Wiley, New York: 2012. Fast visualization of Gaussian density surfaces for molecular dynamics and particle system trajectories; pp. 67–71. [Google Scholar]
- 31.Humphrey W., Dalke A., Schulten K. VMD: visual molecular dynamics. J. Mol. Graph. 1996;14:33–38. doi: 10.1016/0263-7855(96)00018-5. 27–28. [DOI] [PubMed] [Google Scholar]
- 32.Scheuring S., Boudier T., Sturgis J.N. From high-resolution AFM topographs to atomic models of supramolecular assemblies. J. Struct. Biol. 2007;159:268–276. doi: 10.1016/j.jsb.2007.01.021. [DOI] [PubMed] [Google Scholar]
- 33.Niwa S., Yu L.-J., Miki K. Structure of the LH1-RC complex from Thermochromatium tepidum at 3.0 Å. Nature. 2014;508:228–232. doi: 10.1038/nature13197. [DOI] [PubMed] [Google Scholar]
- 34.Kwa L.G., Wegmann D., Braun P. Mutation of a single residue, β-glutamate-20, alters protein-lipid interactions of light harvesting complex II. Mol. Microbiol. 2008;67:63–77. doi: 10.1111/j.1365-2958.2007.06017.x. [DOI] [PMC free article] [PubMed] [Google Scholar]
- 35.Marinetti G.V., Cattieu K. Lipid analysis of cells and chromatophores of Rhodopseudomonas sphaeroides. Chem. Phys. Lipids. 1981;28:241–251. [Google Scholar]
- 36.Al-Bayatti K.K., Takemoto J.Y. Phospholipid topography of the photosynthetic membrane of Rhodopseudomonas sphaeroides. Biochemistry. 1981;20:5489–5495. doi: 10.1021/bi00522a022. [DOI] [PubMed] [Google Scholar]
- 37.Heijne G. The distribution of positively charged residues in bacterial inner membrane proteins correlates with the trans-membrane topology. EMBO J. 1986;5:3021–3027. doi: 10.1002/j.1460-2075.1986.tb04601.x. [DOI] [PMC free article] [PubMed] [Google Scholar]
- 38.van Klompenburg W., Nilsson I., de Kruijff B. Anionic phospholipids are determinants of membrane protein topology. EMBO J. 1997;16:4261–4266. doi: 10.1093/emboj/16.14.4261. [DOI] [PMC free article] [PubMed] [Google Scholar]
- 39.Mei, C., Y. Sun, …, C. Harrison. 2011. Enabling and scaling biomolecular simulations of 100 million atoms on petascale machines with a multicore-optimized message-driven runtime. In Proceedings of the 2011 ACM/IEEE Conference on Supercomputing, Seattle, WA. Association for Computing Machinery and IEEE Computer Society, New York.
- 40.Klauda J.B., Venable R.M., Pastor R.W. Update of the CHARMM all-atom additive force field for lipids: validation on six lipid types. J. Phys. Chem. B. 2010;114:7830–7843. doi: 10.1021/jp101759q. [DOI] [PMC free article] [PubMed] [Google Scholar]
- 41.MacKerell A.D., Jr., Bashford D., Karplus M. All-atom empirical potential for molecular modeling and dynamics studies of proteins. J. Phys. Chem. B. 1998;102:3586–3616. doi: 10.1021/jp973084f. [DOI] [PubMed] [Google Scholar]
- 42.Jorgensen W.L., Chandrasekhar J., Klein M.L. Comparison of simple potential functions for simulating liquid water. J. Chem. Phys. 1983;79:926–935. [Google Scholar]
- 43.Hu X., Ritz T., Schulten K. Pigment organization and transfer of electronic excitation in the purple bacteria. J. Phys. Chem. B. 1997;101:3854–3871. [Google Scholar]
- 44.Tanimura Y., Kubo R. Two-time correlation functions of a system coupled to a heat bath with a Gaussian-Markoffian interaction. J. Phys. Soc. Jpn. 1989;58:1199–1206. [Google Scholar]
- 45.Ishizaki A., Fleming G.R. Unified treatment of quantum coherent and incoherent hopping dynamics in electronic energy transfer: reduced hierarchy equation approach. J. Chem. Phys. 2009;130:234111. doi: 10.1063/1.3155372. [DOI] [PubMed] [Google Scholar]
- 46.Strümpfer J., Schulten K. Light harvesting complex II B850 excitation dynamics. J. Chem. Phys. 2009;131:225101. doi: 10.1063/1.3271348. [DOI] [PMC free article] [PubMed] [Google Scholar]
- 47.Strümpfer J., Schulten K. The effect of correlated bath fluctuations on exciton transfer. J. Chem. Phys. 2011;134:095102. doi: 10.1063/1.3557042. [DOI] [PMC free article] [PubMed] [Google Scholar]
- 48.Sener M.K., Hsin J., Schulten K. Structural model and excitonic properties of the dimeric RC-LH1-PufX complex from Rhodobacter sphaeroides. Chem. Phys. 2009;357:188–197. doi: 10.1016/j.chemphys.2009.01.003. [DOI] [PMC free article] [PubMed] [Google Scholar]
- 49.Strümpfer J., Schulten K. Excited state dynamics in photosynthetic reaction center and light harvesting complex 1. J. Chem. Phys. 2012;137:065101. doi: 10.1063/1.4738953. [DOI] [PMC free article] [PubMed] [Google Scholar]
- 50.Şener M., Schulten K. Physical principles of efficient excitation transfer in light harvesting. In: Andrews D.L., editor. Energy Harvesting Materials. World Scientific; Singapore: 2005. pp. 1–26. [Google Scholar]
- 51.Bahatyrova S., Frese R.N., Olsen J.D. Flexibility and size heterogeneity of the LH1 light harvesting complex revealed by atomic force microscopy: functional significance for bacterial photosynthesis. J. Biol. Chem. 2004;279:21327–21333. doi: 10.1074/jbc.M313039200. [DOI] [PubMed] [Google Scholar]
- 52.Fotiadis D., Qian P., Hunter C.N. Structural analysis of the reaction center light-harvesting complex I photosynthetic core complex of Rhodospirillum rubrum using atomic force microscopy. J. Biol. Chem. 2004;279:2063–2068. doi: 10.1074/jbc.M310382200. [DOI] [PubMed] [Google Scholar]
- 53.Roszak A.W., Howard T.D., Cogdell R.J. Crystal structure of the RC-LH1 core complex from Rhodopseudomonas palustris. Science. 2003;302:1969–1972. doi: 10.1126/science.1088892. [DOI] [PubMed] [Google Scholar]
- 54.Richter M.F., Baier J., Köhler J. Refinement of the x-ray structure of the RC LH1 core complex from Rhodopseudomonas palustris by single-molecule spectroscopy. Proc. Natl. Acad. Sci. USA. 2007;104:20280–20284. doi: 10.1073/pnas.0704599105. [DOI] [PMC free article] [PubMed] [Google Scholar]
- 55.Freiberg A., Godik V.I., Timpmann K. Picosecond dynamics of directed excitation transfer in spectrally heterogeneous light-harvesting antenna of purple bacteria. Biochim. Biophys. Acta. 1989;973:93–104. [Google Scholar]
- 56.Ritz T., Schulten K. Physics of photosynthesis [Physik der photosynthese] Physikalische Blaetter. 2001;57:49–53. [Google Scholar]
- 57.Escalante M., Maury P., Otto C. Directed assembly of functional light harvesting antenna complexes onto chemically patterned surfaces. Nanotechnology. 2008;19:025101. doi: 10.1088/0957-4484/19/02/025101. [DOI] [PubMed] [Google Scholar]
- 58.Escalante M., Lenferink A., Otto C. Long-range energy propagation in nanometer arrays of light harvesting antenna complexes. Nano Lett. 2010;10:1450–1457. doi: 10.1021/nl1003569. [DOI] [PubMed] [Google Scholar]
- 59.Cartron M.L., Olsen J.D., Hunter C.N. Integration of energy and electron transfer processes in the photosynthetic membrane of Rhodobacter sphaeroides. Biochim. Biophys. Acta Bioenerg. 2014 doi: 10.1016/j.bbabio.2014.02.003. [Epub ahead of print] [DOI] [PMC free article] [PubMed] [Google Scholar]