
Figure 4.
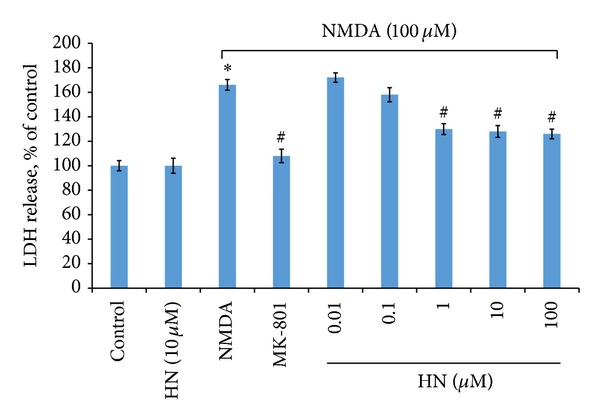
Effect of humanin on NMDA triggered LDH release in cultured cortical neurons. Each bar represents mean ± SEM of 5–8 independent observations. Statistical significance is at P < 0.05. F (8,64) = 3.023 and P = 0.006 after one-way ANOVA analysis in SPSS. ∗ represents control versus NMDA group (P = 0.028); # represents NMDA group versus NMDA + MK-801 group (P = 0.019) or NMDA + HN (Humanin) group. HN (0.01 μmol/L), P = 0.384; HN (0.1 μmol/L), P = 0.301; HN (1 μmol/L), P = 0.039; HN (10 μmol/L), P = 0.036; HN (100 μmol/L), P = 0.040. ∗ and # mean that there is statistical significance between control and treatment groups.