

Abstract
Obesity is a primary risk factor for numerous metabolic diseases including metabolic syndrome, type II diabetes (T2DM), cardiovascular disease and cancer. Although classically viewed as a storage organ, the field of white adipose tissue biology is expanding to include the consideration of the tissue as an endocrine organ and major contributor to overall metabolism. Given its role in energy production, the mitochondrion has long been a focus of study in metabolic dysfunction and a link between the organelle and white adipose tissue function is likely. Herein, we present a novel method for assessing mitochondrial bioenergetics from whole white adipose tissue. This method requires minimal manipulation of tissue, and eliminates the need for cell isolation and culture. Additionally, this method overcomes some of the limitations to working with transformed and/or isolated primary cells and allows for results to be obtained more expediently. In addition to the novel method, we present a comprehensive statistical analysis of bioenergetic data as well as guidelines for outlier analysis.
Keywords: Mitochondrion, White adipose tissue, Bioenergetics
Highlights
-
•
Obesity and metabolic disease affect 1/3 of the US population; incidence is rising.
-
•
WAT is emerging as an endocrine organ and major contributor to metabolism.
-
•
The relationship between mitochondria and white adipose tissue needs to be explored.
-
•
Current bioenergetics methods are limited to transformed or cultured primary cells.
-
•
A novel method for tissue preparation, data acquisition and analysis is presented.
Graphical abstract
Introduction
Metabolic syndrome is a growing epidemic in the United States and worldwide. Currently, approximately 34% of the US population are living with this diagnosis [1,2] and it is expected that this number will continue to increase. By 2030, it is anticipated that the financial burden of healthcare for patients requiring treatment for diabetes, heart and stroke will be $48–66 billion annually [3]. One of the hallmarks of metabolic syndrome is central obesity, an increase in visceral white adipose tissue (WAT) around the midsection. Central obesity not only contributes to metabolic syndrome but also increases individual risk for type II diabetes mellitus (T2DM) and cardiovascular disease (CVD) [4].
WAT has classically been viewed as a storage organ, containing metabolic substrates in the form of triglycerides as well as insulation and cushioning for the internal organs [5]. A more contemporary perspective that has surfaced over the last decade is one of WAT being an endocrine organ and a major factor in metabolism and homeostasis [6–9]. For example, in addition to triglyceride storage, WAT secretes numerous hormones and cytokines (adiponectin, leptin, TNF-a, etc.) [9]. Coupled with this viewpoint of WAT is the hypothesis that numerous cardiometabolic pathologies have mitochondrial dysfunction as a contributing factor [10–13]. Mitochondria are central to metabolism, yet prone to damage that can adversely affect their function [14,15]. The assessment of mitochondrial function in WAT has been identified as a key target for T2D and obesity [16] and current studies utilize both isolated adipocyte mitochondria [17], immortalized adipocyte cell lines [18], and isolated primary cells [19]. Isolation of mitochondria from WAT requires multiple steps and results in measures of organelle function in the absence of its native cellular environment. Also, functional measures of immortalized/isolated cells that have been manipulated to allow for multiple passages may substantially alter aspects of mitochondrial function. A method for direct assessment of mitochondrial function from whole WAT would provide an alternative or complementary approach for exploring adipose bioenergetics. In this regard, methods for mitochondrial bioenergetic measurement from whole adipose tissue have been previously reported [20,21] but have certain limitations in that certain parameters of mitochondrial function could not be defined.
A methodology herein is provided that utilizes minimal amounts of tissue and increased number of timepoint collections to ensure tissue equilibration. This approach allowed the measurement of additional parameters of mitochondrial function including ATP-linked, maximal oxygen consumption and reserve capacity. Additionally, a reproducible data filtering method was employed to account for among replicate variance often seen when analyzing whole tissue samples (relative to isolated cells or mitochondria), presumably due to differential absorptive properties of whole tissue versus isolated cells. Therefore, the utility of the methodology and approach presented should aide those interested in evaluating raw bioenergetic data obtained from whole tissues including WAT.
For these studies, mitochondrial bioenergetics was compared between two WAT depots, inguinal (iWAT) and epididymal (eWAT) from C57BL6/J mice; a mouse model classically used as a control for cardiovascular and metabolic disease studies.
Methods
Acquisition and preparation of adipose tissue
12-Week old male C57BL6/J mice were anesthetized by step-wise chloral hydrate overdose and euthanized via removal of the heart and exsanguination. The Institutional Animal Care and Use Committee (IACUC) of the University of Alabama at Birmingham approved all procedures involving animals. Inguinal (iWAT) and epididymal (eWAT) adipose depots were excised and placed in small petri dishes with “rinse media” comprised of DMEM with 25 mM glucose and 25 mM HEPES. Tissue was gently agitated to remove hair and blood and placed in clean rinse media. Each fat pad was sampled six times using a 2 mm UniCore Harris Punch (Whatman, Piscataway, NJ), resulting in 2 mg tissue samples. Attention was made to avoid any visible microvasculature during sampling and tissue punches were taken from the same section of tissue as close together as possible. Tissue punches were kept in fresh rinse media until application to an XF24 Islet Capture Microplate (Seahorse Bioscience, North Billerica, MA).
Application of tissue to assay plate
An XF24 Islet Capture Microplate Screen was loaded onto the Screen Applicator Tool and the tool was positioned with the screen facing up. A total of 4 mg of tissue (2 tissue punches) from each fat pad were placed onto the screen with forceps, resulting in three tissue replicates per fat pad. The screen was then snapped into the appropriate well of the Islet Microplate. Rinse media was added to each well after application of the tissue and screen. After applying all tissue samples and rinse media, each well was rinsed two additional times. After removal of the final rinse, running media (DMEM with 25 mM glucose and without HEPES) was added and removed to remove any remaining rinse media. Finally, 450 µL of running media was added to all sample and control wells.
Mitochondrial effectors
After a series of titration experiments for each mitochondrial effector, the following working concentrations were determined to elicit maximal responses: 8 µg/mL oligomycin, 8 µM FCCP (carbonyl cyanide p-trifluoromethoxyphenylhydrazone), 12 µM antimycin A (AA), and 3 µM rotenone (Rote). The effects of these mitochondrial inhibitors on oxygen consumption rate (OCR – pmol oxygen per minute) were assessed approximately 1?h after commencement of basal oxygen consumption measurements. After multiple test experiments, the number of basal measurements was increased to both allow for tissue settling and equilibration on the islet capture microplate.
XF24 Extracellular Flux Analyzer raw data output was transformed to OCR using the “Level (Direct) Akos” algorithm in a middle point mode, as previously described [22]. Cellular bioenergetic parameters including ATP- and non-ATP- linked oxygen consumption as well as maximal oxygen consumption and reserve capacity were calculated as previously described [23]. Briefly, ATP-linked oxygen consumption was calculated as the difference between basal oxygen consumption and OCR measured after the addition of oligomycin to inhibit complex V (ATP synthase). Non-ATP- linked oxygen consumption was the remainder of the basal OCR (minus the AA/Rote minimum rate which is defined as non-mitochondrial oxygen utilization). Maximal OCR was determined by subtracting the AA/Rote minimum reading from the maximal reading following addition of FCCP. Reserve capacity (or, spare respiratory capacity) is calculated by subtracting the basal oxygen consumption rate (respiration rate prior to addition of compounds) from the maximal oxygen consumption after the addition of FCCP (potential maximum respiratory capacity). It is hypothesized that reserve capacity exists as a compensation mechanism for cells when presented with increased workload or as a stress response [23]. A sample OCR trace from WAT is shown in Fig. 1.
Fig. 1.
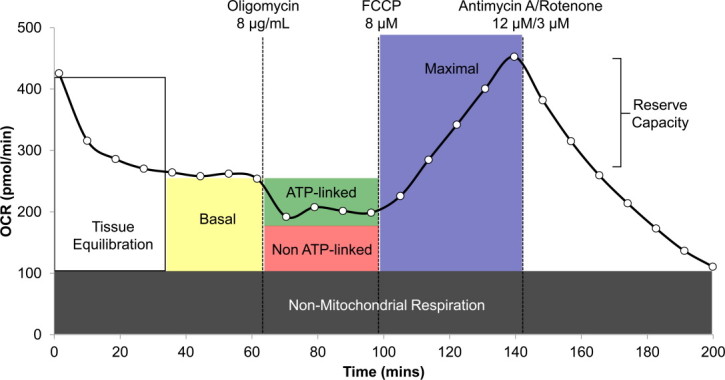
Example trace from a single XF24 well depicting oxygen consumption rate of C57 iWAT. Bioenergetic parameters including basal, ATP-linked and maximal oxygen consumption as well as reserve capacity are outlined on the trace with corresponding mitochondrial effectors.
Data summarization and exploratory observations
Raw OCR trace files were grouped according to eWAT and iWAT, and visualized using Microsoft Excel 2011. Trace data from each sample was divided into five time periods, from which seven OCR variables were calculated (basal, mitochondrial, non-mitochondrial, ATP linked, non-ATP linked, maximum, and reserve capacity) (Fig. 1). Each OCR measurement consisted of 3?min of mixing; 2?min wait time and 3?min of continuous measuring of O2 levels. OCR values corresponding to the equilibration period were ignored, due to physiological acclimation of the tissues to the well microenvironment. OCR values and slopes for each time period were summarized as the mean value across measurements, and the coefficient of least-squares regression, in order to assess the distribution of variance among samples.
Quality control
Exploratory observations of reserve capacity revealed a high degree of variance among OCR values within eWAT and iWAT data sets (Table 1). Reserve capacity was selected as the first variable to analyze as a result of the maximal oxygen consumption being the most discriminatory during analysis of experiment success. To test whether this variance represented biological (among sample) variance, or methodological imprecision (among replicates), single factor ANOVAs were conducted on both groups using individual mouse identification number as the explanatory categorical variable. For this and all subsequent statistical analyses, a significance level (a) of 0.05 was assumed. The ANOVA failed to detect a significant individual (mouse) effect on reserve capacity in the eWAT (p > 0.4) and iWAT (p > 0.4) groups (Fig. 2). The effect of well position on the XF-24 plate was also evaluated as a possible source of measurement bias, and an ANOVA was conducted on pooled trace data using well number as the explanatory variable. This analysis also failed to detect a significant effect on reserve capacity (p > 0.8). Together, the ANOVA results suggested that a majority of among-replicate variance in basal slope could not be explained by the well position on the XF-24 plate or variation among animals. Therefore it was surmised that the majority of observed variance is the product of some unanticipated source of methodological imprecision, which is a potential source of noise that may impede detection of real biological patterns.
Table 1.
Raw OCR data from eWAT and iWAT.
| eWAT | iWAT | Pooled | |
|---|---|---|---|
| N | 13 | 13 | 26 |
| Basal OCR | 168.66 ± 47.56 | 200.27 ± 102.32 | 184.46 ± 79.82 |
| Maximum | 287.28 ± 97.25 | 333.32 ± 178.42 | 310.3 ± 142.73 |
| Non-mitochondrial | 77.67 ± 32.45 | 103.53 ± 51 | 90.6 ± 43.91 |
| Mitochondrial | 209.6 ± 92.57 | 229.8 ± 155.74 | 219.7 ± 125.94 |
| Non-ATP-linked | 125.92 ± 44.94 | 158.84 ± 98.32 | 142.38 ± 76.76 |
| ATP-linked | 42.73 ± 35.28 | 41.43 ± 28.69 | 42.08 ± 31.51 |
| Reserve capacity | 118.62 ± 80.88 | 133.05 ± 90.24 | 125.84 ± 84.28 |
Description: Table summarizing comparison of mean OCR values between raw eWAT and iWAT composite trace data sets. Data represent mean ± standard deviation. All values in pmol/min.
Fig. 2.
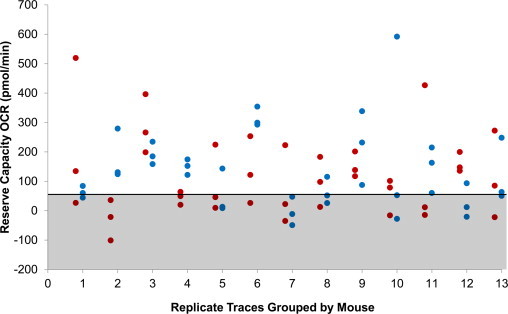
Reserve capacity as measured for replicate eWAT (hollow markers) and iWAT (filled markers) samples, grouped by mouse. No significant differences were found between individual mice. Samples within shaded area were omitted from analyses, following the head/tail breaks classification method of Jiang [25].
Consequently, it was necessary to filter data according to a classification method that would differentiate acceptable and unacceptable samples. Replicate traces for each mouse were ranked by reserve capacity, and pooled by rank (e.g. “maximum”, “median”, and “minimum”). Reserve capacity values were pooled according to rank to compare distribution parameters (symmetry, kurtosis, skew, etc.). Exploratory analyses identified a heavy tailed distribution and unacceptable coefficient of variation for pooled reserve capacity data, which was likely due to bias in the minimum group (Table 2). This suggested that a majority of samples with the lowest reserve capacity measurements were affected by nonrandom effects, interpreted here as interference from unidentified non-biological factors. Right skewed data presents a challenge for certain classification schemes, such as Jenk’s natural breaks, which seeks to decrease variance within replicates and maximize the variance between replicates, but is less sensitive to the hierarchy underlying heavy tailed data [24].
Table 2.
Relative variance and normality of raw and filtered data sets.
| N | Cv | PPCC | |
|---|---|---|---|
| Raw respiration data | |||
| Maximum | 26 | 0.61 | 0.97 |
| Median | 26 | 0.84 | 0.97 |
| Minimum | 26 | 1.84 | 0.96 |
| Filtered respiration data | |||
| Maximum | 24 | 0.55 | 0.96 |
| Median | 16 | 0.47 | 0.96 |
| Minimum | 9 | 0.47 | 0.94 |
Description: Table summarizing relative variance and normality compared between raw and filtered trace data setsCv – coefficient of variation and PPCC – normal probability plot correlation coefficient.
In contrast, a relatively new technique, head/tail breaks, is suitable for data with this distribution because it emphasizes differences among less frequent observations. The algorithm is described in detail by Jiang [25], but the concept is as follows. The mean value among the data set is used to partition the data into two parts (the “head” and “tail”), and the procedure is iterated until the head values are no longer heavy tailed. In this case, no further iterations were conducted after the mean and median of the head group differed by less than 10%. The second iteration effectively reduced right skew in the minimum and median rank groups, providing a reserve capacity cutoff value (58.11 pmol/min). Samples falling below this value were suspected to have been influenced by methodological imprecision and omitted from further analysis. Composite OCR traces (eWAT and iWAT) for each mouse was calculated using values averaged across the filtered data set. Composite traces were used in comparative analyses.
Comparison of OCR between fat pads and with other tissue types
When pooled across both fat pads, the mean reserve capacity (FCCP-basal) (204.96 ± 120.34 pmol/min) was lower than values reported for single muscle fibers [26], but similar to values reported for isolated brown adipocytes [27]. A two-tailed t-test assuming equal variance did not detect a significant difference between eWAT (204.9 ± 102.00 pmol/min) and iWAT reserve capacity (205.02 ± 142.89 pmol/min, p > 0.89) (Table 3).
Table 3.
Filtered OCR data from eWAT and iWAT.
| eWAT | iWAT | Pooled | |
|---|---|---|---|
| N | 12 | 11 | 23 |
| Basal OCR | 190.97 ± 57.65 | 221.43 ± 97.02 | 205.54 ± 78.63 |
| Maximum | 395.86 ± 131.33 | 426.45 ± 200.23 | 410.49 ± 164.59 |
| Non-mitochondrial | 75.28 ± 39.91 | 120.48 ± 57.31 | 96.9 ± 53.13 |
| Mitochondrial | 320.58 ± 122.40 | 305.97 ± 172.23 | 313.59 ± 145.02 |
| Non-ATP-linked | 145.1 ± 59.05 | 186.54 ± 85.01 | 164.92 ± 74 |
| ATP-linked | 45.87 ± 42.55 | 34.88 ± 24.22 | 40.62 ± 34.69 |
| Reserve capacity | 204.9 ± 102.00 | 205.02 ± 142.89 | 204.96 ± 120.34 |
Description: Table summarizing comparison of mean OCR values between filtered eWAT and iWAT composite trace data sets. Data represent mean ± standard deviation. All values in pmol/min.
In addition to these comparisons, it is important to note that looking at WAT in a disease state presents the unique challenge of macrophage infiltration wherein a large portion of adipose tissue may be macrophages [28]. Under these conditions, it is likely that OCR values will be significantly different than those where there is not an abundance of macrophages. Mounier et al. report OCRs that are orders of magnitude higher than those reported herein from WAT [29], even after those results were normalized to protein levels. This suggests that during initial screening of data, it will be evident that the dominant cell population in any particular well is not WAT, but is in fact inflammatory cells. Under these circumstances, it may be necessary to normalize bioenergetic data not only to an adipose tissue marker, but also a macrophage marker. Additionally, histological/immunohistochemical and gene expression analyses may also be warranted.
Discussion and conclusions
With obesity and metabolic disease incidence on the rise worldwide, a greater understanding of adipose tissue energetics and its contributions to whole body metabolism is needed. The goal of this study was to develop a reliable method for assessing mitochondrial bioenergetics from whole white adipose tissue by obtaining the greatest amount of information with a minimal amount of tissue.
Herein, we report the development of a method that allows the assessment of oxygen utilization in both visceral and subcutaneous adipose tissue in mice. In these analyses comparing bioenergetic profiles between fat pad tissues derived from C57BL6/J mice, we found no significant differences between tissues obtained from epididymal (visceral) and inguinal (subcutaneous) sources of fat. This result however is not surprising, as the animals used in this study were fed a standard chow diet and were considered lean at the time of tissue harvest. Since the animals did not have significant levels of WAT deposition and were not considered obese, the lack of variation between subcutaneous and visceral adipose tissue was not unexpected. It is possible that introducing additional variables such as a change in diet would alter the bioenergetics of WAT.
In circumstances where the adipose tissue is from a disease state, such as obesity, where the adipocytes are likely to be hypertrophic [30,31], an additional normalization would be required. Since larger cells (and therefore, fewer mitochondria) would comprise the same tissue explant, it is reasonable to assume that bioenergetics would be altered. In these cases, one could normalize all bioenergetic data to relative mtDNA copy number using a method described by Westbrook et al. [32]. The data described herein was normalized to relative mtDNA copy number, though copy number was not different between iWAT and eWAT of lean C57BL6/J mice (data not shown).
Additionally, the results presented herein represent one strain of laboratory mouse and consequently, are limited in scope. However, the primary aim of this study was to establish a method for assessing bioenergetics, and the method development was successful. The method presented herein is specific to iWAT and eWAT of lean, chow-fed C57BL6/J mice and should be interpreted as specific to both the strain of mouse and fat pad. All response rates were determined during titration and time-course experiments for each effector and the optimal number of measurements were determined and utilized in the final described method. These titration and time-course experiments (data not shown) allowed for stabilization of OCR after each effector was added. Once stabilization was observed, the time of stabilization was noted and the final method was shortened so experiments were not unnecessarily long. A lag is present after injection of oligomycin (see Fig. 1) to account for variation in stabilization time not observed with FCCP or Antimycin A/Rotenone. The authors recommend that both titration and time-course experiments for each effector be performed when using the method herein on any tissue or animal model other than iWAT/eWAT from lean C57BL6/J mice.
This method is distinct from previously published methodologies for whole adipose tissue bioenergetics. These changes included: (1) reducing the amount of tissue required per well from 10 to 2 mg in order to reduce sample consumption as well as increase the likelihood of saturating tissue with effectors after injection; (2) increasing the number of DMEM rinses prior to loading plate into XF24 to ensure removal of all free lipid released during application of tissue to microplate; (3) increasing the number of timepoints for both basal as well as post-injection measurements to allow for maximum tissue equilibration as well as permeation of effectors into tissue; and (4) increasing the concentration of all mitochondrial effectors used both to acquire an oligomycin-induced response previously unreported as well as to ensure robust response in response to other effectors. (5) Employing a reproducible data filtering method to account for among replicate variance in respiration rate.
We thought a more comprehensive and regimented approach for implementing data quality control prior to comparative analyses was necessary for these studies due to the anticipated degree of imprecision observed for whole tissue samples, likely reflective of the differential absorptive properties of intact adipose tissue plugs compared to those reported for studies using isolated cells or mitochondria. As this inconsistency could obfuscate biological differences among individuals and tissue types, a novel filtering method was used to eliminate unacceptable runs from the data set. In this study, reserve capacity was selected as the sample exclusion criterion, but the method could be applied to any measurement that exhibits unacceptable variance among replicates (e.g. basal OCR, ATP-linked OCR, etc.). All data filtering methods suffer from some degree of subjectivity or bias, and the approach used here is not intended to represent the ideal or universal technique. The head/tail breaks technique is conceptually transparent, easily reproducible, and particularly well suited to right skewed data. Therefore, respirometry researchers who obtain raw data with a comparable degree of unexplained variance among replicates should consider this filtering method before conducting comparative analyses.
Acknowledgments
This study was funded by NIH grants HL94518 (S.W.B.) and HL103859 (S.W.B.), an American Heart Association Predoctoral Fellowship 11PRE7650033 (K.J.D.) and NHLBI Post-Doctoral Training Grant 5T32HL072757 (M.W.S.). The authors thank Dr. Doug Moellering and theUAB Diabetes Research Center Bioanalytical Redox Biology Core (P60 DK079626).
References
- 1.Ervin R.B. Prevalence of metabolic syndrome among adults 20 years of age and over, by sex, age, race and ethnicity, and body mass index: United States, 2003–2006. National Health Statistics Reports. 2009;13:1–7. 19634296 [PubMed] [Google Scholar]
- 2.Roger V.L. Heart disease and stroke statistics—2011 update: a report from the American Heart Association. Circulation. 2011;123(4):e18–e209. doi: 10.1161/CIR.0b013e3182009701. 21160056 [DOI] [PMC free article] [PubMed] [Google Scholar]
- 3.Wang Y.C. Health and economic burden of the projected obesity trends in the USA and the UK. Lancet. 2011;378(9793):815–825. doi: 10.1016/S0140-6736(11)60814-3. 21872750 [DOI] [PubMed] [Google Scholar]
- 4.Wilson P.W. Metabolic syndrome as a precursor of cardiovascular disease and type 2 diabetes mellitus. Circulation. 2005;112(20):3066–3072. doi: 10.1161/CIRCULATIONAHA.105.539528. 16275870 [DOI] [PubMed] [Google Scholar]
- 5.Kuzawa C.W. Adipose tissue in human infancy and childhood: an evolutionary perspective. American Journal of Physical Anthropology. 1998;27(Suppl.):177S–209S. doi: 10.1002/(sici)1096-8644(1998)107:27+<177::aid-ajpa7>3.0.co;2-b. 9881526 [DOI] [PubMed] [Google Scholar]
- 6.Kershaw E.E., Flier J.S. Adipose tissue as an endocrine organ. Journal of Clinical Endocrinology and Metabolism. 2004;89(6):2548–2556. doi: 10.1210/jc.2004-0395. 15181022 [DOI] [PubMed] [Google Scholar]
- 7.Ahima R.S. Adipose tissue as an endocrine organ. Obesity (Silver Spring) 2006;14(Suppl. 5):242S–249S. doi: 10.1038/oby.2006.317. 1702137510996528 [DOI] [PubMed] [Google Scholar]
- 8.Wozniak S.E. Adipose tissue: the new endocrine organ? A review article. Digestive Diseases and Sciences. 2009;54(9):1847–1856. doi: 10.1007/s10620-008-0585-3. 19052866 [DOI] [PubMed] [Google Scholar]
- 9.Mohamed-Ali V., Pinkney J.H., Coppack S.W. Adipose tissue as an endocrine and paracrine organ. International Journal of Obesity and Related Metabolic Disorders: Journal of the International Association for the Study of Obesity. 1998;22(12):1145–1158. doi: 10.1038/sj.ijo.0800770. 9877249 [DOI] [PubMed] [Google Scholar]
- 10.Ballinger S.W. Mitochondrial dysfunction in cardiovascular disease. Free Radical Biology and Medicine. 2005;38(10):1278–1295. doi: 10.1016/j.freeradbiomed.2005.02.014. 15855047 [DOI] [PubMed] [Google Scholar]
- 11.Galloway C.A., Yoon Y. Mitochondrial morphology in metabolic diseases. Antioxidants and Redox Signaling. 2013;19:415–430. doi: 10.1089/ars.2012.4779. 22793999 [DOI] [PMC free article] [PubMed] [Google Scholar]
- 12.Aroor A.R. Mitochondria and oxidative stress in the cardiorenal metabolic syndrome. Cardiorenal Medicine. 2012;2(2):87–109. doi: 10.1159/000335675. 22619657 [DOI] [PMC free article] [PubMed] [Google Scholar]
- 13.Mercer J.R. DNA damage links mitochondrial dysfunction to atherosclerosis and the metabolic syndrome. Circulation Research. 2010;107(8):1021–1031. doi: 10.1161/CIRCRESAHA.110.218966. 20705925 [DOI] [PMC free article] [PubMed] [Google Scholar]
- 14.James A.M., Murphy M.P. How mitochondrial damage affects cell function. Journal of Biomedical Science. 2002;9(6 Pt 1):475–487. doi: 10.1159/000064721. 12372986 [DOI] [PubMed] [Google Scholar]
- 15.Wei Y.H. Oxidative damage and mutation to mitochondrial DNA and age-dependent decline of mitochondrial respiratory function. Annals of the New York Academy of Sciences. 1998;854:155–170. doi: 10.1111/j.1749-6632.1998.tb09899.x. 9928427 [DOI] [PubMed] [Google Scholar]
- 16.Medina-Gomez G. Mitochondria and endocrine function of adipose tissue. Best Practice and Research: Clinical Endocrinology and Metabolism. 2012;26(6):791–804. doi: 10.1016/j.beem.2012.06.002. 23168280 [DOI] [PubMed] [Google Scholar]
- 17.Wang T. Respiration in adipocytes is inhibited by reactive oxygen species. Obesity (Silver Spring, Md.) 2010;18(8):1493–1502. doi: 10.1038/oby.2009.456. 20035277 [DOI] [PMC free article] [PubMed] [Google Scholar]
- 18.Curtis J.M. Protein carbonylation and adipocyte mitochondrial function. Journal of Biological Chemistry. 2012;287(39):32967–32980. doi: 10.1074/jbc.M112.400663. 22822087 [DOI] [PMC free article] [PubMed] [Google Scholar]
- 19.Choo H.J. Mitochondria are impaired in the adipocytes of type 2 diabetic mice. Diabetologia. 2006;49(4):784–791. doi: 10.1007/s00125-006-0170-2. 16501941 [DOI] [PubMed] [Google Scholar]
- 20.Yehuda-Shnaidman E. Acute stimulation of white adipocyte respiration by PKA-induced lipolysis. Diabetes. 2010;59(10):2474–2483. doi: 10.2337/db10-0245. 20682684 [DOI] [PMC free article] [PubMed] [Google Scholar]
- 21.Sansbury B.E. Overexpression of endothelial nitric oxide synthase prevents diet-induced obesity and regulates adipocyte phenotype. Circulation Research. 2012;111(9):1176–1189. doi: 10.1161/CIRCRESAHA.112.266395. 22896587 [DOI] [PMC free article] [PubMed] [Google Scholar]
- 22.Gerencser A.A. Quantitative microplate-based respirometry with correction for oxygen diffusion. Analytical Chemistry. 2009;81(16):6868–6878. doi: 10.1021/ac900881z. 19555051 [DOI] [PMC free article] [PubMed] [Google Scholar]
- 23.Dranka B.P., Hill B.G., Darley-Usmar V.M. Mitochondrial reserve capacity in endothelial cells: the impact of nitric oxide and reactive oxygen species. Free Radical Biology and Medicine. 2010;48(7):905–914. doi: 10.1016/j.freeradbiomed.2010.01.015. 20093177 [DOI] [PMC free article] [PubMed] [Google Scholar]
- 24.Jenks G.F. The data Model concept in statistical mapping. International Yearbook of Cartography. 1967;7:186–190. [Google Scholar]
- 25.Jiang B. Head/tail breaks: a new classification scheme for data with a heavy-tailed distribution. Professional Geographer. 2013;65(3):482–494. [Google Scholar]
- 26.Schuh R.A. Mitochondrial oxygen consumption deficits in skeletal muscle isolated from an Alzheimer's disease-relevant murine model. BMC Neuroscience. 2014;15(1):24. doi: 10.1186/1471-2202-15-24. 24524276 [DOI] [PMC free article] [PubMed] [Google Scholar]
- 27.Sellayah D., Bharaj P., Sikder D. Orexin is required for brown adipose tissue development, differentiation, and function. Cell Metabolism. 2011;14(4):478–490. doi: 10.1016/j.cmet.2011.08.010. 21982708 [DOI] [PubMed] [Google Scholar]
- 28.Strissel K.J. Adipocyte death, adipose tissue remodeling, and obesity complications. Diabetes. 2007;56(12):2910–2918. doi: 10.2337/db07-0767. 17848624 [DOI] [PubMed] [Google Scholar]
- 29.Mounier R. AMPKalpha1 regulates macrophage skewing at the time of resolution of inflammation during skeletal muscle regeneration. Cell Metabolism. 2013;18(2):251–264. doi: 10.1016/j.cmet.2013.06.017. 23931756 [DOI] [PubMed] [Google Scholar]
- 30.Bjorntorp P., Gustafson A., Persson B. Adipose tissue fat cell size and number in relation to metabolism in endogenous hypertriglyceridemia. Acta Medica Scandinavica. 1971;190(5):363–367. doi: 10.1111/j.0954-6820.1971.tb07444.x. 5149263 [DOI] [PubMed] [Google Scholar]
- 31.Arner P., Spalding K.L. Fat cell turnover in humans. Biochemical and Biophysical Research Communications. 2010;396(1):101–104. doi: 10.1016/j.bbrc.2010.02.165. 20494119 [DOI] [PubMed] [Google Scholar]
- 32.Westbrook D.G. Perinatal tobacco smoke exposure increases vascular oxidative stress and mitochondrial damage in non-human primates. Cardiovascular Toxicology. 2010;10(3):216–226. doi: 10.1007/s12012-010-9085-8. 20668962 [DOI] [PMC free article] [PubMed] [Google Scholar]