

Abstract
The use of coherent X-ray lasers for structural biology allows the use of nanometre diameter X-ray beams with large beam divergence. Their application to the structure analysis of protein nanocrystals and single particles raises new challenges and opportunities. We discuss the form of these coherent convergent-beam (CCB) hard X-ray diffraction patterns and their potential use for time-resolved crystallography, normally achieved by Laue (polychromatic) diffraction, for which the monochromatic laser radiation of a free-electron X-ray laser is unsuitable. We discuss the possibility of obtaining single-shot, angle-integrated rocking curves from CCB patterns, and the dependence of the resulting patterns on the focused beam coordinate when the beam diameter is larger or smaller than a nanocrystal, or smaller than one unit cell. We show how structure factor phase information is provided at overlapping interfering orders and how a common phase origin between different shots may be obtained. Their use in refinement of the phase-sensitive intensity between overlapping orders is suggested.
Keywords: time-resolved diffraction, coherent convergent beam, phase determination, free-electron X-ray laser, coherent nanodiffraction
1. Introduction
With 7 nm-diameter coherent hard-X-ray beams demonstrated [1] and 100 nm beams in routine use now at X-ray lasers, such as the Linac Coherent Light Source (LCLS) [2], we consider here the properties of diffraction patterns obtained from nanocrystals by such a necessarily highly convergent beam (CB). Particular interest attaches to the question of whether the resulting angular integration over the crystal rocking curve (needed to obtain structure factors) is useful for time-resolved snapshot diffraction with a free-electron X-ray laser (XFEL), whose monochromatic radiation does not allow use of the normal Laue mode. Laue diffraction uses polychromatic radiation in the transmission geometry to integrate over the rocking curve for each reflection (figure 1). Cornaby et al. [3] have recently demonstrated Laue diffraction from Lysozyme crystals so small that only a single diffraction pattern may be obtained from them, providing full reflections. Currently, serial femtosecond crystallography (SFX) requires 10 000–100 000 indexed diffraction patterns for accurate structure factor ratios, a requirement which, with current liquid jet delivery technology and the LCLS XFEL pulse repetition rate of 120 Hz, wastes precious biological sample volume and limited experimental time. For time-resolved studies, this number of patterns is necessary for each time step. By integrating over entire Bragg reflections in a single shot, CB SFX would significantly decrease the required amount of sample and experimental time, which is crucial for time-resolved studies.
Figure 1.

Schematic comparing the (a) conventional Laue case (using a polychromatic beam) to the (b) convergent beam case (with beam divergence θC) in the context of using the thickness of the Ewald sphere (ES) to integrate full reflections in a single diffraction pattern. (Online version in colour.)
We also discuss differences in the patterns that result from the use of a coherent or incoherently filled illumination cone. We compare the cases where the beam diameter, in the transmission geometry, is larger or smaller than the crystal, and discuss the new features (related to ptychography) which arise when using a coherent beam which is smaller than a single unit cell, and the structure factor phase information contained in overlapping coherent diffraction orders in the projection approximation at low resolution.
2. The geometry of convergent beam X-ray diffraction
We consider first the simplest case where a cone of rays from an aperture converge onto a thin slab of perfect crystal much wider than the beam, in the transmission geometry. The beam may be focused to a point a small distance Δf from the sample, measured along the optic axis, and we take a sample-to-detector distance L. Where the aperture is coherently filled (CCB) and the sample not periodic, this geometry has a rich history, because it corresponds to the case originally analysed in detail by Gabor for inline, divergent beam holography (see [4] for a review). Then, because it produces a point-projection real-space shadow image with magnification M = L/Δf (potentially with nanometre resolution [5]), it solves the phase problem [6]. This arrangement of an aberrated spherical wave converging onto a sample has recently been analysed for X-ray radiation by Nugent et al. [7] in the projection approximation for non-periodic samples, and for crystals where the coherent Bragg orders do not overlap.
The case where the aperture can be treated as an ideally incoherent extended source of hard X-ray radiation has been discussed by Ho et al. [8] in their experiments using capillary optics for beam focusing. Figure 2 shows the general three-dimensional geometry for a single reflection g only. For a given camera length and wavelength, each pixel at the detector defines a momentum transfer Δk = ki − ko [9], which is equal to any reciprocal lattice vector g at the Bragg condition. Here, ki (|ki| = 1/λ) is an incident wavevector, defining one plane-wave component of the incident cone of illumination and one Ewald sphere (ES) orientation. For such a thick slab geometry, h Δk = h g is then the only allowed momentum transfer for a perfect crystal in the transmission geometry. With a small beam divergence, the resulting patterns show partial reflections. At synchrotrons, a goniometer is then used to rotate the crystal across the Bragg condition in order to obtain a full reflection and so extract structure factors. This cannot be done in the ‘diffract-and-destroy’ mode at an XFEL, so that thousands of snapshot diffraction patterns showing partial reflections must be summed from nanocrystals of different size in random orientations to provide the angular integration over the rocking curve. In figure 2, we note that the Bragg condition for reflection g is maintained as the crystal is rotated about OA, or, equivalently for a fixed crystal along points within the illumination aperture along BC, as the line BO is rotated about OA, generating points along BC at the source and B′C′ at the detector. A typical CB XRD pattern from a large crystal therefore consists of a set of short lines (spanning the source image), instead of spots, running normal to each reciprocal lattice vector, as shown in figure 3. We also see that a full reflection can now be obtained from a single shot by performing an integration across these lines during the data analysis. This suggests a more efficient way to undertake time-resolved diffraction. In protein crystallography, however, this geometry raises the problem of overlapping orders, and consequent auto-indexing difficulties, because overlapping reflections cannot be indexed.
Figure 2.

CCB XRD geometry in transmission, showing source DE, Ewald sphere ES and detector E′D′. Point source P fills illumination aperture DE coherently. Limiting Ewald sphere orientations (e.g. ES) are defined by marginal rays DO and EO. Plane-wave component K of converging spherical wave (with beam divergence θC) from midpoint of BC arrives at detector at midpoint of B′C′. Rotation of arrowed wavevectors originating along line BC about OA preserves the Bragg condition for reciprocal lattice vector g, defining line C′B′ at detector, along which the Bragg condition is satisfied, producing Bragg lines instead of spots. The disc E′D′ is an inverted image of ED.
Figure 3.
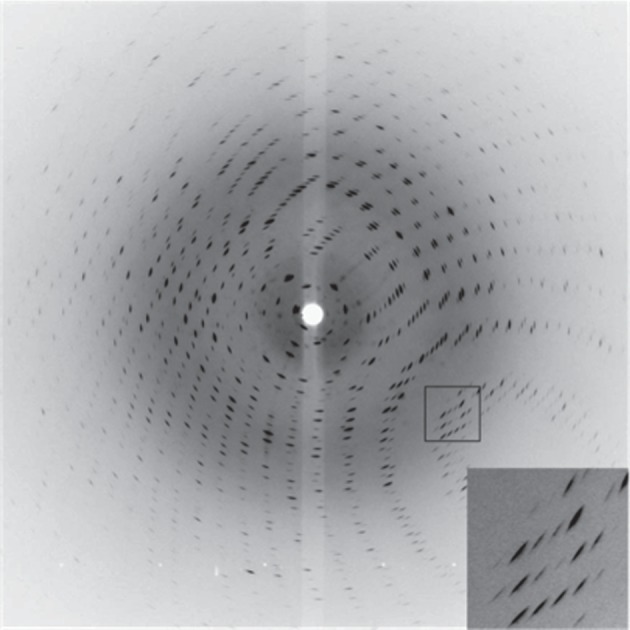
Typical experimental incoherent convergent-beam pattern from lysozyme, recorded using 38 keV X-rays. The 25 W laboratory source exposure time was 40 min (reproduced with permission from Ho et al. [8]).
For a crystal much larger than the beam, this CCB XRD geometry thus provides an angular view of the crystal rocking curve, and may do so in the many reflections which are near a Bragg condition simultaneously. Because a point at B within the illumination aperture gives rise to a point at B’, the patterns will be independent of the degree of coherence across the aperture. Provided the sample is a slab of perfect crystal much wider than the beam, an incident plane-wave can only give rise to a Bragg-scattered plane-wave, if inelastic processes and defect scattering are ignored, so that the degree of coherence between adjacent points in the effective source plane DE in figure 2 is unimportant. (Each point within DE defines a different incident plane-wave, and there is no interference between them at the detector). The coherence width in this plane is about λ/α, where α is the semiangle subtended on the optic axis in the effective source plane DE by an extended ideally incoherent physical source at P. In this case, coherent and ‘incoherent’ convergent-beam patterns from a parallel-sided slab sample should be identical. To obtain the smallest probes (formed as the image of a point), coherent diffraction-limited conditions must be used.
3. Coherent convergent-beam X-ray diffraction for finite crystals: coherence and the projection approximation
We consider now the case of CCB diffraction from a finite crystal of width W with cell constant a illuminated by a probe of diameter dp. We consider successively the cases where the beam is bigger than the crystallite dp > W, smaller (but bigger than one unit cell) W > dp > a, and finally a beam smaller than one unit cell dp < a. In each case, we are interested in the question of whether structure factors can be extracted from the data without using a goniometer to provide angular integration over the nanocrystal rocking curve, and how this depends on the coherence properties of the source, and the beam diameter. For the idealized case of a fully coherent XFEL using an ideal aberration-free lens, the focused beam is a diffraction-limited image of a point, so we could take dp ∼ 1.2 λ/θC (adapted from Rayleigh's criteria), with θC the beam divergence shown in figure 2. More detailed simulations would be needed to take account of the aberrations present in the Kirkpatrick–Baez mirrors or refractive optics actually used in practice, and the effective source size—we represent all these effects here by a wavefront aberration function.
For small beam divergence, by contrast to the case of a crystalline slab wider than the beam treated above, the diffraction pattern from a small crystal now depends on the source coherence conditions. If such a beam is wider than the nanocrystal, then one incident plane-wave component gives rise to a spread of scattering at the detector (the lateral nanocrystal shape transform), while scattering from an adjacent plane-wave component of the incident cone generates a displaced shape transform at the detector. The total intensity detected will then depend on whether these contributions are added coherently or incoherently, and hence on the degree of coherence at the illumination aperture, and so on the effective source size at P.
Figure 4a shows the charge–density map we have used in these simulations for photosystem II (PSII) nanocrystals, projected along the c axis (PDB entry 3ARC, a = 122, b = 228, c = 286 Å, α = β = γ = 90°). Also shown are five possible positions of a coherent XFEL beam, roughly drawn to scale. In this paper, in order to extract the essential principles of CCB XRD from nanocrystals, we initially treat only two-dimensional diffraction, and so adopt the low-resolution projection approximation, with a flat Ewald sphere, with beam along a major zone axis. The three-dimensional CCB case is treated in §9. Thus, only the Bragg reflections in the innermost disc of reflections are considered, in the zero-order Laue zone. For XFEL serial femtosecond snapshot (SFX) diffraction, the orientations of the nanocrystals are actually random. The projection approximation holds for that region around the origin of reciprocal space in which the Ewald sphere may be approximated by a plane passing through the origin. If the criterion for flatness is that the sphere should pass through the central maxima of shape transforms as measured along the beam direction, then resolution is limited to  [10], where t is the thickness of the nanocrystal, which is inversely proportional to the width of the shape transform. In that case, a projection of the crystal density is given directly by a Fourier series involving only structure factors for resolutions dhkl > dm, and the Ewald sphere curvature can be ignored. At larger thickness, it may be shown from the dynamical theory that the width of these ‘shape transforms’ for a perfect crystal tends to the inverse of the dynamical extinction distance, but is more likely to be determined by mosaicity for real crystals. For a nanocrystal of PSII, consisting of 10 unit cells on a side and hence thickness t = 286 nm, using 1 Å radiation, we have dm = 38 Å. Figure 4b shows such a low-resolution map of the projected density in this projection approximation, ρp(r) at 5 nm resolution, with r a two-dimensional vector.
Figure 4.

(a) Charge–density map for PSII nanocrystal consisting of 10 × 10 × 10 unit cells, 286 nm thick, projected along c, at 20 Å resolution (a = 122, b = 228, c = 286 Å, α = β = γ = 90°). This is used for simulations throughout this paper. Five possible X-ray beam positions are indicated, approximately to scale for a beam of dp = 244 Å diameter. (b) The same map at 50 Å resolution, again in the projection approximation. The circle indicates the diameter of a 60 nm X-ray beam. With 10 × 10 unit cells, the area of the nanocrystal is 122 × 228 nm. The yellow dashed rectangle indicates one unit cell. (Online version in colour.)
4. Beam larger than nanocrystal
For  , the essentially plane-wave illumination shows a set of lateral shape transforms laid down on each reciprocal lattice site, in accordance with the expression for nanocrystal XRD given by Kirian et al. [9]. We note that when contours of equal intensity are plotted on a plane containing the optic axis, the distribution of light for a beam at Gaussian focus is well collimated near the axis, so that a focused coherent beam need not be much wider than a nanocrystal to see the shape-transform effects described here. Under plane-wave illumination conditions, the diffracted photon flux I (counts per pulse) at Δk = ki − ko produced by the nth parallelepiped crystallite, consisting of N = N1 × N2 × N3 unit cells, is given in the kinematic theory as
 |
4.1 |
where F(Δk) is the structure factor of the unit cell. Jo is the incident photon flux density (counts per pulse per area) and ΔΩ is the solid angle subtended by a detector pixel. Here
 |
4.2 |
where θ is half the scattering angle, and α, β and γ define the crystal orientation as the angles which the scattering vector Δk makes with the directions of the real-space unit cell vectors a, b and c. Δk is defined by the position of the detector pixel and X-ray wavelength, and defines a point in reciprocal space where the Ewald sphere intersects the shape transform. re is the classical radius of the electron, equal to 2.82 × 10⁻⁵ Å. The X-ray radiation produced by the LCLS is plane polarized, so that the polarization factor for polarization along the unit vector u becomes P(ko) = 1 − |u ⋅ ko|2. An angular integration over the triple product in equation (4.1) is proportional to N1N2N3, and the volume of the crystal. At a Bragg condition, the triple product is equal to and the diffracted intensity is therefore proportional to the square of the number of electrons in the crystal. In the projection approximation, we take ki parallel to c, and Δkz = 0 with γ = 90° and Ψ3 = 0. Along Δkx with kz parallel to c, for small angles, we have Δkx ∼ 2θ/λ = 1/dhkl. Figure 5 shows the resulting diffraction pattern for this case where a wide beam runs along the c-axis of a PSII nanocrystal consisting of 10 × 10 unit cells for the 12.4 keV X-rays used throughout these simulations. The first minimum of intensity in the shape transform around each lattice site from the nanocrystal (shown inset) occurs at scattering angle 2θ = λ/W.
Figure 5.
Diffraction pattern from a 10 × 10 unit cell nanoxtal of PSII (286 nm thick) using 1 Å X-rays, with a small beam convergence forming a beam much wider than the crystal. Sinc function shape transforms are seen at each Bragg condition. Shape transforms are clearly seen. Inset shows two-dimensional sinc function shape transform at (−110) Bragg spot. (Online version in colour.)
The extraction of structure factors, which requires an angular integration across these shape transforms from a large number of randomly oriented nanocrystals, is described in detail in Kirian et al. [11] and White et al. [12], using a Monte Carlo approach for the three-dimensional case. This approach to time-dependent protein crystallography, using the pump–probe method, has been successfully demonstrated for submicrometre-sized photosystem I—ferredoxin cocrystals [13], and more recently for atomic-resolution imaging of a static structure for the enzyme cathepsin B [14].
5. Beam smaller than crystal
We model the incident X-ray beam by a probe function
| 5.1 |
with c a normalization constant and J1(x) a Bessel function. A beam divergence of θc = 1 mrad (smaller than the Bragg angle) corresponds to a probe whose radius is rp = 0.6 λ/θ = 60 nm (with Gaussian damping to 50 nm). In the weak-phase object projection approximation, the sample exit face wave function is then, for a focused beam centred at two-dimensional coordinate R, expressed as
| 5.2 |
with ρp(r) the two-dimensional electron density projected in the beam direction. This expression, based on a first-order expansion of the phase-shift introduced by X-ray traversing a thin crystal, is widely used in the soft-X-ray community [15]. The diffraction pattern amplitude is obtained by two-dimensional Fourier transform of Ψe. The relationship between this expression to equation (4.1) can be understood from a comparison of the Born series [16], giving equation (4.1), with the Moliere high-energy approximation [17]. These can be shown to agree in their predictions for the beam-energy-dependence of the total scattered energy per pulse per particle, which is proportional to the square of the X-ray wavelength for both hard and soft X-rays, because the factor λ in equation (5.2) (not present in the first Born approximation) cancels with a prefactor 1/λ in the Kirchoff diffraction integral, applied to equation (5.2). Forward scattering is fixed by the number of electrons per sample, independent of wavelength, whereas the area of scattering at the detector is proportional to (λ/D)2 for a particle of size D, giving an overall λ2 dependence for coherent scattering from a dielectric sphere. Equation (5.2) does, however, predict correctly a ninety degree phase shift between direct and scattered X-rays, which is not present in the Born approximation, owing to differing treatments of boundary conditions. We note that Darwin's formula for Bragg diffraction from a bulk crystal [18], when integrated across the rocking curve, predicts a stronger λ3-dependence of scattered intensity on beam energy because it treats a bulk crystal, does not make the projection approximation made above, and treats full rather than partial reflections.
In decisions concerning the maximum beam energy for future XFEL designs, this rapid fall-off in scattered intensity with increasing beam energy must be combined with the dependence of the incident XFEL fluence per shot on beam energy (often decreasing), together with cost estimates to determine a cost/benefit ratio for scattering experiments. In general, because XFEL cost may be proportional to electron accelerator energy (which vary from a few GeV for soft X-rays to perhaps 18 GeV for hard), we see that costs explode, whereas useful scattering plummets, with increasing X-ray energy. The minimum energy for which protein crystallography can be supported, so that the wavelength does not limit resolution may be about 5 keV (λ = 0.25 nm), using wide-angle detectors, whereas lower energies are now of considerable interest for time-resolved spectroscopy and phasing experiments which use absorption by atomic species native to proteins.
Within these approximations, the coherent diffraction pattern amplitude for a small beam centred at R on a nanocrystal can be written
 |
5.3 |
where  and
and  are two-dimensional Fourier transforms of Ψp and ρp respectively, and ⊗ denotes convolution. We see here how, in general, at each lattice site we can expect to see the circular diffraction discs described by
  convoluted with the Fourier transform of the external nanocrystal shape. The diffracted intensity is
  . For a beam much smaller than the size of the nanocrystal, the pattern becomes insensitive to the crystal boundaries, and the pattern becomes identical to that from a laterally infinite slab illuminated by a highly convergent coherent beam. Such a pattern is shown simulated, based on equation (5.3), in figure 6. A large computational superlattice of side L has been used with the density in figure 4, where L is much larger than the nanocrystal width W and probe size dp. Here, we use L ∼ 5 W. The extraction of structure factors in this case is straightforward, requiring only an integration over the area of the diffraction discs.
Figure 6.

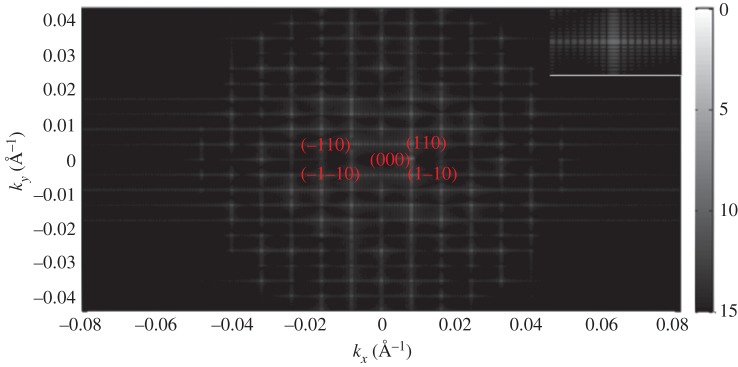
Simulated coherent convergent-beam (CCB) diffraction pattern from 10 × 10 unit cell nanocrystal of PSII, with convergence semiangle θC = 1 mrad = 0.45θB, defocus Δf = 0, probe at centre of nanocrystal, probe size approximately 500 Å, larger than unit cell but smaller than crystal. Shape transforms are not seen and diffraction discs do not overlap. Each diffraction disc is an image of the illumination aperture DE in figure 2 at low resolution where the projection approximation holds, so that the shape transform is constant along the beam direction. (Online version in colour.)
6. Beam at edge of nanocrystal
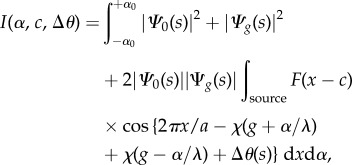
Another important practical case arises in snapshot diffraction when a beam smaller than a nanocrystal strikes the edge of the crystal, as for position B in figure 4a. Figure 7 shows a simulation for this case. Earlier work for the analogous scanning transmission electron microscope case had shown the development of ‘spot-splitting’ of annular intensity distributions for a probe spanning the edge of a nanocrystal [19]. The orientation of the splitting usefully gives the direction of the crystal boundary relative to the crystal lattice. It may also be useful for the analysis of planar defects, because planes that are unaffected by such a defect produce unsplit CCB discs, whose indexing gives the orientation of the planar fault [6]. While no reflected X-ray intensity from the side of the crystal can be present within this projection approximation, we do see diffuse scattering from the edge, convolved coherently with the diffraction discs, producing the smeared discs seen in figure 7. The direction of the smearing gives the orientation of the edge of the nanocrystal. Unlike the previous case, the diffracted intensity now depends explicitly on the beam position. This smearing effect may modify all reflections equally. Figure 8a shows a plot of the ratio of the total intensity within the first- and second-order discs as the beam runs from the centre to the edge of the crystal along the a-axis direction (from A to B in figure 4a), compared with the true ratio of these structure factors. Incorrect values, differing by more than 10% from the correct value, start to appear when the beam is 4 diameters from the edge. The error is least with the smallest beam divergence shown. Figure 8b shows a similar plot for beam movement from the centre of the nanocrystal along the b-axis direction. At the larger beam divergence shown, the coherent orders now overlap with the larger period b. The oscillations result from the variation in intensity within the regions where the CCB discs overlap. At smaller beam divergence, the ratio remains approximately correct.
Figure 7.
PSII CCB diffraction pattern with convergence semiangle θC = 2 mrad = 0.9θB, defocus Δf = 0, probe size approximately 500 Å, Gaussian cut-off σ = 500 Å. Probe spans edge of long side of crystal at B in figure 4a.
Figure 8.
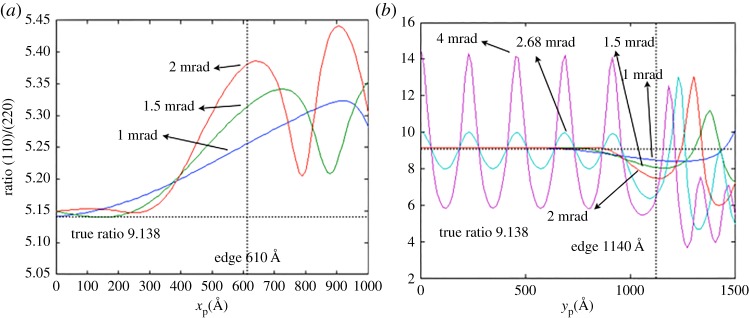
Ratio of total intensity within (110) to (220) Bragg discs as a function of beam position as it scans from the centre of nanocrystal (xp = 0 Å) to the edge. The ratio approaches the correct value 9.138 when the beam is well within the crystal. (a) Probe scans along the a-axis direction from centre (xp = 0 Å) to the edge (xp = 610 Å; from A to B in figure 4a), convergence semiangle was set to be θC = 1 mrad, 1.5 mrad and 2 mrad, Gaussian cut-off σ = 500 Å. (b) Probe scans along the b-axis direction from centre (yp = 0 Å) and across the edge (yp = 1140 Å), convergence semiangle was set to be θC = 1 mrad, 1.5 mrad, 2 mrad, 2.68 mrad and 4 mrad, Gaussian cut-off σ = 50 nm. (Online version in colour.)
7. Beam smaller than unit cell
In order to form a diffraction-limited coherent beam whose width is about equal to the unit cell dimension, it is necessary to use a beam divergence comparable to the Bragg angle in which case the diffraction discs start to overlap and interfere. The beam width is then much smaller than the nanocrystal, so that ‘shape transforms’ are not seen in the diffraction pattern, which consists of overlapping coherent Bragg discs with sharp edges. Each disc is an image of the ‘pinhole’ illumination aperture. Each incident plane-wave gives rise to an outgoing scattered plane-wave. This arrangement was proposed by Hoppe [20] (as ptychography) for phase determination in electron microscopy, and a related analysis, based on the use of Wigner distributions, has been given by Chapman [21] for experimental soft X-ray diffraction patterns. To understand this arrangement, we set the expression for the radius of the beam diameter, rp = 0.61 λ/θc, equal to the period of the lattice b = λ/(2θB), as shown in figure 9. This gives
| 7.1 |
as the condition which makes the radius of an ideal diffraction-limited coherent beam (approximately equal to its full width half maximum) equal to the lattice constant, so that the spacing between zeros of the beam (equation (5.1)) is 2b = 45.6 nm. With overlapping orders, we see in figure 10 (with beam direction drawn to the right) that there are now two interfering contributions to the detector intensity at D along paths BMD and AMD, differing by Bragg diffraction at the sample. This interference produces fringes across the overlap region.
Figure 9.

Relative sizes of beam, unit cell and diffraction discs, for PSII in the case where 22% overlap of orders makes the radius of the beam just equal to the period of the crystal. Upper right inset shows the corresponding diagram of the diffraction discs, with three intensity regions A, B, T, from which intensities IA, IB and IT may be used to determine two structure factors, their sum and phase difference. This condition requires θc = 2.7 mrad = 1.22 θB, defocus zero, Gaussian cut-off σ = 50 nm at beam energy of 12.4 kV. (Online version in colour.)
Figure 10.

With overlapping orders, there are two interfering contributions to the intensity at the detector point D along paths BD and AMD, differing by Bragg diffraction. The overlap intensity is then sensitive to both the beam coordinate and the beam optics aberrations, whereas the intensity outside the overlap region is not.
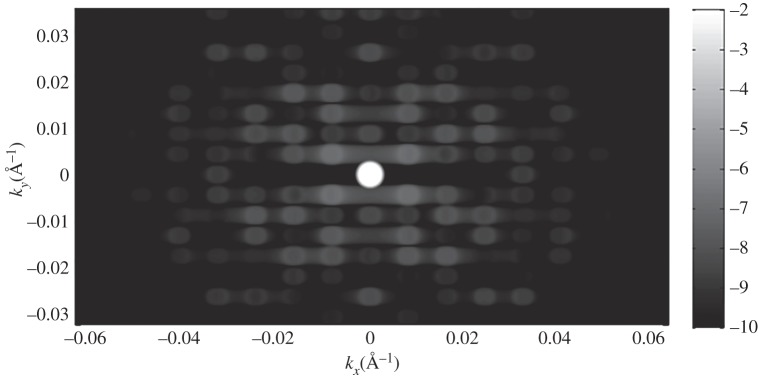
This effect can be understood in a simpler manner, as shown in figure 11 (beam running to the right) where the beam is now defocused to a point S upstream of the sample, so that diverging Bragg cones are kicked off to the side. These will then define, by rearward asymptotic extension of rays, additional virtual point sources S′, each coherent with the original and lying on reciprocal lattice sites. These sources then generate an atomic-resolution shadow image of the crystal within the overlap region, magnified by L/Δf. (see Spence [10] for a review and experimental examples of dramatic interference fringes between overlapping orders). Figure 12 shows a simulation of patterns similar to figure 6 for this case where the beam is about equal to the unit cell dimensions, and orders overlap. The interference fringes are found to reverse contrast as the beam is moved by half the unit cell distance. The patterns have the following features.
(1) The overlapping interference fringes depend on beam position (unlike the previous cases with beam smaller than crystal but bigger than cell, unless it strikes the edge). The intensity outside the overlap region does not depend on beam position.
(2) For just two overlapping orders, the overlap intensity distribution is sinusoidal across the detector. At much larger beam divergence, when all orders overlap at the centre of the detector, the pattern becomes a faithful point-projection image of the projected crystal structure. (If an image could be read out using a small point detector on the axis as the beam is scanned, the result would be an atomic-resolution STXM image. This is consistent with the principle of reciprocity, relating bright-field scanning (STXM) and full-field imaging.)
(3) The intensity in the overlap region depends also on focus setting and the aberrations of the beam-forming optics. At the midpoint of the overlap, the intensity is independent of all even-order aberrations and focus setting on this ‘achromatic circle’, where aberration phase-shifts cancel.
(4) As the beam becomes smaller than the cell, with increasing beam divergence, information on the translational symmetry of the crystal is progressively lost, as it becomes increasingly difficult to identify the reciprocal lattice points from the centres of the discs. What remains is a pattern that accurately reflects the point group symmetry of the crystal structure as reckoned about the centre of the beam location.
(5) Where these adjacent coherent orders overlap and interfere they contain information on the phase difference between structure factors, and so might be used to solve the phase problem, as we now discuss.
Figure 11.

Ray diagram showing the formation of virtual sources S‘ when the X-ray beam is focused upstream of the sample, by rearward asymptotic extension of Bragg CCB cones. This array of coherent virtual point sources lie on the reciprocal lattice for the crystal and so produce interference fringes at the detector in the form of a real-space image of the crystal. The magnification is approximately L/Δf.
Figure 12.

CCB XRD pattern from 10 × 10 unit cell nanocrystal of PSII, with convergence semiangle θC = 4 mrad = 1.82θB, defocus Δf =−150 000 Å, Gaussian cut-off σ = 500 Å, probe at centre of nanocrystal, probe size smaller than unit cell (resolution limit 20 Å). Sinusoidal interference fringes are clearly seen in overlap region between discs which form a point-projection real-space image of the crystal structure. Inset is shown the diffraction geometry needed for phase determination with common origin between shots, using the closed loop (0, h, g) which is rotated by 90° with respect to the simulated pattern.
We consider the extraction of structure factors and phases from these patterns. For the case when many such patterns with overlapping orders are collected with the beam in random positions, the Monte Carlo method is an average over the interference fringe intensity with respect to beam position. If only adjacent orders overlap, then the fringe intensity in the overlap region between beams Ψ0 and Ψg is, for a single shot [22]
 |
7.2 |
or
where α0 is the detector pixel angular size, and x/a is the fractional beam coordinate within the cell. F(x) is a source intensity distribution function (assumed to be ideally incoherent) to allow for partial coherence of the X-ray beam, and c is the coordinate of the beam centre. Δθ is the phase difference between structure factors for the two adjacent reflections. α is the angular deviation from the Bragg condition g, whereas χ represents the aberration function of the probe-forming optics. Here, s = |g|α is an ‘excitation error’ parameter that defines the orientation of the incident beam around the Bragg condition and is a measure of deviation from the exact Bragg condition. For a sufficiently thin and wide nanocrystal, the intensity of the Bragg beam does not vary appreciably across the diffraction discs (the rocking curve), and we may ignore the dependence of Ψ and Δθ on s. If we also ignore all aberrations except a focusing error, then the aberration function takes the following form:
| 7.3 |
where Δf is the defocus of the probe-forming system. Combining equation (7.2) and equation (7.3), and assuming a point source and detector pixels of negligible size, we obtain
 |
7.4 |
where the period of the fringes in scattering angle α across the detector in the region of overlap is Θ = 1/(2 Δf g) = a/(2Δf), if the first-order d-spacing is a. The period of these fringes X = 2 L Θ = L a/Δf = Ma measured using a coordinate on the detector at distance L from the sample is then seen to be consistent with the geometrical shadow image model shown in figure 11, where the geometrical magnification is also M = L/Δf. Our full simulations (figure 12) agree with these predictions; for example, at exact focus Δf = 0, the magnification goes to infinity, and no fringes are seen.
For a diffract-then-destroy experiment with random beam positions within the unit cell for each shot, the indexed and merged data will provide a Monte Carlo sum over all beam positions c. The last term IC in equation (7.4) is then zero, and the integrated intensity within the overlapping region is the same as it would be for incoherent illumination, being proportional to the sum of the squares of the two adjacent structure factors. Three regions of overlapping orders are shown in the inset in figure 9. We see that by making angle-integrated intensity measurements of the quantities IA, IB and IT, after summing over beam positions, we can obtain the individual structure factors and their sums. For a two-dimensional pattern, each structure factor intensity IA will be linked to four neighbours, and these measured nearest-neighbour structure factor sums can then be used as constraints in refinement, or in phasing by molecular replacement.
8. Phase information in overlapping coherent orders
The field of ptychography has developed rapidly lately for non-periodic samples, using electron, X-ray and optical microscopy. This method of lens-less imaging is based on the analysis of a large number of coherent microdiffraction patterns recorded from regions for which the incident coherent beam overlaps with its previous scan position [23]. In its original form, it was developed as a solution to the phase problems for thin organic crystal in electron microscopy [20]. In that case, structure factor phases can be obtained if the coherent convergent-beam orders overlap, as shown by Spence [24] and, with experimental soft X-ray patterns, by Chapman [21]. We consider here briefly how this method might be applied to diffract-and-destroy data from protein nanocrystals where the beam hits random positions within the cell. Because of the narrow rocking curve for larger crystals and long extinction distance, significant intensity can only be expected in the region of overlap between reflections within the projection approximation for high X-ray energies, at low scattering angles, and for very thin nanocrystals, so that the method might at best provide a low-resolution phased map of electron density.
If we neglect the aberrations of the X-ray optical system, assume complete spatial coherence and neglect effects of finite detector pixel size, and consider a simple one-dimensional line of low-order diffraction discs, then measurements of IA, IB and IT allow equation (7.4) to be inverted. This gives
| 8.1 |
where ϕ is the argument of the cosine function in equation (7.4), and I(α, c,Δθ) = IT is the intensity in the overlapping regions, which depends on beam coordinate c within the unit cell. At the midpoint of the overlap (the Bragg condition if the beam is aligned along a zone axis), α = 0. By fitting sinusoids to the fringes at several overlaps (figure 12), one may form linear plots of ϕ(x) = Ax + Δθ, with x the probe coordinate, where the intercept gives successive phase differences between structure factors. However, the fractional probe coordinate within the cell is not known and takes random values with each shot. For a given choice of origin (beam position within the unit cell), individual structure factor phases may be found along a line of overlapping reflections. However, the phase origin is different for each shot, so the phases determined from each shot must be related, which may be achieved as follows.
We consider three reflections 0, h, g at the corners of a triangle, as shown inset in figure 12, with overlapping orders. Around any closed loop in reciprocal space, the sum of the phase differences between successive reflections is zero, so that only the phase term owing to the beam position accumulates. This allows the fractional coordinate of the beam within the unit cell to be determined for each shot, and so defines the phase origin for each shot. Then, for the geometry inset in figure 12, phase differences may be determined along the line of reflections shown. The individual structure factor phases are then fixed if the first can be determined. (In protein crystallography, this value can normally be set to zero as one of four origin-fixing phases; however, in our case, the origin is fixed by the beam position). For small proteins, however, the theory of direct methods for the necessarily non-centrosymmetric case of proteins [25] gives the sum of phases for three-phase invariants (whose lattice vectors sum to zero) as probably zero (modulo 2π). Applying this result in one dimension along the line of reflections shown in figure 12 (inset, for example to the reflections with one-dimensional indices 1, 2, −3) then provides enough information to find the first phase, and hence all of them. This process may be repeated for each shot, to provide phases referred to a common origin for all shots. Alternatively, one may just use the differences between phase differences Δθ, which provide certain sums of phases which are independent of phase origin (beam position), and so may be used as constraints when phasing by other methods. Patterns from the same nanocrystal orientation might also be sorted by beam position, by comparing the registration of the sinusoids in the overlap region. Finally, this phase-sensitive intensity within the overlap region may simply be used as part of the overall refinement process against models, leading to much more accurate refinement. (This is analogous to the use of multiple scattering in refinement, which also renders scattered Bragg intensities sensitive to structure factor phases [26]).
Because the cosine function is even, however, an ambiguity in the sign of Δθ exists. It is remarkable that ptychography can resolve this ambiguity, by using the dependence of IT on beam position. Here, we show how this occurs in this highly simplified case—the information needed is thus provided for more sophisticated iterative algorithms [27] which might be used for these nanocrystal patterns. Without loss of generality, we assume the initial measurement of |Δθ| is small, and that a second measurement can be made with a new beam position which, from equation (7.2), increases the total phase difference measured. Then, for the positive solution for Δθ obtained from the previous reference beam position, this increase in phase will reduce the scattered intensity IT at the midpoint, according to equation (7.2). For the negative solution, the same probe movement will make the solution less negative, and hence increase the midpoint intensity. By comparing these predictions with the observed intensity change when the beam is moved, the sign ambiguity may be removed.
It is a remarkable feature of this method that the beam needs only to be as wide as the period of the crystal; nevertheless, much finer periodicities can be phased. Mechanical stability and broadening of the beam is not an issue with snapshot methods.
9. Convergence of coherent convergent-beam data for partial reflection integration
Finally, we return to the main aim of the paper, to determine whether full reflections can be measured for time-resolved pump–probe diffraction using monochromatic snapshot stills and a CB. We simulated 225 000 snapshot diffraction patterns from PSII microcrystals in random orientations (in three-dimensions) for XFEL beams with convergence angles of 0.0, 0.5, 1.0, 1.5, 2.0 and 2.5 mrad. These angles were chosen to be below θc = 2.68 mrad (defined in equation (7.3)), to avoid overlapping reflections.1
These partial intensities were simulated using partial_sim from the CrystFEL software suite [12], with structure factors simulated from a model of PSII (PDB entry 3ARC) with ano_sfall.com [29], which primarily uses sfall from the CCP4 suite [30]. The standard deviation of the distribution of overall intensity scaling factors2 was set to 2.0, and the standard deviation of the Gaussian noise added to the simulated partial reflections was set to 20.0 ADU. The XFEL beam energy was 12.398 ± 0.012 keV with a fluence of 1012 photons per pulse for all convergence angles. The Bragg spot profile size, which roughly corresponds to the inverse of the crystal size [12], was 0.001 × 10⁹ m−1. The simulated detector had 800 × 800 pixels, each 110 × 110 µm2, set at a distance of 20 cm from the interaction region giving a resolution of 4.6 Å at the side and 3.3 Å in the corner.
For a beam with a convergence angle of 2.5 mrad compared with a beam with no convergence, we observe an improvement in the internal consistency of the merged diffraction data as quantified by a reduction in Rsplit by a factor of about 2 (figure 13a). Rsplit, defined as [31]
Figure 13.
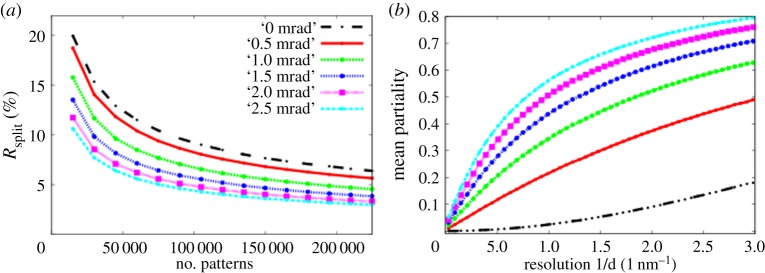
(a) Rsplit (defined in White et al. [31]) plotted against the number of merged diffraction patterns for several beam divergence values. The data converge more rapidly with larger beam divergence. (b) Mean partiality of the reflections plotted against resolution for several beam divergence values. More complete reflections are collected as beam divergence and resolution increases. (Online version in colour.)
| 9.1 |
quantifies the internal consistency of the dataset by comparing reflection lists calculated from (a Monte Carlo integration of) the even- and odd-numbered diffraction patterns, separately. Figure 13b shows the mean partialities of reflections in each resolution shell for each convergence angle, showing the increase in partiality with beam divergence and resolution, as expected. Partialities were calculated as the volume fraction of a spherical Bragg reflection that intersects the Ewald ‘wedge’ formed by the convergent X-ray beam as described in fig. 3 in White et al. [12].
We also simulated snapshot diffraction patterns from crystals that were an order of magnitude larger, wherein the partialities were significantly higher, because the spherical Bragg reflection model was correspondingly smaller (results not shown). However, owing to this decrease in Bragg spot size, the multiplicity of the reflections was significantly lower from the same number of merged patterns, leading to a large increase in Rsplit, which indicates that multiplicity could play a more significant role in the accuracy of Monte Carlo integration than the partiality (for the narrow set of parameters tested here). An increase in the beam divergence increases the reflection partialities and multiplicity, requiring fewer patterns for accurate structure factors. This would enable structural determination from smaller sample volumes, which is one of the current limitations in serial crystallography. More significantly, it reduces the data collection time for a three-dimensional structure at each time step in time-resolved SFX experiments.
We have discussed the differences in diffraction patterns resulting from a coherent and incoherently filled illumination cone for the cases where the beam diameter, in the transmission geometry, is larger or smaller than the crystal. We discussed the new features arising when using a coherent beam smaller than a single unit cell, and considered how the structure factor phase information contained in overlapping coherent diffraction orders can be used to obtain low-resolution phase information from diffract-and-destroy data from protein nanocrystals, where the beam hits random positions within the cell. Finally, we have demonstrated how greater convergence angles (smaller than the Bragg angle) lead to higher partialities of measured reflections, and thus more rapid convergence in structure factor measurements. We suggest that by improving the efficiency of data collection and providing more complete reflections in each shot, CCB SFX may be the preferred mode for time-resolved snapshot X-ray diffraction.
Acknowledgements
We are grateful to T.A. White, D. Shapiro and H. Chapman for useful discussions.
Endnotes
The highest convergence angle reported at LCLS was 0.773 mrad, using an iridium-plated diamond Fresnel zone plate [28].
The overall intensity scaling factor accounts for fluctuations in incident intensity and/or crystal size. The distribution is a Gaussian centred on 1 and negative or 0 scaling factors are not allowed.
Funding statement
This work was supported by NSF STC award no. 1231306 and NSF MCB no. 1021577.
References
- 1.Mimura H, et al. 2010. Breaking the 10 nm barrier in hard-X-ray focusing. Nat. Phys. 6, 122–125. ( 10.1038/nphys1457) [DOI] [Google Scholar]
- 2.Boutet S, Williams GJ. 2010. The coherent X-ray imaging (CXI) instrument at the Linac Coherent Light Source (LCLS). New J. Phys. 12, 035024 ( 10.1088/1367-2630/12/3/035024) [DOI] [Google Scholar]
- 3.Cornaby S, Szebenyi DME, Smilgies D-M, Schuller DJ, Gillilan R, Hao Q, Bilderback DH. 2010. Feasibility of one-shot-per-crystal structure determination using Laue diffraction. Acta Crystallogr. D 66, 2–11. ( 10.1107/S0907444909037731) [DOI] [PMC free article] [PubMed] [Google Scholar]
- 4.Collier RJ, Burckhardt CB, Lin LH. 1971. Optical holography. New York, NY: Academic Press. [Google Scholar]
- 5.Weierstall U, Spence J, Stevens M, Downing KH. 1999. Point-projection electron imaging of TMV at 40 eV electron energy. Micron 30, 335–338. ( 10.1016/S0968-4328(99)00022-0) [DOI] [Google Scholar]
- 6.Spence JCH, Zuo JM. 1992. Electron microdiffraction. New York, NY: Plenum. [Google Scholar]
- 7.Nugent KA, Peele AG, Quiney HM, Chapman HN. 2005. Diffraction with wavefront curvature: a path to unique phase recovery. Acta Crystallogr. A 61, 373–381. ( 10.1107/S010876730501055X) [DOI] [PubMed] [Google Scholar]
- 8.Ho JX, Ruble JR, McInnes TR, Carter DC, Huang H, Gibson WM. 2002. Convergent-beam method in macromolecular crystallography. Acta Crystallogr. D 58, 2087–2095. ( 10.1107/S0907444902017511) [DOI] [PubMed] [Google Scholar]
- 9.Kirian RA, et al. 2010. Femtosecond protein nanocrystallography-data analysis methods. Opt. Express. 18, 5713–5723. ( 10.1364/OE.18.005713) [DOI] [PMC free article] [PubMed] [Google Scholar]
- 10.Spence JCH. 2013. High resolution electron microscopy, 4th edn Oxford, UK: Oxford University Press. [Google Scholar]
- 11.Kirian J, et al. 2011. Structure factor analysis of femtosecond microdiffraction patterns from protein nanocrystals. Acta Crystallogr. A67, 131–140.
- 12.White TA, Barty A, Stellato F, Holton JM, Kirian RA, Zatsepin NA, Chapman HN. 2013. Crystallographic data processing for free-electron laser sources. Acta Crystallogr. D 69, 1231–1240. ( 10.1107/S0907444913013620) [DOI] [PMC free article] [PubMed] [Google Scholar]
- 13.Aquila A, et al. 2012. Time-resolved protein nanocrystallography using an X-ray free-electron laser. Opt. Express. 20, 2706–2716. ( 10.1364/OE.20.002706) [DOI] [PMC free article] [PubMed] [Google Scholar]
- 14.Redecke L, et al. 2013. Natively Inhibited Trypanosoma brucei cathepsin b structure determined by using an X-ray laser. Science 339, 227–230. ( 10.1126/science.1229663) [DOI] [PMC free article] [PubMed] [Google Scholar]
- 15.Paganin DM. 2006. Coherent X-ray optics. New York, NY: Oxford University Press. [Google Scholar]
- 16.Born M, Wolf E. 1999. Principles of optics, 7th Expanded edn Cambridge, UK: Cambridge University Press. [Google Scholar]
- 17.Wu T, Ohmura T. 1962. Quantum theory of scattering. Englewoods Cliff, MI: Prentice Hall. [Google Scholar]
- 18.Darwin C. 1914. The theory of X-ray reflexion. Phil. Mag. 27, 315–333. ( 10.1080/14786440208635093) [DOI] [Google Scholar]
- 19.Cowley JM, Spence JCH. 1981. Convergent beam electron microdiffraction from small crystals. Ultramicroscopy 6, 359–366. ( 10.1016/S0304-3991(81)80222-7) [DOI] [Google Scholar]
- 20.Hoppe W. 1969. Beugung im Inhomogenen Primärstrahlwellenfeld. I. Prinzip einer Phasenmessung von Elektronenbeugungsinterferenze. Acta Crystallogr. A 25, 495–501. ( 10.1107/S0567739469001045) [DOI] [Google Scholar]
- 21.Chapman HN. 1996. Phase-retrieval X-ray microscopy by Wigner-distribution deconvolution. Ultramicroscopy 66, 153–172. ( 10.1016/S0304-3991(96)00084-8) [DOI] [Google Scholar]
- 22.Spence JCH, Cowley JM. 1978. Lattice imaging in STEM. Optik 50, 129–142. [Google Scholar]
- 23.Rodenburg J. 2008. Ptychography and related diffractive imaging methods. Adv. Image Electron Phys. 150, 87–184. [Google Scholar]
- 24.Spence J. 1978. Phase determination by STEM In Scanning electron microscopy (ed. Johari O.). Chicago, IL: IITRI. [Google Scholar]
- 25.Cochran W. 1955. Relations between the phases of structure factors. Acta Crystallogr. 8, 473 ( 10.1107/S0365110X55001485) [DOI] [Google Scholar]
- 26.Zuo JM, Spence JCH, Hoier R. 1989. Accurate structure factor phase determination in non-centrosymmetric crystals. Phys. Rev. Lett. 69, 547. [DOI] [PubMed] [Google Scholar]
- 27.Dierolf M, Menzel A, Thibault P, Schneider P, Kewish CM, Wepf R, Bunk O, Pfeiffer F. 2010. Ptychographic X-ray computed tomography at the nano-scale. Nature 467, 436–440. ( 10.1038/nature09419) [DOI] [PubMed] [Google Scholar]
- 28.David C, et al. 2011. Nanofocusing of hard X-ray free electron laser pulses using diamond based Fresnel zone plates. Sci. Rep. 1, 57 ( 10.1038/srep00057) [DOI] [PMC free article] [PubMed] [Google Scholar]
- 29.Holton JM. 2008. There and back again: using simulated diffraction images to optimize data processing by ELVES. Acta Crystallogr. A 64, C77. [Google Scholar]
- 30.Winn MD, et al. 2011. Overview of the CCP4 suite and current developments. Acta. Crystallogr. D 67, 235–242. ( 10.1107/S0907444910045749) [DOI] [PMC free article] [PubMed] [Google Scholar]
- 31.White TA, Kirian RA, Martin AV, Aquila A, Nass K, Barty A, Chapman HN. 2012. CrystFEL: a software suite for snapshot serial crystallography. J. Appl. Crystallogr. 45, 335–341. ( 10.1107/S0021889812002312) [DOI] [Google Scholar]