Abstract
This paper applies rigorous diffraction theory to evaluate the minimum mass sensitivity of a confocal optical microscope designed to excite and detect surface plasmons operating on a planar metallic substrate. The diffraction model is compared with an intuitive ray picture which gives remarkably similar predictions. The combination of focusing the surface plasmons and accurate phase measurement mean that under favorable but achievable conditions detection of small numbers of molecules is possible, however, we argue that reliable detection of single molecules will benefit from the use of structured surfaces. System configurations needed to optimize performance are discussed.
OCIS codes: (180.0180) Microscopy; (110.0110) Imaging systems; (060.4080) Modulation; (120.0120) Instrumentation, measurement, and metrology
1. Introduction
The imperative to detect small numbers of molecules is becoming increasingly pressing in, for instance, disease diagnostics where the number of available molecules is often limited on account of their low concentrations, a specific example is for the case of cytokines present in blood plasma. Surface plasmon (SP) sensors represent a powerful tool in the measurement of small quantities of bioanalytes and indeed over the years there has been a steady increase in the achievable sensitivity, for instance, there has been interest in using phase sensitive methods to enhance sensitivity [1, 2]. The sensitivity of an SP sensor is usually reported in refractive index units (RIU), which, for a defined penetration depth, gives a good indication of the minimum detectable coverage of a binding event in terms of molecules per unit area. The minimum number of detectable molecules depends on the product of the minimum detectable molecular density per unit area and the probing area. Techniques capable of probing a small area without loss of sensitivity in terms of RIU thus offer the possibility of detecting smaller numbers of molecules providing they can be captured in a well defined localized region. This point is recognized in reference [3] where a spectroscopic SPR system was constructed using finite gold patches of varying sizes, down to 64 μm2. From an estimate of the noise level in their system the authors extrapolate sensitivity down to approximately 450 molecules. This is a considerable improvement compared to values of >3x10⁵ molecules detectable with unconfined SPs [4]. These sensitivity values, however, are obtained using optical systems that are adaptations of the conventional sensor systems not optimized for localized imaging and detection. The purpose of this paper is to develop a theoretical and simulation framework to assess the potential sensitivity of highly localized surface plasmon sensors. In our case the localization is controlled by the optical system rather than the propagation lengths of the SPs [5], which is generally the case with SP sensors based on Kretschmann prism or grating excitation. This paper will analyze plasmonic microscopes based on the confocal SP microscopy and discuss in detail the feasibility of approaching this limiting sensitivity in section 5.
The paper is organized along the following lines: we consider some general intuitive, but quantitative, considerations of the operation of the surface plasmon microscope. We then develop a framework based on rigorous diffraction theory to analyze the system and discuss the conditions necessary to ensure the validity of the results. We use the results of the imaging theory combined with a noise analysis to calculate the minimum detectable numbers of molecules. We then discuss system considerations that should enable the theoretical sensitivity to be approached; we then briefly consider approaches that will provide even better sensitivity.
2. Localized analyte detection in a confocal imaging system
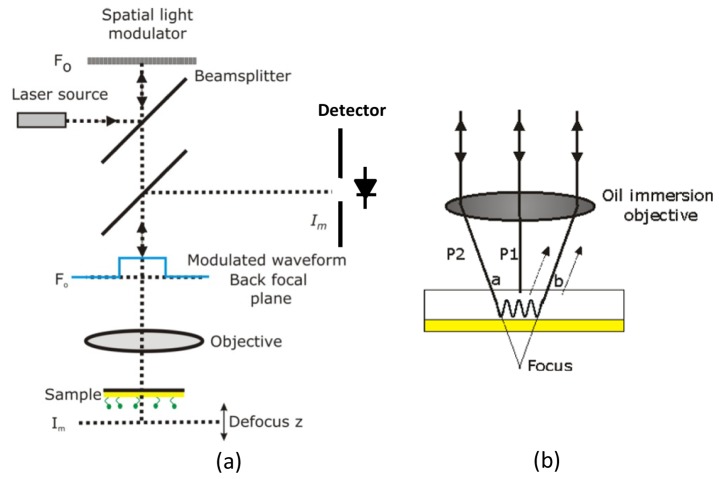
Figure 1(a) shows a schematic of a defocused confocal microscope system operating to detect a localized analyte printed on the optical axis. In our previous experiments we have used a CCD camera as a variable pinhole whose aperture can be controlled by selecting the relevant pixels to form the signal [6]. Figure 1(b) shows the immersion objective lens where we see that in the defocused state there are two principal paths that appear to come from the focus and thus return to the pinhole. (i) P1 represents a beam close to normal incidence and (ii) represents a light beam that generates an SP which propagates along the surface continuously coupling back into reradiating light which emerges from all positions, however, light that is excited at ‘a’ and reradiates at ‘b’ (and vice versa) appears to come from the focus and passes through the pinhole. P1 and P2 thus form two arms of an embedded interferometer. Most of the plasmon field is located at the bottom of the gold layer and reradiation into propagating light occurs on the top surface. The operation of the system is described in detail in reference [6].
Fig. 1.
(a) Schematic of optical system showing the relationship between different planes in the system. The blue waveform indicates phase modulation in the back focal plane. (b) Shows the principal illumination paths that appear to come from focus and thus return through the pinhole.
Figure 2(a) shows the light distribution that returns to the back focal plane for linear input polarization, in the horizontal direction the light is p-polarized so SPs are strongly excited as can be seen from the dip in the back focal plane, in the vertical direction light is s-polarized so no SPs are excited. For radially polarized light, on the other hand, the excitation strength is uniform with azimuthal angle. If we now look at situation that applies to the sample with linear input polarization as shown in Fig. 2(b) we observe the ring where the SPs are excited shown by the shaded annulus. The shading denotes the variation in SP signal strength with azimuthal angle, the strongest excitation corresponding to the direction of p-incident polarization. The radius, R, of the ring is approximately given by Δztanθp where Δz is the defocus and θp the angle of excitation of SPs. Figure 2(b) shows the presence of the analyte represented by a blue disc in the figure, this is shown well localized within the annulus of excitation to the optical axis. The effect of the analyte is to change the phase velocity of the SPs in this region so that the phase of the emitted radiation is retarded slightly compared to the case when it is absent. It can be seen immediately that all the rays pass through the sample when it is located on the optical axis, which means that the average phase shift is enhanced. Figure 2(c) shows an unfocused beam passing through a similar region of analyte where we see that a phase shift is only imposed on a small portion of the incident beam, so that the measured mean phase shift is greatly reduced as shown by the dashed line. In order to recover the phase of the SP the reference beam (P1 of Fig. 1(b)) is phase shifted relative to the beam that forms the SP, using a spatial light modulator conjugate to the back focal plane as explained in [6]. The phase can then be recovered using a conventional phase stepping algorithm from the 4 phase steps between the reference and the sample beam.
Fig. 2.
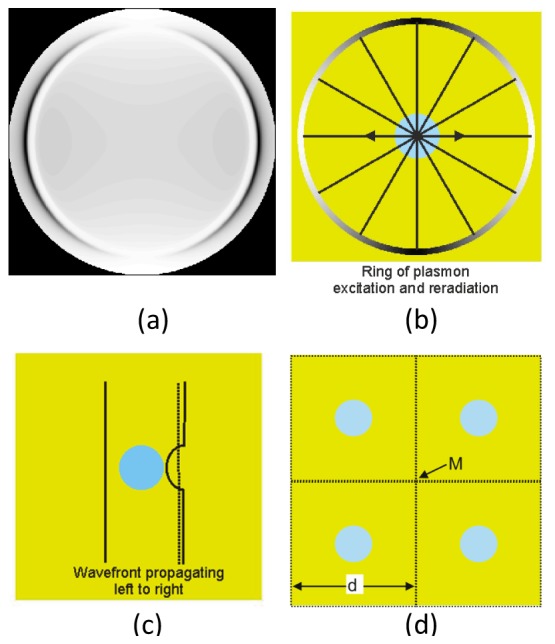
(a) Back focal plane image of objective lens for linear polarized incident wave calculated with NA of 1.65, with immersion medium with refractive index of 1.78 and incident wavelength of 633 nm, where light was illuminating a 47 nm thick uniform gold in water ambient. (b) Schematic diagram showing how surface plasmons propagation on the surface of the uniform gold substrate, note that the bright areas correspond to strong SP excitation (c) A portion of the wavefront of unfocused SP beam propagating from left to right which is slightly shifted by the analyte, giving a small average phase shift (d) shows the array structure simulated with RCWA. The position ‘M’ represents the mid-point position remote from the analyte where the size of the unit cell is adjusted to give a response similar to bare gold.
We will now give an intuitive picture to quantify the magnitude of the expected phase shift. We will subsequently use a rigorous diffraction model to quantify this effect. We can consider the total volume of material, V, to be deposited inside the ring. If the material is uniformly spread throughout the ring this will result in material deposited to a height, h, where. Alternatively we can consider all the material confined close to the optical axis in a pillar of radius r(<R). In this case the height, H, of the pillar is. Now consider a plasmon ray that accumulates additional phase delay in proportion to the local density of deposited analyte and the length of the propagation path through the analyte. In this case we obtain estimates of the phase dependence for uniform region and a localized pillar respectively: . Under the assumption that the plasmons pass through the pillar and that the scattering can be ignored we see that for the same amount of material the accumulated phase shift increases for the localized pillar by . Clearly, this analysis will break down when the size of the patch becomes comparable to the diffraction limited spot size of the plasmonic focus. We can now take this intuitive model one step further to estimate the magnitude of the actual phase shift. We will later compare this with the rigorous diffraction model and show that the simple picture below gives a remarkably good estimate. Let us consider a disc of deposited material on the gold substrate, as shown by the blue disc in Fig. 2(b-c). We can estimate the phase shift of a plasmon propagating through the disc by application of the Fresnel equations. Consider a gold substrate 47 nm thick with light incident from immersion fluid of refractive index 1.78. The k-vector for the SP is calculated from , where θp is the plasmon excitation angle, noil is the refractive index of the couplant between objective and sample. Comparing the value of k-vector for the bare gold substrate with a region coated with 1 nm of material of index 1.5 enables one to calculate the change in SP k-vector equal to 1.99x10⁻⁵ nm−1 for a free space wavelength of 633nm. If we assume all the rays pass through a disc of diameter 800nm the total additional phase shift will be 0.0159 rads. Throughout this paper we consider an objective lens with numerical aperture 1.65 using coupling fluid of index 1.78, the conclusions for a 1.49 objective and couplant of index 1.52 are very similar.
We now need to relate the mass density on the surface to the change in the k-vector of the SPs. The standard measure of mass density in most of the SP literature is that one, so called, response unit, is equivalent to a change of 10−6RIU, which, in turn, is equivalent to a mass coverage on the sample of 1 pgmm−2 [7]. Interestingly, it is observed that this empirical equivalence has been validated over a large number of different proteins [8]. We have performed an equivalent analysis on silica of index 1.5 and shown that a layer of 0.621 pm gives a similar angular shift to a change in bulk index of 1 μRIU, corresponding to a mass per unit area of 1.43pgmm−2. In the rest of the paper we will use this equivalence of mass coverage, this value is close, but slightly higher than, the values given for proteins so that our estimates while applicable for proteins will give a slightly conservative estimate for mass sensitivity.
3. Microscope model
Our model can be divided into different sections as shown in the flowchart of Fig. 3 where we can see that the model is broadly divided into the microscope model, an analysis of the interaction of the sample with the incident light field and the noise process.
Fig. 3.
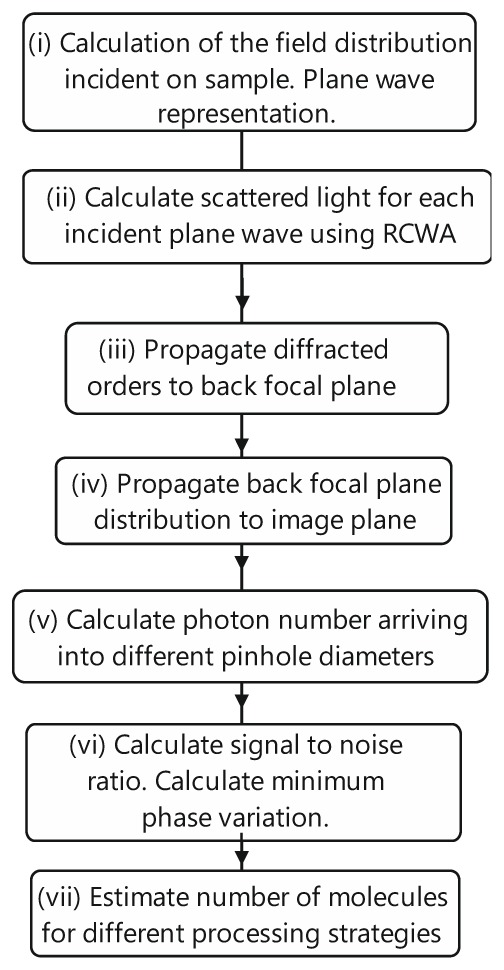
Flowchart showing calculation process for microscope model based on RCWA calculation.
-
(i)The first stage is simply calculation of the incident field incident on the sample surface. Assuming the pupil function at the back focal plane is given by: P(kx,ky) where kx and ky are the allowable spatial frequencies transmitted by the objective. When the sample is defocused the incident plane wave spectrum is given by:
(1) where kz is the spatial frequency in the axial direction. The caret over the E denotes the angular spectrum of the field. In the system modeled here the spatial light modulator performs a phase stepping measurement so the calculations of the field in image plane (parts iii, iv, and v) use 4 different pupil functions corresponding to each phase step.
-
(ii)
In order to model the effect of the analyte we need to develop a full wave solution to the problem. To this end we use rigorous coupled wave analysis (RCWA) to model the interaction of the sample with the incident radiation. RCWA provides an optimal solution to Maxwell’s equations for a periodic structure, it does, however, have certain limitations that need to be handled carefully if one is to obtain reliable results. The first limitation, of course, is that the solution that is obtained is for a periodic structure represented by a finite number of diffracted orders, the technique is therefore ‘rigorous’ provided only that the number of diffracted orders is sufficient to give an accurate representation of the problem. Another related issue is that since RCWA solves the electromagnetic problem for a periodic structure when we wish to model an isolated feature the size of the repeating unit cells must be sufficiently large that their mutual interaction can be ignored.
The mutual dependence between the two limitations above means that it is necessary to exercise care in the application of the RCWA model. Let us make this discussion more definite by referring to the specific structures we need to model. We wish to examine an isolated patch of radius, r, and determine how the incident radiation from the microscope will interact with it. If the patch is to be isolated the effect of reflections from adjacent unit cells must not reflect light back into the illuminated unit cell. In order to evaluate this distance, d, we carried out the following test: we consider the microscope response at a remote position from the dielectric patch, at a midpoint as indicated by ‘M’ in Fig. 2(d). Our assertion is that if the results from this region are close to the values obtained by simply applying the Fresnel equations to a uniform substrate we may safely argue that the unit cells are sufficiently large to be considered isolated. This separation value is significant not only from the point of view of the computation but also informs us how closely one can place binding sites on a sensor chip. The calculations showed that a unit cell dimension, d, of 10μm gave a maximum phase deviation compared from a truly uniform substrate of 1.3x10⁻⁵ radians which is less than 1/1200 of the phase difference observed in the region of the patch; we can therefore be confident that unit cell size chosen was sufficient to give results representative of an isolated structure.
Unfortunately, the large unit cell also sets another problem since the unit cell size determines the spatial frequency of the diffracted orders, so the larger the size of the unit cell the smaller the value of the spatial frequency associated with each diffracted order. To accurately reproduce the fields from a small structure the highest spatial frequency must be sufficient to replicate the object, this means, of course, that if the chosen unit cell is large many more diffraction orders are needed for a given object size. Increasing the number of diffracted orders has three principal effects in the implementation of the RCWA model (i) Increased storage requirements, which are, of course, particularly severe in 2D implementation of RCWA where the (2N + 1)2 diffracted orders are required, where N is the number of positive and negative diffracted orders (ii) increased computational time and (iii) the possibility of ill-conditioning in the matrices during inversion which was not, in this case, a problem. (i) and (ii) are, of course, strongly dependent on each other especially when we need to use virtual memory as discussed in the next paragraph.
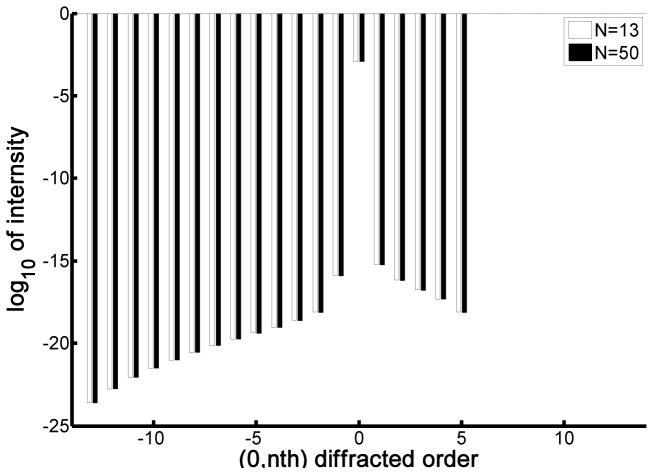
In order to implement the RCWA program we used the excellent code written by Kwiecien in Matlab. This appears to be exceptionally stable and fast and has been benchmarked against other available packages such as RODIS [9] where similar results were obtained, however, the Kwiecien code [10] gives far better representation of the evanescent fields for 2D solutions. Nevertheless, the particularly severe conditions required for our computation required some additional modification of the code. We wished to model patches whose diameter approached that of the focus of the SPs, so that, in principle, it is necessary to use N≥d/r which means that N should be greater than approximately 25. Unfortunately, the code as provided only allows for N = 20, so we modified the code to allow for N = 50. The problem, of course, was that this requires a large amount of memory, so the model was extended to set up a virtual page on the hard drive. This allowed one to compute the diffracted orders up to N = 50, unfortunately to do this took 3 days per point and we wish to calculate approximately 200,000 spatial frequencies in the back focal plane to get a good representation of the field. We used this extended model to calculate a single point incident close to the angle necessary to excite SPs and compare the results for the propagating waves (those that will return to the back focal plane) with a model calculated with a more manageable number of diffracted orders. When N = 13 that is when the total number of diffracted orders was 272 = 729, the propagating diffracted orders for the N = 50 are very similar to the N = 13 case as shown in Fig. 4 ; this ensures that a reliable result could be achieved even with the reduced number of diffracted orders. The fact that the dielectric object is extremely ‘weak’ giving only a small amount of scattering somewhat relaxes the requirement to use large numbers of diffracted orders. The reduced memory requirements for the N = 13 case means that the separate cores of the processor could be used for parallel processing without recourse to virtual memory.
Fig. 4.
Log scale of intensity of each diffracted order for N = 13 (white) and N = 50 (black); these were calculated with noil of 1.78 incident at 54 degrees (plasmonic angle) with 633 nm incident wavelength where the sample was a rod array (nrod = 1.5) with grating period of 10 μm, 1 nm thick and 400 nm in radius.
-
(iii)The diffracted orders can then be propagated to the back focal plane by applying an appropriate phase shift that allows for the displacement and defocus of the object.
(2) The incident plane wave spectrum is denoted by the first term in the integral. The scattering term SRCWA denotes the diffraction from incident k-vectors kx, ky to output k-vectors kx’ and ky’. This also takes account of the polarization state of the incident light. The effect of defocus and displacement from the origin are expressed in the last two exponential terms. The parameters kx’ and ky’ denote spatial frequencies of the scattered light which map to spatial positions in the back focal plane, any magnification terms are omitted for clarity. The terms xs and ys represent displacements from the optical axis in x and y directions respectively.
-
(iv)The output signal as a function of defocus, z, is given by Eq. (3) below:
(3) Each point on the back focal plane maps to a plane wave in the image plane whose summation gives the spatial distribution in the image plane. Since we are concerned with a partially coherent imaging system the detected intensity is the integrated intensity over the pinhole. For a small pinhole Eq. (3) is the ideal confocal response.
-
(v)
The precise field distribution at the image plane allows one to calculate the exact number of photons arriving at the pinhole for well defined input conditions. We calculate this for each phase shift imposed by the spatial light modulator and estimate the noise for each phase step.
-
(vi)
The noisy input data from each phase step is then used to recover the phase noise.
-
(vii)
This phase variation is equated to a particular mass change on the sample surface from which the minimum detectable number of molecules can be calculated for different measurement strategies.
4. Results and tests with the RCWA model
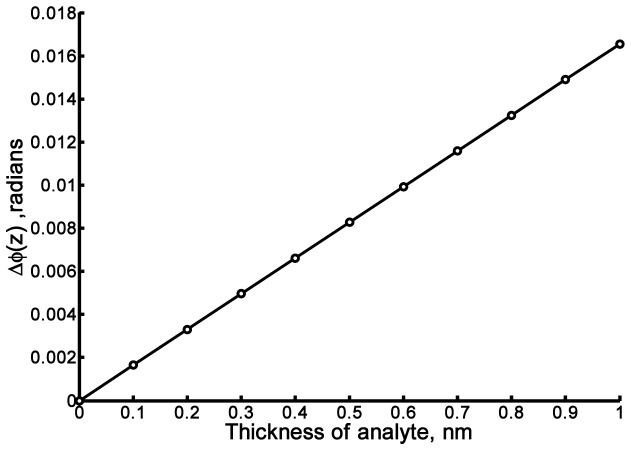
We now present some detailed predictions from the RCWA model. Figure 5 shows a plot of phase change for an analyte patch of fixed radius for various heights which confirms the phase change is proportional to the mass of the material when the radius is constant. The linear relationship means that once the noise level is established the minimum detectable height of the patch can be evaluated.
Fig. 5.
Phase change, Δϕ, in radians as a function of thickness of analyte, where the radius of the analyte was fixed at 400 nm and the Δϕ(z) was calculated at z = −2.5 μm defocus.
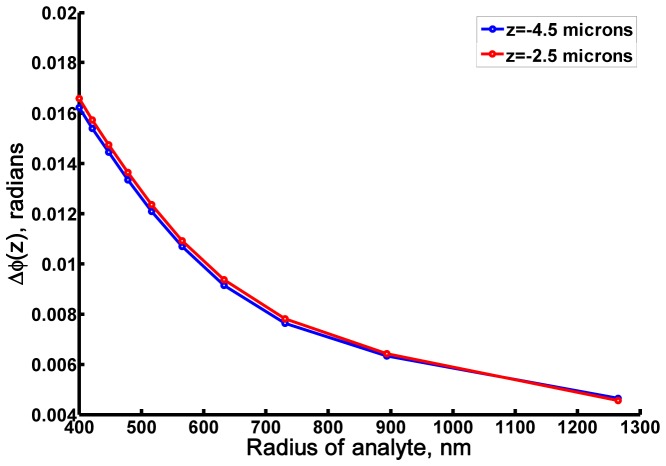
Figure 6 shows the measured phase change for different defocuses as a function of the radius of the patch of analyte with fixed volume (mass). We can see that the signal changes as 1/r as predicted in section 2. Note that for all defocuses the phase change imposed is approximately the same suggesting that only propagation through the patches controls the phase shift as suggested by the ray picture denoted in Fig. 2(b). Note also that the phase change for the 1 nm high patch with radius 400 nm is calculated as 0.01655 radians which very close to the value obtained by the simple ray analysis of section 2 which predicts 0.0159 radians.
Fig. 6.
Phase change, Δϕ, in radians as a function of radius of analyte with fixed volume (mass), the Δϕ were calculated at z = −4.5 μm (shown in blue), z = −2.5 μm (shown in red).
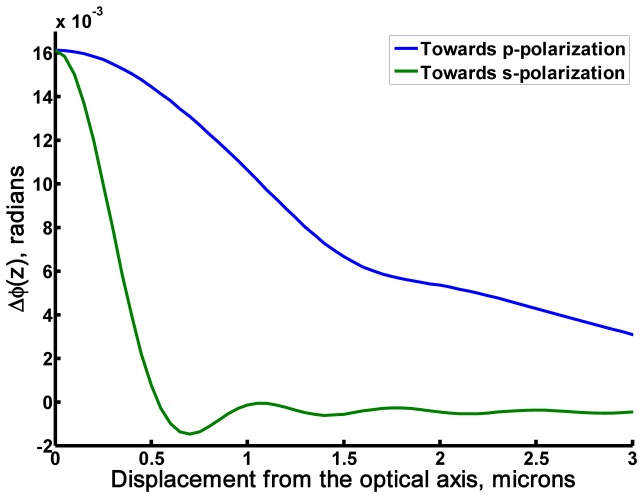
Figure 7 shows the effect of focusing of the beam; this shows the phase shift as a function of displacement of the beam from the optical axis, where we see that the maximum phase shift occurs when the sample is on the optical axis. Since we are considering linear polarization the variation of the signal as the sample is displaced towards the p- and s- directions as denoted in Fig. 7 differ substantially falling off much more rapidly as the sample is displaced towards the s- polarization direction. The negative value on the green curve is due to the sidelobe of the SP focus passing through the analyte.
Fig. 7.
Shows the phase shift as a function of displacement of the beam from the optical axis at z = −2.5 μm defocus of analyte with radius of 400 nm and thickness of 1 nm (n = 1.5 in water ambient); the blue line represents the displacement of the analyte along p-polarisation and the green line represents the displacement of the analyte along s-polarisation direction.
5. Estimating minimum detectable signal under shot noise limit
We can now estimate the minimum detectable phase shift that we may expect to measure. In order to estimate the phase noise we calculate the number of photons passing through a finite sized pinhole sufficient with associated shot noise. The model simply assumes photon noise in each channel, from an electronic point of view achieving shot noise limited performance is achievable, however, removing environmental fluctuations is the major challenge that we discuss briefly in section 6.
We calculate the number of detected photons for each of the 4 phase steps where the number of detected photons (which accounts for the quantum efficiency) in the mth phase step is given by:
| (4) |
Where ϕ is the phase shift associated with the deposited sample. Each of these signals is subject to shot noise proportional to . The recovered phase is then simply given by
| (5) |
Where the ~denotes the signal plus noise.
The noise in each phase step is independent of the others and the values were calculated from a random number generator and the measured phase was estimated 106 times, so that the mean phase error was calculated for different substrates and pinhole opening apertures. This was converted to a specific mass sensitivity from the calculated phase shift given by the RCWA calculations from which the minimum number of detectable molecules was estimated.
From the curves of Fig. 8 we can see that with reasonable power levels it may be possible under ideal conditions to approach single molecule detection with the technique. We can see that increasing the pinhole size improves the sensitivity simply because the number of detected photons is increased, however, there is a limit to this process, since the confocal effect is lost when the pinhole diameter increases to the order of λ/NA as shown both experimental and theoretically in [11]. This means that the path, and hence the phase, of the detected plasmons is no longer well defined, so that phase cancellation reduces the plasmon signal and therefore the response to a change in local refractive index. There is therefore a tradeoff between a well-defined path of the returning SPs and the numbers of detected photons; in practice a diameter of approximately 1/2 the Airey disc size appears a good compromise, similar to the situation that obtains in conventional confocal microscopy. If instead of using the shot noise limit but apply values of phase sensitivity given in the literature [12] which quotes phase sensitivity of better than 5x10⁻³ degrees this will correspond to detection of approximately 37 molecules with 100kD mass; these measurements were obtained close to a reflection minimum where the noise is expected to be worse than in our confocal microscope system. We reiterate here that our estimate of the conversion of mass to refractive index units is about 43% more conservative the values presented widely in the literature.
Fig. 8.
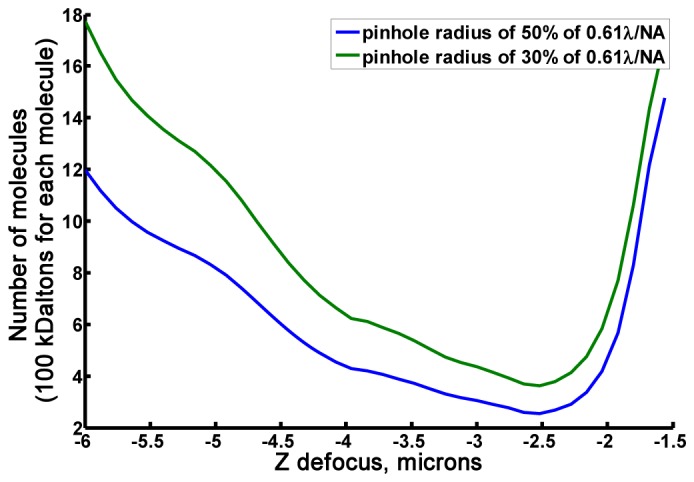
Shows number of 100kD molecules as a function of defocus accounting for the number of photons passin through the pinhole. The blue curve for pinhole radius of 50% of 0.61λ/NA and the green line for for pinhole radius of 30% of 0.61λ/NA. This were calculated with 100 μJ energy on the image plane.
The NA of the objective lens itself does not significantly directly affect the sensitivity of the system provided that the aperture is sufficient to excite and detect the SPs, however, if we used a 1.49NA objective such as used in our previous experiments the immersion fluid has a refractive index of 1.52, which changes the sensitivity slightly. In this case we calculate that the 800nm diameter patch with 1nm height will introduce a phase change of 0.0146 radians which gives means that the minimum detectable number of molecules is increased by c. 8%.
Furthermore, we have only assumed that the detection process is performed on uniform layers, indeed it is well known that structured surfaces give far better sensitivity; our estimates of the achievable sensitivity are again therefore in this sense somewhat conservative. The other assumption is, of course, that one can extrapolate the sensitivity of a uniform dielectric layer down to the level of a single molecule. This assumption is to some extent implicit in the standard model of dielectric constant as discussed in, for instance, in the Feynman lectures [13] where the dielectric molecule introduces a quadrature scattered component that retards the phase of the transmitted light. The other assumption is that the molecules inevitably reorientate as they become sparse, however, it is commonplace in the estimation of SPR sensitivity to consider layers where the surface coverage is of the order of 1 part in 104, in which case the mean separation between molecules will be of the order 100 molecular diameters which means even in that case they are isolated, so our extrapolation down to small numbers of molecules is no different from the assumptions made in previous literature [3]. Experiment will ultimately demonstrate the limit of this assertion.
6. Techniques to achieve the theoretical sensitivity
Achieving shot noise sensitivity with an interferometer is challenging but achievable. There are many demonstrations where shot noise or near shot noise performance has been achieved [14, 15], however, in these cases this was achieved at relatively high measurement frequencies where the effect of ambient vibrations and microphonics is dramatically reduced. The microphonic vibrations which introduce phase noise are given by where the θ terms refer to the incident angles for plasmon excitation and reference beam respectively. For a normally incident beam θreference is close to zero so cosθreference is approximately 1. If θreference is close to θplasmon then the microphonic noise terms cancel out. F To address this issue we have developed a system that while conceptually similar to the interferometer described here uses a reference beam that is incident at the angle as the SP, the results from this system will be reported shortly. The four phase steps also impose a requirement on the speed of measurement, so that there is no certainty that each measurement can be obtained under the same condtions. SLMs are available that can achieve 1000 frames per second so that a measurement with 4 phase steps can be achieved in 4ms which overcomes a large proportion of the microphonic noise [14]. It is, of course, much better if all the phase steps can be achieved in a single parallel measurement and we believe single shot plasmonic interferometry is indeed possible if a reference beam with a variable phase shift, such as an optical vortex, can be used. We intend to report single shot plasmon interferometry in a subsequent publication.
7. Conclusions
In conclusion we have presented a methodology to calculate the limits of detection using phase measurement in a confocal interferometer arrangement. The calculations show that concentrating the analyte to the focus of the SPs improves the detection sensitivity to single figure numbers of molecules on planar surfaces, however, the use of structured surfaces will further enhance the sensitivity to changes in local refractive index. Structured surfaces are often used to enhance sensitivity for spectroscopic measurements [16] and similarly zero order grating structures may be expected to give large changes in the k-vector of surface waves for a given analyte thickness. Developments of these surfaces combined with instrumental developments discussed here mean that detection of single protein molecules should be achievable in the near future.
Acknowledgment
The authors gratefully acknowledge the financial support of the Engineering and Physical Sciences Research Council (EPSRC) for a platform grant, ‘Strategies for Biological Imaging’ and a Hermes innovation award from the University of Nottingham. We also gratefully acknowledge the provision of the RCWA simulation code written by Pavel Kwiecien from Czech Technical University in Prague, Optical Physics Group, Czech Republic.
References and links
- 1.Markowicz P. P., Law W. C., Baev A., Prasad P. N., Patskovsky S., Kabashin A., “Phase-sensitive time-modulated surface plasmon resonance polarimetry for wide dynamic range biosensing,” Opt. Express 15(4), 1745–1754 (2007). 10.1364/OE.15.001745 [DOI] [PubMed] [Google Scholar]
- 2.Wu S.-Y., Ho H.-P., “Single-beam self-referenced phase-sensitive surface plasmon resonance sensor with high detection resolution,” Chin. Opt. Lett. 6(3), 176–178 (2008). 10.3788/COL20080603.0176 [DOI] [Google Scholar]
- 3.Kvasnička P., Chadt K., Vala M., Bocková M., Homola J., “Toward single-molecule detection with sensors based on propagating surface plasmons,” Opt. Lett. 37(2), 163–165 (2012). 10.1364/OL.37.000163 [DOI] [PubMed] [Google Scholar]
- 4.Piliarik M., Homola J., “Self-referencing SPR imaging for most demanding high-throughput screening applications,” Sens. Actuators B Chem. 134(2), 353–355 (2008). 10.1016/j.snb.2008.06.011 [DOI] [Google Scholar]
- 5.Pechprasarn S., Somekh M. G., “Surface plasmon microscopy: Resolution, sensitivity and crosstalk,” J. Microsc. 246(3), 287–297 (2012). 10.1111/j.1365-2818.2012.03617.x [DOI] [PubMed] [Google Scholar]
- 6.Zhang B., Pechprasarn S., Somekh M. G., “Quantitative plasmonic measurements using embedded phase stepping confocal interferometry,” Opt. Express 21(9), 11523–11535 (2013). 10.1364/OE.21.011523 [DOI] [PubMed] [Google Scholar]
- 7.ICX NOMADICS, “Overview of Surface Plasmon Resonance,” http://www.sensiqtech.com/uploads/file/support/spr/Overview_of_SPR.pdf (accessed 28th Nov 2013).
- 8.Höök F., Kasemo B., Nylander T., Fant C., Sott K., Elwing H., “Variations in coupled water, viscoelastic properties, and film thickness of a Mefp-1 protein film during adsorption and cross-linking: A quartz crystal microbalance with dissipation monitoring, ellipsometry, and surface plasmon resonance study,” Anal. Chem. 73(24), 5796–5804 (2001). 10.1021/ac0106501 [DOI] [PubMed] [Google Scholar]
- 9.Photonics Research Group University of Gent, “Gent rigorous optical diffration software (RODIS),” http://www.photonics.intec.ugent.be/research/facilities/design/rodis (accessed 28th Nov 2013).
- 10.I. Richter, P. Kwiecien, and J. Ctyroky, “Advanced photonic and plasmonic waveguide nanostructures analyzed with Fourier modal methods,” in Transparent Optical Networks (ICTON), 2013 15th International Conference on (2013), pp. 1–7. 10.1109/ICTON.2013.6602695 [DOI] [Google Scholar]
- 11.Zhang B., Pechprasarn S., Zhang J., Somekh M. G., “Confocal surface plasmon microscopy with pupil function engineering,” Opt. Express 20(7), 7388–7397 (2012). 10.1364/OE.20.007388 [DOI] [PubMed] [Google Scholar]
- 12.Kabashin A. V., Patskovsky S., Grigorenko A. N., “Phase and amplitude sensitivities in surface plasmon resonance bio and chemical sensing,” Opt. Express 17(23), 21191–21204 (2009). 10.1364/OE.17.021191 [DOI] [PubMed] [Google Scholar]
- 13.R. P. Feynman, R. B. Leighton, and M. Sands, “The origin of refractive index,” in The Feynman Lectures on Physics: Mainly Mechanics, Radiation, and Heat (Basic Books, 2011), Chap. 21. [Google Scholar]
- 14.McKenzie K., Gray M. B., Lam P. K., McClelland D. E., “Technical limitations to homodyne detection at audio frequencies,” Appl. Opt. 46(17), 3389–3395 (2007). 10.1364/AO.46.003389 [DOI] [PubMed] [Google Scholar]
- 15.van Dijk M. A., Lippitz M., Stolwijk D., Orrit M., “A common-path interferometer for time-resolved and shot-noise-limited detection of single nanoparticles,” Opt. Express 15(5), 2273–2287 (2007). 10.1364/OE.15.002273 [DOI] [PubMed] [Google Scholar]
- 16.Roh S., Chung T., Lee B., “Overview of the characteristics of micro- and nano-structured surface plasmon resonance sensors,” Sensors (Basel) 11(12), 1565–1588 (2011). 10.3390/s110201565 [DOI] [PMC free article] [PubMed] [Google Scholar]


