Abstract
A linearly chirped fiber Bragg grating (LCFBG) has been used as a temperature sensor for online monitoring of radiofrequency thermal ablation (RFTA). The LCFBG acts as a distributed sensor, with spatial resolution of 75 μm. A white-light setup that records the LCFBG spectrum estimates the temperature profile in real time. Three RFTA experiments have been performed ex-vivo on porcine liver measuring the radial temperature distribution during the heating process. The analysis of thermal maps quantifies the spatial heat distribution along the measurement axis and determines the ablation efficiency.
OCIS codes: (060.2370) Fiber optics sensors, (060.3735) Fiber Bragg gratings, (120.6780) Temperature, (170.1020) Ablation of tissue, (050.1590) Chirping
1. Introduction
Thermal ablation (TA) is one of the main therapies for the treatment of tumors, up to 3-5 cm in size [1]; TA is commonly applied in hepatic, lung, kidney, prostatic tumor treatment, as well as in other medical applications. The principle of TA is to heat the tumor tissue with a highly localized energy source. The mortality rate of tumor cells is a function of both temperature value and the duration of the ablation; at temperatures exceeding 60°C, tumor cells mortality occurs within few seconds, while for a temperature of ~52°C mortality is achieved for a 60 s exposure time.
While several approaches can be used for TA, such as microwave or laser ablation, the most widely employed remains the radio-frequency thermal ablation (RFTA) [2–4]. In RFTA, the ablation is performed through a RF circuit in which the biological tissue represents the electrical load. A 350-500 kHz RF generator is connected to a RFTA ablation needle, which serves as the electrode, positioned by the doctor in the central point of the tumor; a second electrode is positioned at a safe spot, usually on patient’s spine. By applying a difference of potential, with associated RF power of 5-50W, the tissue is heated by Joule effect; tumors up to several cm in size can then be treated. As the tissue surrounding the RFTA needle is heated, intracellular fluid is released and when it reaches the boiling point, liquid-to-vapor phase change occurs, which results in a rapid increase of electrical impedance. From an initial impedance of 80-120 Ω, when a liquid-to-vapor transition is observed, the liver impedance rises rapidly above several kΩ, providing an electrical insulation between the tissue and RFTA needle that prevents any further ablation. RFTA allows reduced invasiveness with respect to other methods for tumor treatment, and is regularly an outpatient procedure.
The presence of sensors and actuators can innovate RFTA, improving efficiency and predictability. One of the main indicators of the efficiency of TA treatments is temperature measurement, in multiple points. Thermocouples or thermistors have been previously employed in this application; currently in the medical practice RFTA electrodes with embedded thermocouples are employed [4]. However, micro-electromechanical sensors (MEMS) have invasive size, may alter the profile of the RF circuit modifying the radiation pattern, and suffer from detuning due to the electrical RF emission; MEMS also allow a single point of detection. The possibility of having a real-time dense thermal monitoring of RFTA is to date an open task. Such a possibility can open a “smart-RFTA” scenario, where the RFTA parameters can be dynamically adapted during the operation to optimize its efficiency and reduce the failure rate. The possibility of monitoring TA can have a tangible impact on the ablation efficiency, particularly for hepatic tumors treated with RFTA [5–8], where the specific liver properties allow only short ablation as the liquid-to-vapor transition occurs within few minutes.
Optical technologies can provide a valuable solution for this sensing problem. In previous literature [9], an infrared thermal camera has been used for the monitoring of the 2D temperature pattern in proximity of the electric needle. The possibility of using a thermal camera is however almost limited to ex-vivo analysis. In clinical applications, the thermal camera can find a suitable application only where a direct line of sight is possible, which implies an invasive surgical intervention that exposes the human organ to the camera; this level of invasiveness is however not compatible with RFTA, which provides a non-invasive, outpatient treatment.
On the other hand, fiber-optic sensors (FOS) [10] can be inserted in-vivo through catheters, either attached to the RFTA needle or through separate insertion. The miniature size of optical fibers allows monitoring along a single or multiple channels, ensuring a form factor that does not alter the sensing environment. In addition, FOS are actively and passively immune to electromagnetic interference: they do not alter the RF emission field, and do not exhibit any detuning induced by RF emission.
A Fiber Bragg Grating (FBG) array [11–13], often used in hyperthermia measurement [13,14], can provide a multi-point temperature measurement. Recent developments of draw-tower gratings (DTG) allow the realization of low-cost FBG array on biocompatible, medical-certified, ormoceramic fibers; compared to standard phase-mask or beam-interference FBG inscription methods, FBGs fabricated on a drawing tower maintain the original fiber coating, preserving the tensile strength of glass optical fibers as well as its miniature thickness. With industrial DTG manufacturing capabilities, the density of FBGs along a single fiber is usually 1.0 – 1.5 FBG/cm. Due to the steep spatial gradients induced by the RFTA, the possibility of reducing the active length for each sensor and increasing the sensing density would be both attractive and beneficial. Alternatively, an extrinsic Fabry-Perot interferometer (EFPI) can be used as thermal sensor with few μm active area, but only one sensing point per fiber is allowed [15].
A very dense spacing can be achieved with the most recent generation of distributed sensors, which make use of an interferometric setup to detect the Rayleigh backscattering within a single-mode optical fiber. Commercial systems such as [16] can achieve a spatial resolution of 10-20 μm. The main disadvantage of this approach is however the relatively high cost of the interrogation device, which is orders of magnitude greater than FBG-based setups, and several times higher than the whole RFTA equipment.
In this paper, we introduce the possibility of using a linearly chirped FBG (LCFBG) [17,18] to provide a distributed thermal monitoring along the fiber axis; the possibility of achieving distributed sensing in a short active length with hundreds of sensing points is a significant improvement in thermal dosimetry measurement over FBGs that usually record up to 5 sensing points within the ablation region. In this application, the LCFBG acts as a distributed reflector, in which the spectral reflectivity is tied to the spatial distribution according to a linear match. The LCFBG is used to provide distributed thermal measurements in hepatic RFTA. Experiments have been carried out ex-vivo on porcine liver, which represents the natural phantom of human liver having similar biological and electrical properties. Three different experimental setups are used, measuring the thermal distribution during the RFTA heating until the high-impedance condition.
2. Setup and temperature sensitivity
The sensing system is based on a LCFBG used as temperature sensor. This sensing element behaves as a layer of FBGs, in which different Bragg wavelengths are encoded along the fiber axis z [11,17]:
| (1) |
where λB is the local Bragg wavelength, neff is the effective refractive index, and Λ is the local refractive index modulation. At constant temperature, neff is approximately constant and depends mostly on tolerances of fabrication. The modulation period Λ(z) follows a linear profile:
| (2) |
for 0 < z < L, where L is the grating length; k is the chirp coefficient, which defines the increase of refractive index period per unit of length. When a temperature variation ΔT(z) is applied, non-constant along the axis z, the local Bragg wavelength exhibits a linear shift:
| (3) |
where sT is the thermo-optic coefficient. Equations (1)-(3) provide a simplified model of the operation of a linearly chirped FBG exposed to an arbitrary temperature pattern. A theoretical model that expresses the reflectivity as a function of the physical parameters of the chirped FBG can be derived from the coupled-mode theory [17] or from the layer-peeling approach [19].
The spectrum of the LCFBG used in experiments is shown in Fig. 1 ; the sensor has been provided by Technica S.A. on SMF28 fiber. The full-width half-maximum bandwidth of the FBG ranges from 1529.3 nm to 1562.7 nm. The maximum reflectivity is 94.5% (12.4 dB amplitude), while the spectrum shows a 2.0 dB ripple within the reflected bandwidth. The length of the grating is L = 15 mm; the linear chirp parameter in Eq. (2) is k = 2.22 nm/mm. In uniform heating conditions, the FBG exhibits a wavelength shift of sT = 10.2 pm/°C.
Fig. 1.
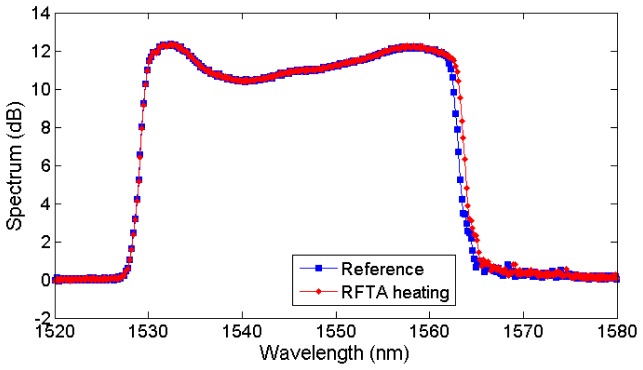
Reflection spectrum of the LCFBG sensor acquired in reference conditions and non-uniformly heated through RFTA.
Figure 2 shows the interrogation setup for experimental measurements, based on a white light principle. The source is an amplified spontaneous emission (ASE) source with 20 mW emission power over 1530-1600 nm bandwidth; the source is coupled to a 50/50 coupler connected to the sensor. The backreflection light signal is collected using a spectrometer (Ibsen I-MON USB) having 1520-1596 bandwidth; the spectrometer is used in spectral-scanning mode and collects data with a spectral resolution ranging from 137 pm (at 1520 nm) to 202 pm (at 1596 pm). The integration time is 0.6 ms. Acquisition is performed with a custom-made LabVIEW program that acquires data from the spectrometer and processes the spectral information in real time. Figure 2(b) shows a photograph of the setup.
Fig. 2.
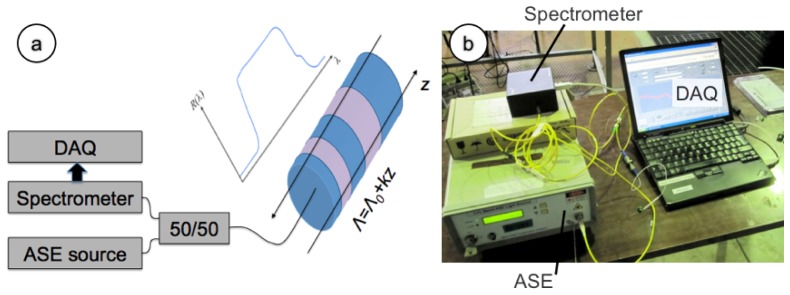
Setup of the LCFBG interrogation system. (a) Schematic of the interrogation system; (b) picture of the experimental setup.
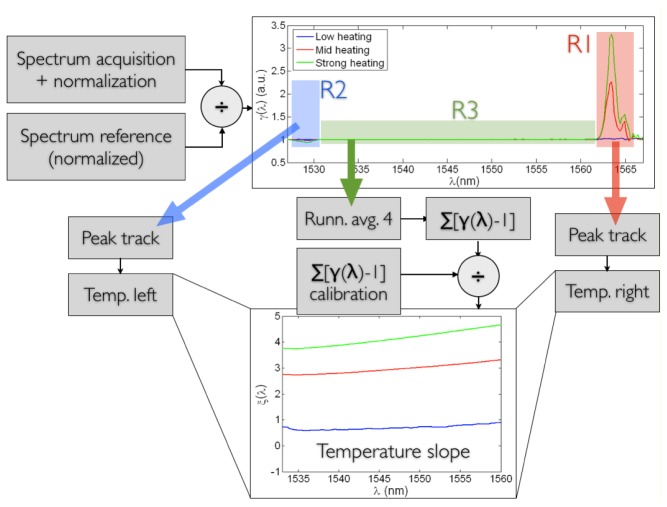
A detection algorithm has been applied to estimate the temperature distribution from the LCFBG spectrum, exploiting the linear model of Eqs. (1)-(3). The algorithm follows the following flow, as highlighted in Fig. 3 :
Fig. 3.
Schematic of the LCFBG detection algorithm. The ratio γ(λ) is computed by normalizing the measured spectrum; a sample γ(λ) in non-uniform conditions is reported. The three regions R1, R2, and R3 are treated separately. A peak tracking technique simply computes the two side peaks in R1 and R2, relatively to previous calibration in uniform heating conditions, estimating the temperatures at both sides. The inner part is first filtered to smooth noise, then integrated, and normalized for a calibration function, obtaining the slope function ξ(λ), as in the bottom plot. The three thermal data are then combined returning the temperature profile on the whole distance axis.
-
1)
The measured spectrum SM(λ), as well as the reference spectrum SR(λ) acquired with no thermal excitation, are both normalized, initializing the algorithm.
-
2)
The ratio γ(λ) = SM(λ)/SR(λ) is computed, as in Fig. 3.
-
3)
The two regions R1 (red) and R2 (blue) are separated.
-
4)
The amplitude of the γ(λ) peak in R1 determines the temperature variation corresponding to the red part of the spectrum. For a more refined estimation, the integration of γ(λ) on R1 is performed as peak tracking, estimating the temperature on the right side of the spectrum.
-
5)
The same process is repeated on the left side of the spectrum, in R2.
-
6)
The third region R3 of γ(λ) includes the inner part of the spectrum, and is dependent on the temperature profile within the two edges. Specifically, each value of γ(λ) in R3 depends, in good approximation, to the “local” differential spectral shift. Specifically, γ(λ) is a value close to 1, in ideal conditions being >1 for an ascending slope and <1 for a descending slope.
-
7)
The spectrometer is based on parallel computation, and introduces spectral noise having a sawtooth-like shape, which is particularly visible in R3; to compensate this noise, prior to further processing, the function γ(λ) is filtered in a running-average filter with length 4 obtaining a smoothing effect.
-
8)
Moving from the right to the left part of the spectrum, the integral function ∑[γ(λ)-1] is computed.
-
9)
In order to adjust for the non-ideal behavior of the spectrum, ∑[γ(λ)-1] is divided by the same summation term obtained in uniform conditions at ambient temperature; this way, the function ξ(λ) = ∑[γ(λ)-1] / ∑[γuniform(λ)-1] is obtained. This function determines the shape of the temperature profile within the inner part of the LCFBG spectrum.
-
10)
The final step involves the recombination of the three temperature data: peak analysis in R1 and R2 provides the temperature estimation at the two edges, while the slope of ξ(λ) within R3 is accounted as the temperature slope in the inner part. This way, it is possible to achieve the approximate estimation of the temperature profile of the LCFBG.
The algorithm hereby proposed has a simpler and faster implementation than genetic algorithms performing reverse layer-peeling such as [19]. As deducible in Fig. 3, and typical in distributed sensing, the algorithm is very effective in tracking the temperature variation at the two edges of the LCFBG, while it pays the highest penalty in the estimation of the inner profile. For hyperthermia, where rapid gradients of temperature occur both in time and space, the proposed algorithm provides an acceptable approximation, and can sustain a processing rate of ~100Hz with PC-based measurement system. The average wavelength resolution of the spectrometer is 166 pm, which converts to a spatial resolution of 75 μm.
With the aforementioned detection algorithm, the LCFBG operation has been validated in a reference chamber, having spatially uniform heating, as shown in Fig. 4 , recording the reference temperature on the 22-95°C range with a thermocouple (0.1°C accuracy). As opposite to Fig. 1, it is possible to observe that in uniform heating conditions, the whole spectrum is subjected to a red shift, whereas the thermal coefficient sT recorded on the two spectral edges has the same value. The second chart in Fig. 4 shows the normalized temperature profile along the distance axis for different temperature values. With temperature very close to the reference value, the effect of the running-average filter is dominant on the slope detection; as a consequence, the standard deviation recorded along the distance axis (0.02°C) is smaller than the error on the temperature detection ad the edges (~0.2°C). As temperature rises, the error at further distances tends to progressively diverge, as visible for 39.1°C and 69.7°C temperature values; the maximum error, recorded on the temperature slope nearly, is −0.54°C and −1.77°C respectively, and achieves −2.55°C error at 95°C. Qualitatively, Fig. 4 confirms that the LCFBG sensor operates with overall tolerable uncertainty, which increases at longer distances from the fiber tip and at higher temperatures.
Fig. 4.
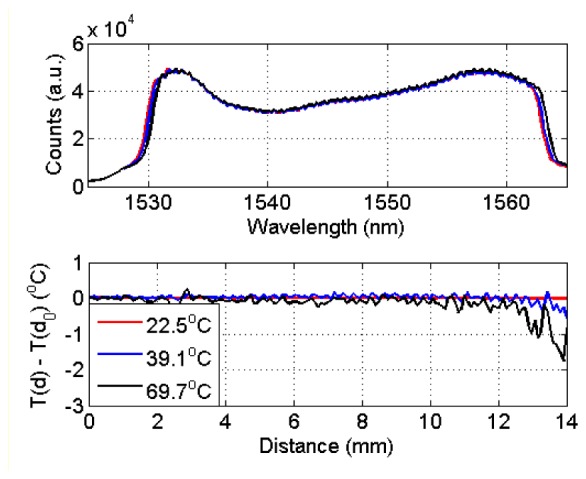
Calibration of the LCFBG in uniform heating conditions. The upper chart shows the LCFBG spectrum for three different temperature values (starting temperature: 22.1°C) uniform along the distance axis. The bottom chart shows the recorded temperature T as a function of distance d, normalized by the temperature on the fiber tip T(d0).
3. Results and discussion
The first measurement involves the estimation of the thermal variations along the radial axis. The measurement has been performed ex-vivo on porcine liver, which is the preferred phantom of human liver; porcine liver provides a good match with human liver in terms of consistency of the biological tissue, as well as electrical impedance throughout the heating process. Porcine liver specimens employed in tests have been taken from local pigs processed within 48 hours before the experimental tests, and preserved in a refrigerator.
The experimental setup is photographically shown in Fig. 5 , which illustrates the LCFBG positioning in the chamber and the porcine liver after the RFTA. The measurement chamber has been fabricated using extruded polystyrene foam, with a cylindrical shape of 6 cm diameter and ~20 mm thickness. The RFTA needle has been placed vertically with the ablation tip at the center of the cylindrical chamber. The LCFBG sensor has been connected with the sensing tip in contact with the RFTA needle and attached to the base of the chamber; the positioning is shown in Fig. 5(a) where the whole length of the LCFBG has been illuminated by red light. After positioning the fiber-optic sensor and connecting the interrogation setup as in Fig. 2, the liver has been inserted from the top to fill the whole chamber, which has been closed from above with a lid. The RFTA needle has a cylindrical hollow shape, with 4 mm diameter; a thermistor (Epcos B57861 NTC, accuracy 0.1°C) has been inserted through the needle to provide a punctual temperature measurement and initialize the LCFBG temperature value. A RF generator for medical use applied a difference of potential between the RFTA needle and a second electrode, placed on the lateral surface of the liver sample; the RF signal (frequency and power) has been monitored using an oscilloscope. The RF carrier is 480 kHz. The RF generator embeds an impedance meter, which monitors the liver impedance in real time; when the impedance exceeds 300 Ω, the generator automatically stops the power supply.
Fig. 5.
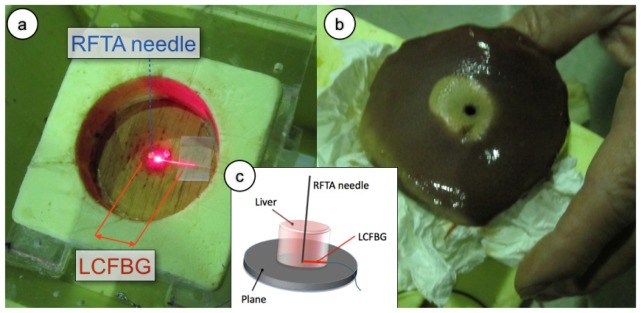
Setup of the radial temperature field measurement. (a) Measurement chamber, prior to liver insertion. The RFTA needle (4 mm diameter, cylindrical hollow shape, 10 mm length) is inserted vertically into the chamber. The LCFBG (250 μm diameter), lighted with a red laser is positioned with the sensing tip in contact with the needle; the whole length of the LCFBG is illuminated by scattering into fiber recoating. (b) Picture of the porcine liver after RFTA; the lesion has a slightly asymmetrical shape in the radial direction with respect to the needle penetration point, but this asymmetry is only superficial. (c) Schematic of the ablation setup and sensor positioning.
The RFTA procedure has been performed using the method outlined above. The initial temperature was 22°C; the initial liver impedance was 127 Ω, and the RF power applied was 15 W. As the RFTA started, the temperature has been recorded by the fiber-optic setup in a distributed way. As the liver reached a temperature of about 100°C, the vaporization process started; the presence of vapor acted as a dielectric load, rapidly increasing the liver impedance over the 300 Ω threshold, and the procedure was interrupted. The full duration of the procedure was 242 s. Figure 5(b) shows the outcome of the RFTA on the liver; the inner part presents a lesion induced by heating, which in this circumstance appears to be slightly asymmetrical along the radial axis; however this asymmetry is only superficial and partially due to the needle positioning.
Figure 6 shows the thermal map measured throughout the RFTA measurement. In order to emphasize the use of the LCFBG as a sensor for thermal distribution, the chart reports the temperature in each point as a function of both distance from the fiber tip, and time elapsed throughout RFTA; the same graphic style is used for all experimental results. The chart shows that temperature rises from the start throughout the whole RFTA experiment, reaching the maximum at 242 s, where the RF generator stops; then, temperature decreases rapidly in the whole region. During the heating process, it is possible to show the strong spatial gradient associated with RFTA. The 0.15-mm narrow slice in proximity to the needle is exposed to the highest temperature and reaches 60°C in 40 s time. Then, temperature rises with a lower rate, reaching a plateau (85-91°C) until 220 s, where the liquid-vapor transition starts to occur. In this final part, temperature rises quickly to 108°C; a final transition, very steep and perceived all the way through the LCFBG, sets the peak temperature to 130.7°C. Moving to further distance, temperature appears to have a similar qualitative pattern, but lower values. At 1 cm distance the 60°C value is achieved after 105 s, and the subsequent temperature plateau is observed for 150-220 s at 74-82°C. At 2-8 cm distance from the tip, the temperature recorded by the LCFBG overcomes the 60°C value after 90-130 s of ablation. It is also possible to show that after 8 mm distance the spatial gradient is increased, as a result of the lower heat penetration of RFTA in this area. The final peak rise is shown on the chart as a neat line, that implies a steep thermal transition recorded all the way through; such abrupt temporal and spatial variation can be, partially, attributed to a strain induced in the liver that affects the measurement, induced by a pressure release generated by the ablation process. The chart also shows the cooling process, which is rapid and with a spatial gradient that appears to be slightly higher than the RF-heating. The results shown in Fig. 6 correlate with the ablation profile in Fig. 5(b): the LCFBG, positioned on the shorter side of the asymmetrical lesion, shows a transition nearly in proximity of 8-10 mm, showing the limits of heat distribution in this area as appearing as a color change in the liver. The correct distribution of the heat along the fiber axis is an indicator of an effective RFTA; for tumor treatment, where most of the emphasis is on achieving a temperature higher than 60°C (cyan color on the thermal map), it can be inferred that the depth of penetration is relatively deep. Figure 6-right reports the temperature measured with the thermistor. The qualitative behavior of the thermistor measurement exhibits a trend similar to the LCFBG. However, direct quantitative LCFBG-thermistor comparison is however inconsistent, since the thermistor is located inside the needle, almost sealing it on the far side: this conveys more heat in its surrounding area, while the LCFBG lays outside of the needle and is exposed to the “natural” RF irradiance.
Fig. 6.
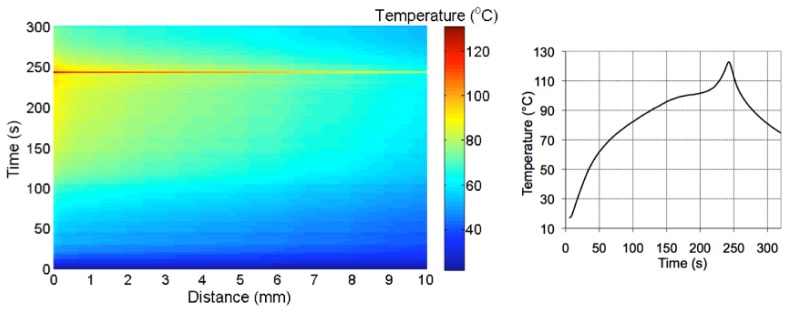
Left: thermal map of the RFTA-induced irradiance along the radial axis; the chart reports the temperature (in the color map) as a function of the distance from the fiber tip recorded during heating (242s) and the following cooling. Right: temperature recorded with a thermistor inserted near the ablation peak.
A second measurement has been performed using the RFTA setup as in Fig. 7 . While in Fig. 5 the liver has been positioned in a chamber that facilitates the insertion, this experiment shows a context closer to a possible application as the liver tissue has not been confined. The RFTA needle (3 mm diameter, 10 mm active length, with two side holes) has been directly positioned into porcine liver, laying on a metallic plate that served as electrode. The LCFBG was passing through the side holes of the needle; the measurement concentrates on the right part of the LCFBG that projects out of the needle for 10 mm. Both needle and LCFBG were then covered with another lobe of liver to restore the symmetry. The applied RF power is 15W, while the initial impedance is 120 Ω. In this case, the duration of the ablation was 134 s, and the ablation trace was smaller and more symmetrical than in Fig. 7, due to the stronger Joule heating near the needle (lower surface area of the electrode and same power).
Fig. 7.
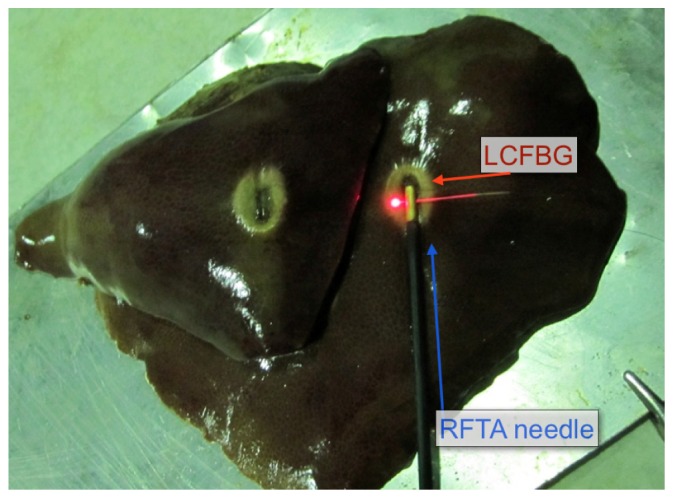
Measurement of temperature distribution along the axis perpendicular to RFTA needle. The needle is inserted through the liver, with the LCFBG projecting on the side through two side holes. The picture shows the liver after the ablation, split between upper and lower part to show the ablation trace on both sides.
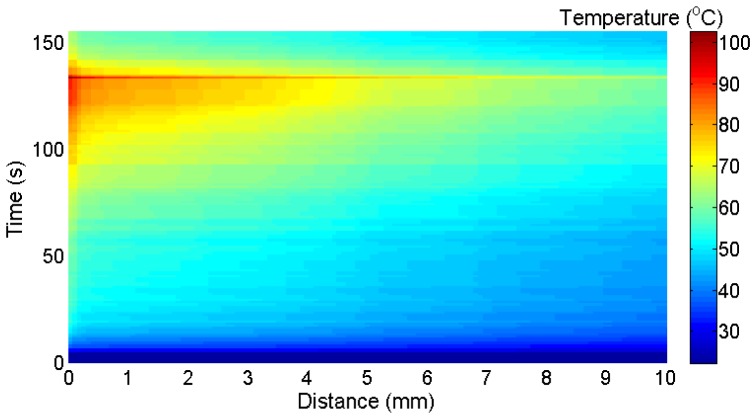
The thermal map of this measurement is shown in Fig. 8 , showing the portion of the LCFBG projecting outside of the needle. In this case the temperature pattern has a different behavior with respect to the previous experiment, and the depth of penetration is inferior. Similarly to Fig. 6, the 0.15-mm region closest to the needle can be identified; in this experiment however the temperature rise is faster, and it does not lie on a plateau before the final burst but it rather grows throughout the whole ablation at a steadier rate. The peak temperature, 102.4°C, is recorded at 134 s and appears all the way through the fiber axis. The surrounding area (0.15-2 mm) already exhibits a noticeable gradient; apart from the final burst, the temperature does not exceed 85°C. Both at low (40-60°C) and high (60-80°C) the spatial gradient is more visible along the LCFBG; the temperature pattern appears to have a noticeable spatial slope, more visible than in Fig. 6 where the thermal map has a more horizontal pattern. Such behavior is correlated to the faster RFTA process, which does not manage to transfer heat with a penetration as effective as with the previous setup; thus, the obtained lesion is smaller, albeit more symmetrical.
Fig. 8.
Thermal map of the RFTA-induced temperature along the axis perpendicular to the needle. The chart reports the temperature (in the color map) as a function of the distance from the fiber tip recorded during heating (132s) and the following cooling.
In order to better highlight the spatial gradient, Fig. 9 reports the thermal map as in Fig. 8 as a contour plot, dividing the analysis in different spatial regions. In the near field (0 – 0.75 mm), it is possible to observe a gradient around 0.15 mm, with a quite neat temperature separation between the two regions; at high temperature the temperature difference appears to be 3-5°C within 0.1 mm difference. The mid-field (1 – 3 mm) shows a more horizontal pattern; while for temperature inferior to 60°C the gradient is perceivable, when the heating process achieves its final part, the temperature contours are approximately horizontal. The far field exhibits a perceivable gradient that shows the depth of penetration of the heat through the LCFBG; the spatial variation, except for the final heating burst, is 0.6 – 1.0°C/mm. All the LCFBG length is exposed to temperature in excess of 60°C, but the length of exposure in the far field decreases from 38 s at 5 mm to 4 s at 10 mm distance.
Fig. 9.
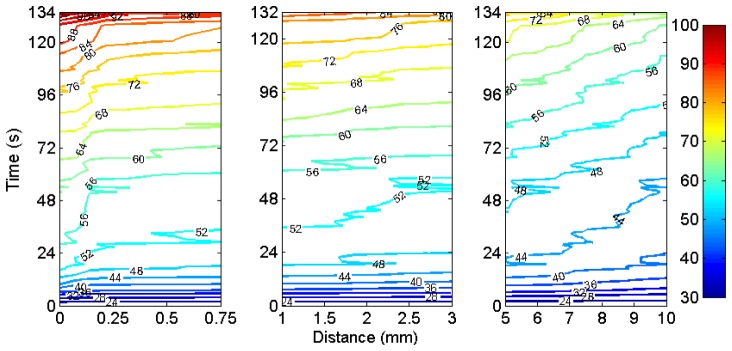
Contour plot of the temperature along the axis perpendicular to the RFTA needle, in near (0-0.75 mm), mid (1-3 mm), and far (5-10 mm) field.
The final experiment was aimed at the temperature detection along the radial axis in a three-dimensional setup. The measurement setup is similar to Fig. 5(a), with the liver positioned inside the cylindrical chamber and the RFTA needle penetrating vertically. In this case, the LCFBG sensor has been positioned through the liver (while in Fig. 5 it was laying on the bottom of the chamber), along the equatorial plane, and in contact with the needle; hence, in this experiment the LCFBG is surrounded by liver tissue on both sides, while in the previous experiment the contact with the chamber slightly alters the temperature profile. The liver impedance was 99 Ω, and the RF applied power was 30 W; since both needle length and liver volume were doubled; this value matches the power density of the first radial experiment. The duration of the ablation was 206 s, and a peak temperature of 101.5°C has been observed. Figure 10 shows the photograph of the liver after the ablation. The thermal map of this experiment is shown in Fig. 10. In this measurement, we observe that the spatial distribution has three quite neat transitions around 0.2 mm, 2.2 mm, and 6.6 mm; within these intervals the temperature preserves an almost uniform behavior during the temperature rise. In proximity of the tip the temperature achieves a plateau at 95°C for about 45 s, while in the surrounding area the temperature is greater than 80°C after 150 s. Once again, the final temperature peak is strongly perceived all the way through. As in the radial measurement, and unlike the vertical positioning, the heat is propagated all the way through the LCFBG in a perceivable way; the ablation trace confirms that the heat transfer along the radial direction is perceivable and correlates with the shape of the ablation.
Fig. 10.
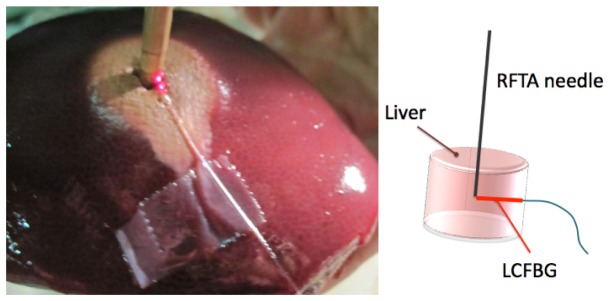
Left: photograph of the liver after the 3D-experiment; red-light illuminates the fiber tip; right: sketch of the ablation setup.
Hence, the LCFBG sensor provides a temperature measurement capability with unprecedented spatial resolution, which allows recording the temperature during the RFTA. The thermal maps show that the possibility to obtain a spatial distribution during the RFTA in the liver can be exploited as a direct metric of the heat propagation (and therefore of the treated zone), but also as a potential predictor of the RFTA duration. In the treatment of hepatic tumors, where the short duration is the main barrier for treatment of large tumors, the control and optimization of the procedure has a direct impact on the RFTA efficiency. The results shown in Figs. 6, 8, and 11 suggest that the thermal evolution pattern, after 60-110 s of RF-heating, could be a predictor of the outcome of the RFTA as it already estimates the depth of penetration into the tissue; this information can be available well before reaching the temperature plateau preceding the final temperature peak, where the procedure is reaching its final stage. The availability of such information can be the foundation of a smart-RFTA procedure, where the outcome of the RFTA is predicted during the procedure and it is possible to dynamically control some parameters to maximize the heat distribution, addressing tumors with larger size.
Fig. 11.
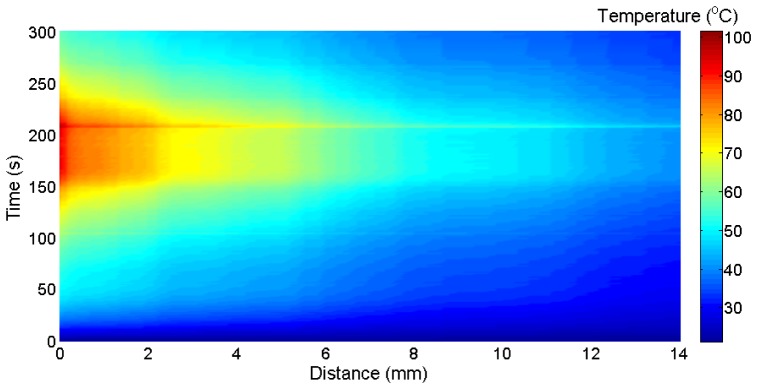
Thermal distribution measured along the equatorial axis in the 3D experiment.
The LCFBG sensor has cost and size compatible with in-vivo insertion, and is based on a biocompatible fiber; in practical application it can be inserted together with the RFTA needle with a micro-catheter for protection. The main advantage of the LCFBG over standard FBG arrays is the possibility to evaluate a thermal distribution with a very short spatial step, while an FBG array identifies a reduced number of active points in a quasi-distributed or multi-point way.
4. Conclusions
The distributed thermal measurement during RFTA procedure in liver has been presented. The sensing setup is based on a LCFBG sensor with 15 mm length and 2.22 nm/mm linear chirp coefficient, and a white light interrogation system that returns 75 μm spatial resolution. Measurements have been performed ex-vivo on porcine liver. Three experiments have been carried out positioning the LCFBG sensor along the equatorial axis with different setups to emphasize the radial, perpendicular, and equatorial thermal field distribution. While peak temperature is always >100°C, the heat propagation is lower in the shortest experiment (134 s duration) since the heat source is more concentrated near the needle. The thermal maps analyze the temperature distribution along the whole RFTA process, recording heat propagation through the liver; the results correlate with the size and shape of ablation obtained on the liver
Acknowledgments
The present work is financially supported by Marie Curie IEF action (MC-IEF-299985) and Science Foundation Ireland RFP (10/RFP/ECE2898). The research is also supported by Fondazione Cura Mini-Invasiva Tumori ONLUS.
References and links
- 1.Xu H.-X., Xie X.-Y., Lu M.-D., Chen J.-W., Yin X.-Y., Xu Z.-F., Liu G.-J., “Ultrasound-guided percutaneous thermal ablation of hepatocellular carcinoma using microwave and radiofrequency ablation,” Clin. Radiol. 59(1), 53–61 (2004). 10.1016/j.crad.2003.09.006 [DOI] [PubMed] [Google Scholar]
- 2.Wood B. J., Ramkaransingh J. R., Fojo T., Walther M. M., Libutti S. K., “Percutaneous tumor ablation with radiofrequency,” Cancer 94(2), 443–451 (2002). 10.1002/cncr.10234 [DOI] [PMC free article] [PubMed] [Google Scholar]
- 3.Goldberg S. N., Gazelle G. S., Mueller P. R., “Thermal ablation therapy for focal malignancy: A unified approach to underlying principles, techniques, and diagnostic imaging guidance,” Am. J. Roentgenol. 174(2), 323–331 (2000). 10.2214/ajr.174.2.1740323 [DOI] [PubMed] [Google Scholar]
- 4.McGhana J. P., Dodd G. D., III, “Radiofrequency ablation of the liver: current status,” Am. J. Roentgenol. 176(1), 3–16 (2001). 10.2214/ajr.176.1.1760003 [DOI] [PubMed] [Google Scholar]
- 5.Curley S. A., “Radiofrequency ablation of malignant liver tumors,” Ann. Surg. Oncol. 10(4), 338–347 (2003). 10.1245/ASO.2003.07.017 [DOI] [PubMed] [Google Scholar]
- 6.Padma S., Martinie J. B., Iannitti D. A., “Liver tumor ablation: percutaneous and open approaches,” J. Surg. Oncol. 100(8), 619–634 (2009). 10.1002/jso.21364 [DOI] [PubMed] [Google Scholar]
- 7.Solbiati L., Livraghi T., Goldberg S. N., Ierace T., Meloni F., Dellanoce M., Cova L., Halpern E. F., Gazelle G. S., “Percutaneous radio-frequency ablation of hepatic metastases from colorectal cancer: long-term results in 117 patients,” Radiology 221(1), 159–166 (2001). 10.1148/radiol.2211001624 [DOI] [PubMed] [Google Scholar]
- 8.Pereira P. L., “Actual role of radiofrequency ablation of liver metastases,” Eur. Radiol. 17(8), 2062–2070 (2007). 10.1007/s00330-007-0587-0 [DOI] [PubMed] [Google Scholar]
- 9.Ogan K., Roberts W. W., Wilhelm D. M., Bonnell L., Leiner D., Lindberg G., Kavoussi L. R., Cadeddu J. A., “Infrared thermography and thermocouple mapping of radiofrequency renal ablation to assess treatment adequacy and ablation margins,” Urology 62(1), 146–151 (2003). 10.1016/S0090-4295(03)00040-2 [DOI] [PubMed] [Google Scholar]
- 10.E. Udd and W. B. Spillman, Fiber Optic Sensors: An Introduction for Engineers and Scientists (Wiley Interscience, New York, 1991). [Google Scholar]
- 11.A. Othonos and K. Kalli, Fiber Bragg Gratings: Fundamentals and Applications (Artech House, 1999). [Google Scholar]
- 12.Mishra V., Singh N., Tiwari U., Kapur P., “Fiber grating sensors in medicine: current and emerging applications,” Sens. Actuators A Phys. 167(2), 279–290 (2011). 10.1016/j.sna.2011.02.045 [DOI] [Google Scholar]
- 13.Taffoni F., Formica D., Saccomandi P., Di Pino G., Schena E., “Optical fiber-based MR-compatible sensors for medical applications: an overview,” Sensors (Basel) 13(10), 14105–14120 (2013). 10.3390/s131014105 [DOI] [PMC free article] [PubMed] [Google Scholar]
- 14.Saccomandi P., Schena E., Silvestri S., “Techniques for temperature monitoring during laser-induced thermotherapy: an overview,” Int. J. Hyperthermia 29(7), 609–619 (2013). 10.3109/02656736.2013.832411 [DOI] [PubMed] [Google Scholar]
- 15.Micco A., Quero G., Crescitelli A., Ricciardi A., Cusano A., “Ultracompact optical fiber Fabry-Perot interferometer based on in-line integrated sub-micron film,” Proc. SPIE 8794, 87940P (2013). 10.1117/12.2025866 [DOI] [Google Scholar]
- 16.Luna Inc , http://lunainc.com/obr4600ts
- 17.Erdogan T., “Fiber grating spectra,” J. Lightwave Technol. 15(8), 1277–1294 (1997). 10.1109/50.618322 [DOI] [Google Scholar]
- 18.Okabe Y., Tsuji R., Takeda N., “Application of chiped fiber Bragg grating sensors for identification of crack location in composites,” Compos., Part A Appl. Sci. Manuf. 35(1), 59–65 (2004). 10.1016/j.compositesa.2003.09.004 [DOI] [Google Scholar]
- 19.Skaar J., Wang L., Erdogan T., “On the synthesis of fiber Bragg gratings by layer peeling,” IEEE J. Quantum Electron. 37(2), 165–173 (2001). 10.1109/3.903065 [DOI] [Google Scholar]


