Abstract
Combining two or more imaging modalities to provide complementary information has become commonplace in clinical practice and in preclinical and basic biomedical research. By incorporating the structural information provided by computed tomography (CT) or magnetic resonance imaging (MRI), the ill poseness nature of bioluminescence tomography (BLT) can be reduced significantly, thus improve the accuracies of reconstruction and in vivo quantification. In this paper, we present a small animal imaging system combining multi-view and multi-spectral BLT with MRI. The independent MRI-compatible optical device is placed at the end of the clinical MRI scanner. The small animal is transferred between the light tight chamber of the optical device and the animal coil of MRI via a guide rail during the experiment. After the optical imaging and MRI scanning procedures are finished, the optical images are mapped onto the MRI surface by interactive registration between boundary of optical images and silhouette of MRI. Then, incorporating the MRI structural information, a heterogeneous reconstruction algorithm based on finite element method (FEM) with L 1 normalization is used to reconstruct the position, power and region of the light source. In order to validate the feasibility of the system, we conducted experiments of nude mice model implanted with artificial light source and quantitative analysis of tumor inoculation model with MDA-231-GFP-luc. Preliminary results suggest the feasibility and effectiveness of the prototype system.
OCIS codes: (110.0110) Imaging systems, (170.3880) Medical and biological imaging, (110.6955) Tomographic imaging
1. Introduction
No single modality has the lock on being the best molecular strategy for whole animal imaging under all circumstances [1]. The combination of two or more imaging modalities, especially providing complementary information on tissue structure and tissue-specific molecular processes, is an attractive concept for improving diagnostic specificity and patient care [2]. The combined systems have the capacity to unveil morphological, functional and molecular variations in disease and therefore enhance the diagnostic and therapeutic accuracy. The combinations of positron emission tomography (PET)/ X-ray computed tomography (CT) [3] and single photon emission computed tomography(SPECT)/CT [4] have become commonplace in clinical practice and in preclinical and basic biomedical research [5]. The combination of PET/magnetic resonance imaging (MRI) [6–8] has appeared in clinical trials these years and its effects are still to be tested.
In preclinical and basic research, optical techniques are prevalent due to the low cost, high throughput and high sensitivity at the level of molecular. The optical techniques are extensively used to diagnose diseases [9, 10], evaluate therapies [11, 12], and facilitate drug development [9, 13]. However, due to the high scattering of biological tissue, it is difficult to estimate the depth of the optical signal and perform accurate quantitative analysis by using the optical signals alone. Therefore, the optical tomography techniques incorporating with a prior structural information provided by CT have been developed, such as fluorescence molecular tomography (FMT) [14], bioluminescence tomography (BLT) [15] and Cerenkov luminescence tomography (CLT) [16]. For the light source reconstruction problem, the advantage of heterogeneous reconstruction over homogeneous reconstruction has been well demonstrated [17–21]. In order to construct more accurate heterogeneous model, incorporating structural information from MRI is more appealing because MRI gives higher details in soft tissues than CT does. Moreover, since MRI can perform versatile analysis at the structural, functional and molecular levels because of the plenty of availability on MRI contrast agents, it is better suited than CT to molecular imaging of tissue function [22]. Stuker et al. designed a hybrid system of FMT with MRI [2] to obtain the signal of optical and MRI simultaneously. Allard et al. developed an MR-compatible platform to fix the small animal for MRI and bioluminescence imaging (BLI) using two commercial MRI and BLI devices [23]. Unlu et al. developed a combined MR-diffuse optical tomographic imaging system to report the simultaneous measurement of optical and MR contrast agent kinetics [24].
Among the various optical imaging approaches, BLT is a promising area for quantitative reconstruction of bioluminescent source distribution within a small animal from optical signals on the animals body surface [25], which can be applied to study many physiological and pathological processes in various small animal models. Since the biological tissue does not emit photons and no external light source is required for excitation, the background noise in bioluminescent signal is very low [26]. Hence, BLT has become an important tool for biomedical researchers in molecular imaging and the combination of BLT and MRI is attracting increased interest.
Generally, in optical imaging, photons emitting from the small animal are commonly detected using cooled charge-coupled detectors (CCD), which does not operate at the high magnetic field strengths of MRI scanners. In order to acquire the synchronous optical signal, fiber array and photo-multiplier tube (PMT) [2, 27–32] are often used to get deep into the magnetic field. However, they can not offer the high space resolution compared with CCD camera. Actually, is it necessary to capture the synchronous bioluminescent signal when scanning the MRI? The answer is not always positive. In most cases, the bioluminescent signal decays over about 1 hour [33]. When it has reached the steady state, it will almost has little change in the next tens of minutes. Moreover, the procedure of bioluminescence imaging takes only a few minutes, and the scanning of MRI is much longer. The two kinds of modalities is inherently not synchronous, and the biggest benefit of synchronous scan is the accurate registration between two molalities. Therefore, if the posture of the small animal keeps the same and the scanning interval between the two modalities is as short as possible, the result of the fusion of the two modalities will be meaningful.
In this paper, we present a small animal imaging system combing multi-view multi-spectral BLT with MRI.The optical device is placed at the end of the clinical MRI scanner to shorten the scanning interval with the maximum possible. The small animal is transferred between the light tight chamber of the optical device and the animal coil of MRI via a guide rail during the experiment, to ensure the same posture of the small animal between two consecutive imaging procedures. In the BLT device, two mirrors are placed beside the animal to obtain the top, left and right views simultaneously. Furthermore, multi-spectral measurements are captured by using band pass filters. After mapping the bioluminescent images onto the structural surface of MRI, the BLT reconstruction and quantitative analysis are performed using our previously developed heterogeneous reconstruction algorithm. In order to validate the feasibility of the system, we first conducted experiment of nude mice model implanted with artificial light source, and then applied the system to quantitative analysis of tumor inoculation model.
The remaining sections are organized as follows. Section 2 gives the description of the system. In Section 3, the reconstruction method of BLT is introduced as well as the evaluation benchmarks. In Section 4, numerical simulation on a heterogeneous cylindrical phantom is analyzed. Section 5 evaluates the reconstruction performance of BLT by the experiment of nude mice implanted with artificial light source. Section 6 gives the in vivo quantitative BLT experiments of tumor inoculation model. Finally, the conclusion and discussion are given in Section 7.
2. System design
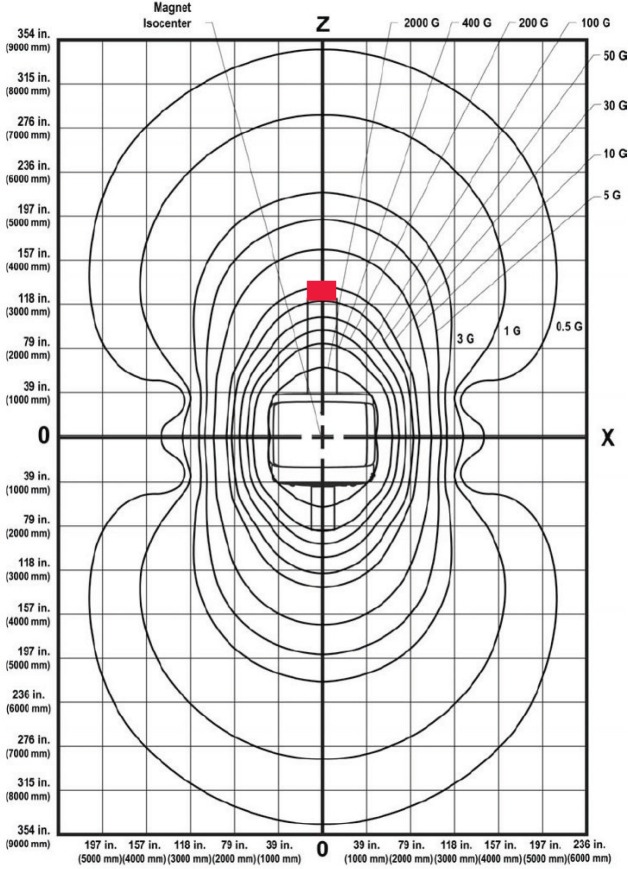
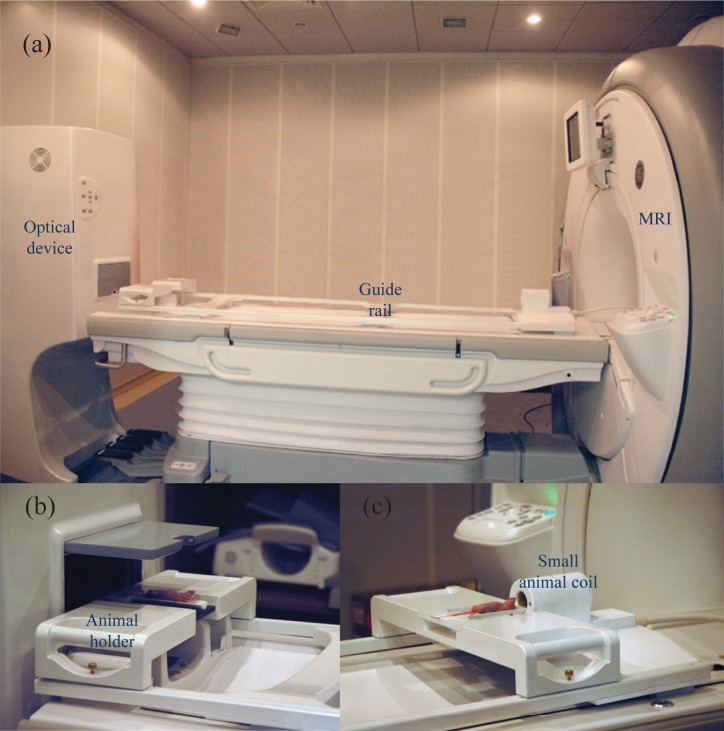
In order to reduce the impact of the optical device to the MRI scanner, the optical device was basically constructed by non-magnetic materials. On the other hand, to protect the CCD camera from strong magnetic field, the optical device should be placed at a safe zone in which the CCD camera could work normally. Figure 1 shows the static magnetic field distribution of the MRI scanning room (GE 750w 3.0T) in the Peking Union Medical College Hospital, Beijing, China. From the field intensity map, the field intensity at the end of the patient bed is about 30 G (red region in Fig. 1). We have tested the CCD camera of our device at about 100 G, there was little effect from the magnetic field. Therefore, considering the magnetic field distribution and the convenience of operation, the optical device is placed at the end of the clinical MRI bed as shown in Fig. 2(a). After the optical imaging, the small animal is transferred from the light tight chamber of the optical device to the animal coil of MRI via a guide rail (Fig. 2(b) and (c)). Finally, the small animal coil is moved into the MRI scanner with the bed.
Fig. 1.
Magnetic field distribution (offered by GE Healthcare, China).
Fig. 2.
Integrated BLT and MRI system. (a) Placement of the optical and MRI devices. (b) Animal holder. (c) Small animal coil of MRI.
In order to achieve multi-view optical images simultaneously, mirrors were often adopted to acquire the photon distributions from different views [33–35]. Our BLT system uses two mirrors (left and right) which are canted 45 degrees and are placed beside the animal as shown in Fig. 3. Furthermore, the multi-spectral photon distributions are obtained via the filter wheel. The surface of small animal is obtained by MRI and the multi-view mirror is actually used to capture the bioluminescent information from different view angles.
Fig. 3.
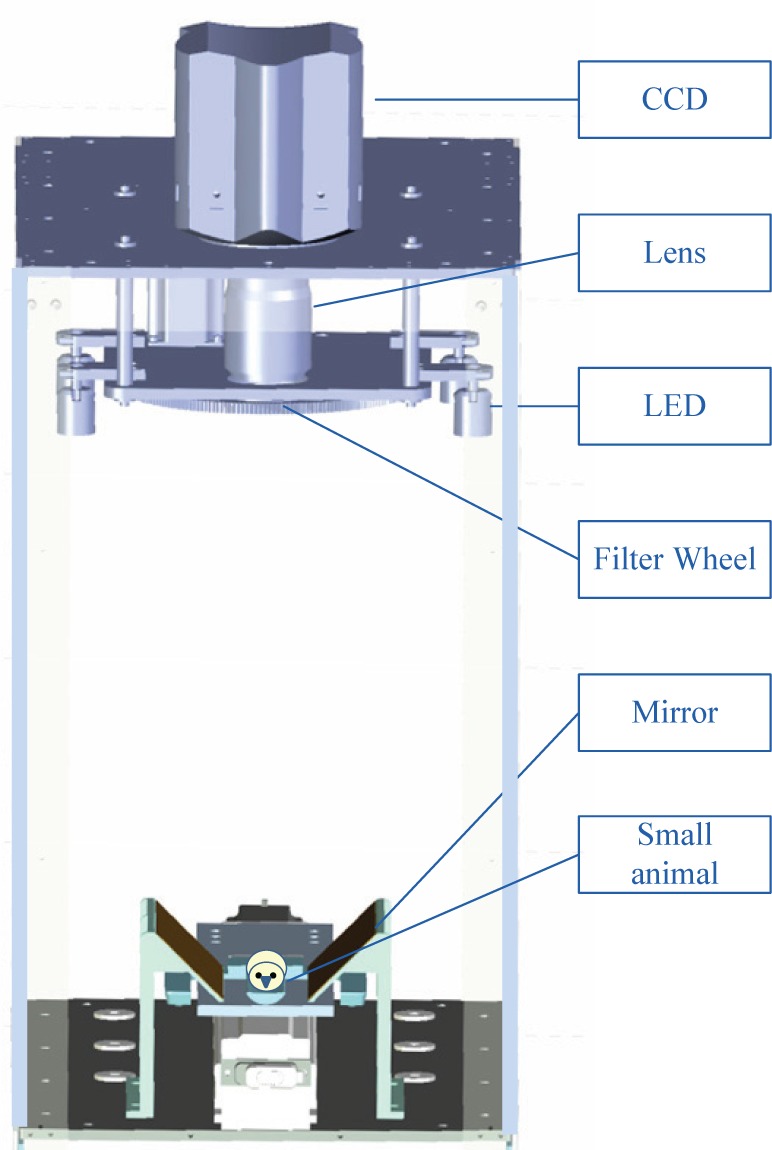
Structure inside the light tight chamber of the optical device.
The system uses a highly sensitive CCD camera (Andor iXon3 888 large field of view and megapixel back-illuminated EMCCD) which offers 1024 × 1024 pixels, 13μm pixel size, with single photon detection capability and larger than 90% quantum efficiency. The camera can be cooled down to −80°C with air cooling (even lower temperature down to −95°C with chiller liquid cooling). The typical CCD read noise is less than 1 e rms and the dark current is 5×10⁻⁴ e/pixel/sec. The camera is coupled with a Nikon Micro-NIKKOR manual focus lens with about 30 × 30cm field of view at 60cm distance.
3. Method
3.1. BLT reconstruction
The process of photon propagation in biological tissue can be described accurately by the radiative transfer equation (RTE) [36–38]. However, the high computational cost of RTE makes it inappropriate for BLT reconstruction directly. Various approximations of RTE, such as discrete ordinates [39, 40], spherical harmonics [41], and the diffusion approximation (DA) [42] are used in practice. In the near infrared light spectrum, photon scattering usually predominates over absorption in the biological tissue. Thus, the photon propagation can be described by the following DA model [43] depending on the light wavelength λ:
| (1) |
where x is the position vector, Ω ∈ R 3 is the problem domain, Sλ (x) is the source distribution [Watts/mm 3], Φλ (x) is the photon flux density [Watts/mm 2], μλα (x) is the absorption coefficient [mm −1] and D(x) = 1/(3μλα (x) + μ′λs(x))) [mm], while μ′λs(x) is the reduced scattering coefficient [mm −1].
Since we perform the heterogeneous reconstruction, the small animal should be segmented into different organs and then specific optical parameters are assigned to each organs. MRI can provide high image quality of soft tissues which give more accurate segmentation results that enhances the reconstruction performance.
Because the bioluminescence imaging experiment is performed in a totally dark environment, there is no photon travels across the boundary ∂Ω into the tissue domain Ω. The equation is subject to a Robin boundary condition [26,44]:
| (2) |
where v(x) represents the unit outer normal on the boundary ∂Ω and A is the boundary mismatch factor, A(x; n, n′) ≐ (1 + R(x))/(1 − R(x)), and R ≐ −1.4399n −2 + 0.7099n −1 + 0.6681+ 0.0636n [45], where n is the ratio of optical reflective index of the inner tissue to that outside the boundary. Then, the measured quantity is the outgoing photon density on ∂Ω [46]:
| (3) |
The finite element method (FEM) is a powerful tool for solving the DA equation, and has been extensively applied in BLT reconstruction in the past years [15, 26, 47–49]. After the discretization using FEM, the diffusion equation (1) and the boundary condition (2) can be expressed as the following matrix form:
| (4) |
where, M λ = K λ + C λ + B λ is a positive-definite matrix, and K λ, C λ, and B λ are mass, stiff and boundary matrix respectively. F λ is the source weight matrix, Φλ and S λ are the collection of all the nodal values of the photon desity Φλ (x) and source density Sλ (x) respectively. Then, the photon density Φλ can be obtained from equation (4):
| (5) |
In fact, in our system, only partial photon on the boundary can be acquired for the reconstruction. Therefore, is used to denote the measurable boundary data. According to the uniqueness theorem, the BLT solution is not unique in the general case [50], a strong prior knowledge must be incorporated into the reconstruction to overcome the ill-posedness effectively. The prior information such as permissible region of source should be imposed on the unknown variables to obtain a meaningful reconstruction performance. Moreover, a multi-spectral BLT reconstruction procedure is adopted to refine the ill-posedness [51]. Considering the permissible source region Sp, we obtain the linear relation between the measurable photon density and source density Sp.
| (6) |
where coefficient matrix A λ = M λ −1 F λ, while its columns corresponds to the forbidden region (not in the permissible region) is removed to fit the equation.
By performing a spectral analysis, the coefficient matrix A λ and source density Sp are concatenated together by using specific wights ωλ as follow:
| (7) |
where, , denotes the total photon density, and A and Φmeas is defined as:
| (8) |
| (9) |
where N is the total number of spectrum involved, and the wight ωλ > 0 and meets the formula .
In order to obtain a stable solution, the optimization objective function is defined using L 1 regularization method:
| (10) |
where is the upper bound of the source density, α is the regularization parameter.
3.2. Benchmarks
Mostly, the position error of the distance between the actual source position and the reconstructed source position is used to evaluate the performance of reconstruction and position error 𝒫 is defined as [52]:
| (11) |
where (xr, yr, zr) is the center coordinate of the reconstruction source, and (x 0, y 0, z 0) is that of the actual source center.
The relative error of the power density between the actual source and the reconstructed source plays an important role in quantitative analysis, since the reconstructed power reflects the concentration of luciferase molecules and luciferin. It is defined as [53]:
| (12) |
where Sr is the power of reconstruction and S 0 is the power of real source.
However, just using the above two benchmarks may not reflect the real reconstruction performance. In order to give more comprehensive evaluation, we adopt the measurement of overlap which is often used for the segmentation evaluation [54]. The overlap between the reconstructed region Rr and real source region R 0 is defined as:
| (13) |
Although it is difficult to reconstruct the accurate structure of the light source, the degree of overlap still demonstrates the performance of BLT reconstruction.
4. Numerical simulation
The numerical simulation was performed on a heterogeneous cylindrical phantom that contains different ellipsoidal organs. The phantom was generated and decomposed into mesh by the software of COMSOL. Specifically, the cylindrical phantom had a diameter of 30mm and height of 30mm shown in Fig. 4. The light source was a cylinder with a diameter of 2mm and height of 2mm and was located at (8mm, 15mm, 0mm). The Phantom was discredited into 9490 vertex nodes and 52801 tetrahedral elements. Similar to [51], we divided the spectrum into three regions: [400nm, 530nm], [530nm, 630nm] and [630nm, 750nm]. The weights of the spectral regions were ω λ1 = 0.29, ω λ2 = 0.48 and ω λ3 = 0.23. The optical parameters for the component in the phantom are shown in Table 1. In order to avoid the inverse crime problem, the synthetic data was produced by Molecular Optical Simulation Environment (MOSE) which is developed based on Monte Carlo method [55]. The source had a photon density of 300pW/mm 3. In order to make a fair estimate of the reconstruction results with different view angles, the same permissible region of source was applied for the reconstruction. The permissible region is .
Fig. 4.

Heterogeneous cylindrical phantom with different ellipsoidal organs.
Table 1.
Optical parameters (mm −1) for regions of the phantom
| A | B | C | D | E | |
|---|---|---|---|---|---|
| μ αλ1 | 0.0052 | 0.0103 | 0.1550 | 0.0078 | 0.3214 |
| μ′ sλ1 | 1.081 | 1.974 | 2.5329 | 1.008 | 3.6897 |
| μ αλ2 | 0.0068 | 0.0233 | 0.1021 | 0.0104 | 0.3516 |
| μ′ sλ2 | 1.031 | 1.880 | 2.4144 | 0.986 | 3.8038 |
| μ αλ3 | 0.0088 | 0.0423 | 0.0981 | 0.0300 | 0.3727 |
| μ′ sλ3 | 1.001 | 1.833 | 2.2847 | 0.954 | 4.2579 |
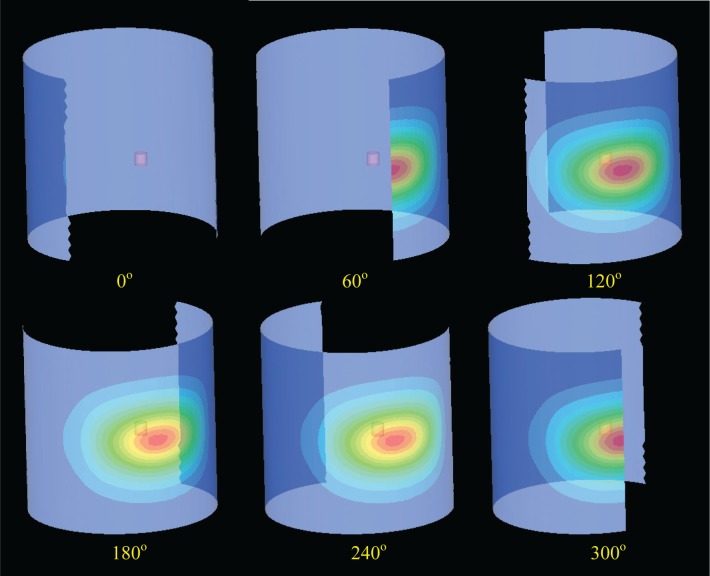
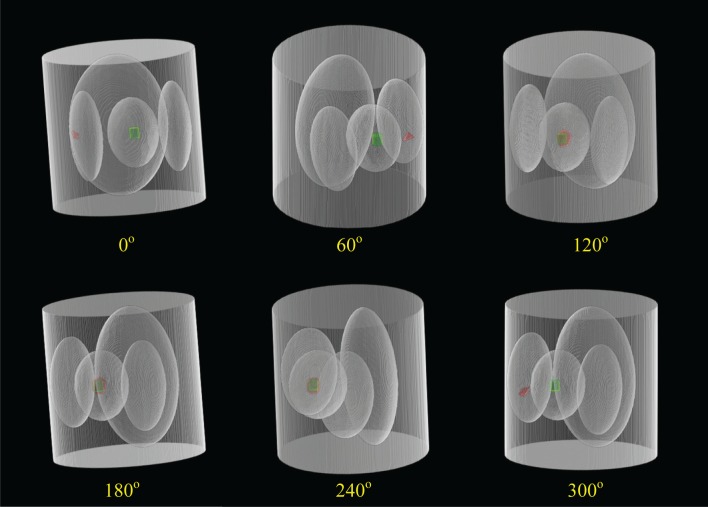
The measurable photon density was the surface data within 270° around the cylindrical phantom. The synthetic data from different view angles are shown in Fig. 5. The reconstruction results are shown in Fig. 6. The quantitative benchmarks are shown in Table 2. Obviously, the reconstruction failed at the view angles of 0°, 60° and 300°, while results at other angles are somewhat acceptable. This is because the data from the view angles of 0°, 60° and 300° lost too much important photon distribution information, on the other hand, the view angles of 120°, 180° and 240° retain most of the photon distribution information. Therefore, when the most of photon distribution from the surface is captured, our method could achieve satisfactory reconstruction performance. Fortunately, most of the optical information could be obtained from the three view angles (top and two sides). In general, if the optical information is too weak from the top view, it is better to consider to turn the small animal over.
Fig. 5.
Surface data from different view angles.
Fig. 6.
Reconstruction results at different view angles. Regions in green are the true light sources. Regions in red are the reconstructed light sources.
Table 2.
Benchmarks for the reconstructions at different view angles
| position error (𝒫) | relative error (ℛ) | overlap (𝒪) | |
|---|---|---|---|
| 0° | 10.55 mm | 198.72% | 0 |
| 60° | 4.38 mm | 63.36% | 0 |
| 120° | 0.31 mm | 24.94% | 70.34% |
| 180° | 0.41 mm | 22.17% | 75.73% |
| 240° | 0.38 mm | 23.85% | 71.92% |
| 300° | 4.53 mm | 70.11% | 0 |
5. In vivo experiment
5.1. System calibration
In the literatures, in order to quantify the absolute energy distribution, the integrating sphere was often used for the camera calibration [18, 26]. Since the power of the reconstructed source is directly proportional to the concentration of tumor cells, in this paper, we used the quantitative method in [18] (see Section 6 for details), which does not require the absolute power of the reconstructed source. Beside, the distances between the lens and animal surface should be considered. Although the distance variation is not very large in single view surface, the distance between the lens and top view is shorter than that between the lens and mirror views, which cannot be ignored. Moreover, the reflectivity of the mirrors is not 100 percent. Therefore, we measured the intensity values of a same light source from different views, and a factor of 1.3158 was calculated. The intensities of the two mirror views were multiplied by the factor for calibration purpose.
5.2. Experiment on implanted mouse model
In order to make an accurate evaluation of BLT imaging system and its reconstruction algorithm, three nude mice were used as research objects which were labeled as LS_1 LS_2 and LS_3. The nude mice were injected 0.2ml of anesthetic at a 0.2g/ml concentration via intraperitoneal injection. Three glass tubes filled with bioluminescent liquid were implanted into the abdomen of the three mice respectively. The bandpass filters involved were [560, 600]nm, [600, 640]nm and [640, 680]nm. The approximate spectral distributions were obtained via the experiment of directly imaging the glass tubes with different filters. Mostly, the summations of intensity from the filters were less than the original intensities without filter, we normalized the weights to meet the formula . Thus, the weights for the filters were ω λ1 = 0.25, ω λ2 = 0.41 and ω λ3 = 0.34 respectively. The optical properties of the mouse organs were calculated according to the literature [56] and the relative parameters from web-site http://omlc.ogi.edu/spectra/index.html, which are shown in Table 3.
Table 3.
Optical parameters (mm −1) for in vivo experiment
| muscle | heart | lung | liver | stomach | kidneys | |
|---|---|---|---|---|---|---|
| μ αλ1 | 1.4860 | 1.0790 | 3.1318 | 6.4738 | 0.2158 | 1.2085 |
| μ′ sλ1 | 0.6445 | 1.1847 | 2.3466 | 0.7890 | 1.6527 | 2.8013 |
| μ αλ2 | 0.2024 | 0.1372 | 0.4561 | 0.8225 | 0.0274 | 0.1537 |
| μ′ sλ2 | 0.5340 | 1.0769 | 2.2651 | 0.7356 | 1.5492 | 2.5329 |
| μ αλ3 | 0.0994 | 0.0671 | 0.2245 | 0.4019 | 0.0134 | 0.0753 |
| μ′ sλ3 | 0.4477 | 0.9848 | 2.1913 | 0.6889 | 1.4580 | 2.3048 |
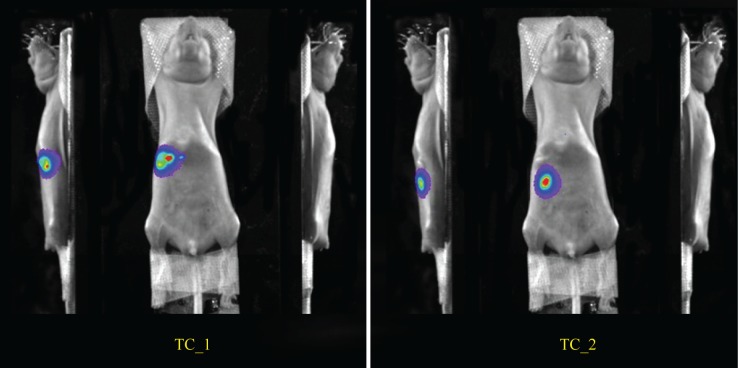
The mice were placed in the the optical device for imaging (the exposure time was 20 s), and the overlay images of photographs and bioluminescent images are shown in Fig. 7. Then, the mice were transferred to the MRI scanner by the guide rail for the MRI scanning. The MRI data was T1 weighted image with TR = 9 ms and TE = 4 ms. After these data were obtained, the organs (muscle, heart, lungs, liver, stomach and kidneys) of the MRI data were segmented interactively, and were subdivided into tetrahedrons by the software of AMIRA. In order to map the bioluminescent intensities to the MRI surface, the registration between the 2D optical images and the 3D MRI surface should be conducted first. The optical boundaries of small animal were extracted by simple segmentation method. Since the posture change between the optical and MR scans is minimal, we conducted the rigid registration by calculating the differences between boundaries of optical images and silhouette of MRI. After the optical boundaries coincide with the MRI silhouette, the bioluminescent intensities were mapped to the MRI surface by the principle of small hole imaging. The permissible regions of the three mice were , and . The real positions of the light source tubes were (42.6, 52.1, 12.3), (45.0, 53.5, 13.0) and (46.6, 46.5, 14.8), which were determined manually in the MRI images.
Fig. 7.
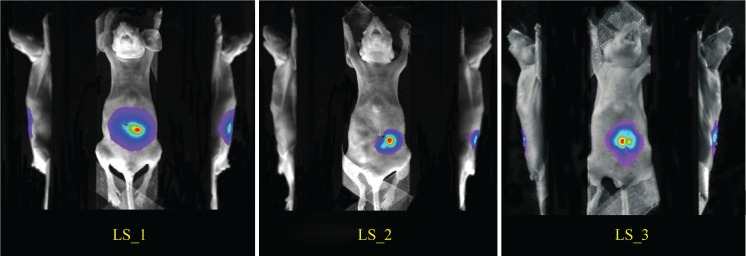
Overlay images of photographs and bioluminescence images.
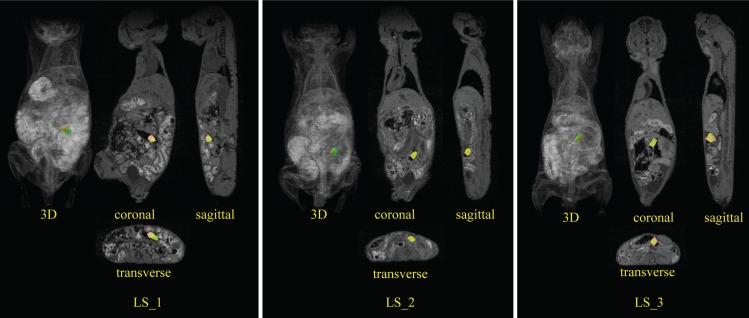
The reconstructions are shown in Fig. 8 and the benchmarks are shown in Table 4. The position error are about 1 mm for the three mice which are allowable compared with the size of the implanted source. The relative error and overlap are also acceptable for the BLT reconstruction. The results suggest the reliability of the system and reconstruction algorithm.
Fig. 8.
Reconstructions of artificial light source. The green regions are the real light sources, the red regions are the reconstructed sources
Table 4.
Benchmarks for the reconstruction of the implanted mouse models
| position error (𝒫) | relative error (ℛ) | overlap (𝒪) | |
|---|---|---|---|
| LS_1 | 1.26 mm | 38.16% | 43.94% |
| LS_2 | 1.13 mm | 33.86% | 45.76% |
| LS_3 | 0.74 mm | 43.43% | 58.52% |
6. In vivo experiment on tumor inoculation model
In order to quantitative analyze the BLT reconstruction in real application, it is better to calculate the number of tumor cells in the lesion. Generally, the relationship between total reconstructed power and number of cells varies with different category of cells. However, for one specific tumor cell, the resultant light intensity is directly proportional to the number of luciferase molecules and the concentration of the luciferin [26]. Therefore, Liu et al. performed the linear relationship between total power and the luciferase molecular cells to quantitatively evaluate the BLT reconstruction [18]. Similarly, in this paper, we first conducted pre-experiment to find the relationship between the total reconstructed power and the number of cell MDA-231-GFP-luc. Then, the experiment on tumor inoculation model with same cell was given.
6.1. Linear relation between reconstructed power and number of cells
In this experiment, the nude mice were injected the luciferin coupled with different numbers of MDA-231-GFP-luc cells (0.55×10⁵, 1.10×10⁵, 2.19×10⁵, 4.38×10⁵) into the hepatic lobes. Meanwhile, the control group of the same cells mixed with luciferin were injected into a 96-well plate. It should be emphasized that the control group was used to evaluate the power error, which was not used for the quantification. Then, the multi-spectral images were acquired 30 minutes after inoculation of the tumor cells. The exposure time was 120 s for both the in vitro and in vivo experiments. Figure 9 shows the relationship between the total power and tumor cell of both in vitro and in vivo experiments. The total power is the reconstructed power multiplied by the reconstructed region for BLT. As expected, the intensity value of in vitro well fit a linear function (correlation coefficient R 2 = 0.9930) as well as the result of BLT (R 2 = 0.9885), and the average of relative error ℛ is 0.3661. However, the BLI can not fit a linear function (R 2 = 0.4914) which also suggests the necessity of BLT. As shown in Fig. 9, the linear function of BLT is x = 370.3704y − 9903.3612 which will be used to evaluate the number of tumor cells in the following experiment.
Fig. 9.

Relationship between the total power and tumor cell, x-axis is the number of cells and y-axis is the power measured by intensity value. (a) is the result of in vitro experiment, (b) is the result of BLI and (c) is the result of BLT.
6.2. In vivo experiment on tumor of MDA-231-GFP-luc cell
The in vivo experiment in this part is based on the tumor inoculation model of MDA-231-GFP-luc cell. 5 × 10⁶ cells were given by tail vein injection. The tumor in the mouse labeled as TC_1 was implanted for 2 weeks and the tumor in the mouse labeled as TC_2 was implanted for 1 week. We used three bandpass filters of [560, 600]nm, [600, 640]nm and [640, 680]nm. The weights for the filters were ω λ1 = 0.21, ω λ2 = 0.54 and ω λ3 = 0.25 respectively. According to the bioluminescent information distribution from the mice surfaces, the permissible regions of the the two mice were and .
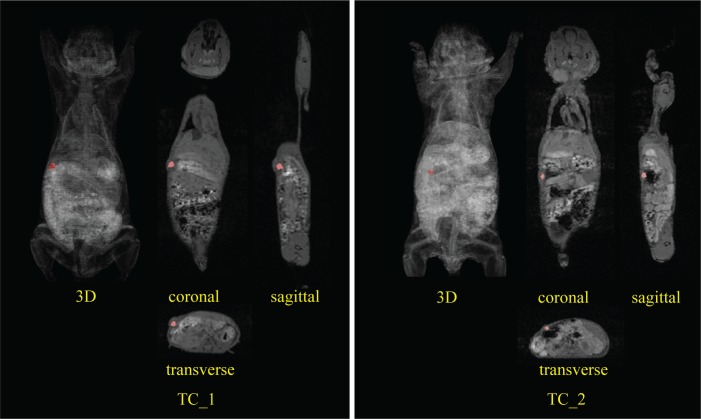
The overlay optical images are shown in Fig. 10. It is difficult to find the accurate locations and regions of tumor from the MRI data. The reconstructions are shown in Fig. 11, and the real location and region of the tumor might roughly be judged by the convex of the surface. The reconstructed powers and number of cells are shown in Table 5, where the number of tumor cells was calculated by the linear function x = 370.3704y − 9903.3612. The rough order of magnitudes coincide with literature report of tumor inoculation during the first week and two weeks [57].
Fig. 10.
Overlay images of photographs and bioluminescence images.
Fig. 11.
Reconstructions of nude mice with tumors. The red regions are the reconstruction sources.
Table 5.
The benchmarks for the reconstructions of tumor inoculation models
| Total power | Number of cell | |
|---|---|---|
| TC_1 | 143429 | 5.3112 × 10⁷ |
| TC_2 | 10209 | 3.7712 × 10⁶ |
7. Conclusion
We have developed a MRI-compatible optical device for BLT reconstruction. Both the simulation and in vivo experiments suggest the reliability of our system and algorithm. However, it is difficult to give an accurate evaluation of the performance of quantitative reconstruction of tumor inoculation by MRI. In our future work, PET will be involved for the evaluation.
Accurate quantitative analysis is a primary advantage for bioluminescence tomography in the applications of cancer detection and monitoring, which can be facilitated by fusing MRI modality because of its better imaging quality of soft tissue. The MRI-compatible optical imaging system further promotes the development of fusing MRI and optical imaging. In addition, together with the plenty of availability on MRI contrast agents, we believe that the fusion of MRI and optical imaging has great potentials in the vast biomedical applications.
Acknowledgments
This research was supported by the 973 program under Grant 2011CB707702, the National Key Technology Support Program of China under Grant 2012BAI23B06, and the National Natural Science Foundation of China under Grant Nos. 81090272 and 81227901. Authors Jun Zhang and Duofang Chen contributed equally to this paper. The authors would like to thank the engineers from GE Healthcare China, Zheng Xiao and Liya Ma, for measuring the magnetic field distribution of the MRI scanning room in the Peking Union Medical College Hospital, Jingjuan Liu for giving assistance of animal experiments in the Peking Union Medical College Hospital.
References and links
- 1.Baker M., “Whole-animal imaging: The whole picture,” Nature 463, 977–980 (2010). 10.1038/463977a [DOI] [PubMed] [Google Scholar]
- 2.Stuker F., Baltes C., Dikaiou K., Vats D., Carrara L., Charbon E., Ripoll J., Rudin M., “Hybrid small animal imaging system combining magnetic resonance imaging with fluorescence tomography using single photon avalanche diode detectors,” IEEE Trans. Med. Imaging 30, 1265–1273 (2011). 10.1109/TMI.2011.2112669 [DOI] [PubMed] [Google Scholar]
- 3.Beyer T., Townsend D. W., Brun T., Kinahan P. E., Charron M., Roddy R., Jerin J., Young J., Byars L., Nutt R., “A combined pet/ct scanner for clinical oncology,” J. Nucl. Med. 41, 1369–1379 (2000). [PubMed] [Google Scholar]
- 4.Gaemperli O., Schepis T., Valenta I., Husmann L., Scheffel H., Duerst V., Eberli F. R., Luscher T. F., Alkadhi H., Kaufmann P. A., “Cardiac image fusion from stand-alone spect and ct: clinical experience,” J. Nucl. Med. 48, 696–703 (2007). 10.2967/jnumed.106.037606 [DOI] [PubMed] [Google Scholar]
- 5.Cherry S. R., “Multimodality imaging: Beyond pet/ct and spect/ct,” in Seminars in Nuclear Medicine,, vol. 39 (Elsevier, 2009), vol. 39, pp. 348–353 10.1053/j.semnuclmed.2009.03.001 [DOI] [PMC free article] [PubMed] [Google Scholar]
- 6.Judenhofer M. S., Wehrl H. F., Newport D. F., Catana C., Siegel S. B., Becker M., Thielscher A., Kneilling M., Lichy M. P., Eichner M., Klingel K., Reischl G., Widmaier S., Rocken M., Nutt R., Machulla H. J., Uludag K., Cherry S. R., Claussen C. D., Pichler B. J., “Simultaneous pet-mri: a new approach for functional and morphological imaging,” Nat. Med. 14, 459–465 (2008). 10.1038/nm1700 [DOI] [PubMed] [Google Scholar]
- 7.Pichler B. J., Kolb A., Nägele T., Schlemmer H.-P., “Pet/mri: paving the way for the next generation of clinical multimodality imaging applications,” J. Nucl. Med 51, 333–336 (2010). 10.2967/jnumed.109.061853 [DOI] [PubMed] [Google Scholar]
- 8.Ratib O., Beyer T., “Whole-body hybrid pet/mri: ready for clinical use?” Eur. J. Nucl. Med. Mol. Imaging 38, 992–995 (2011). 10.1007/s00259-011-1790-4 [DOI] [PubMed] [Google Scholar]
- 9.Licha K., Olbrich C., “Optical imaging in drug discovery and diagnostic applications,” Adv. Drug Delivery Rev. 57, 1087–1108 (2005). 10.1016/j.addr.2005.01.021 [DOI] [PubMed] [Google Scholar]
- 10.Choi H. S., Gibbs S. L., Lee J. H., Kim S. H., Ashitate Y., Liu F., Hyun H., Park G., Xie Y., Bae S., Henary M., Frangioni J. V., “Targeted zwitterionic near-infrared fluorophores for improved optical imaging,” Nat. Biotechnol. 31, 148–153 (2013). 10.1038/nbt.2468 [DOI] [PMC free article] [PubMed] [Google Scholar]
- 11.Jiang S., Gnanasammandhan M. K., Zhang Y., “Optical imaging-guided cancer therapy with fluorescent nanoparticles,” J. R. Soc., Interface 7, 3–18 (2010). 10.1098/rsif.2009.0243 [DOI] [PMC free article] [PubMed] [Google Scholar]
- 12.Cho S., Kim S., Kim Y., Park Y., “Optical imaging techniques for the study of malaria,” Trends Biotechnol. 30, 71–79 (2012). 10.1016/j.tibtech.2011.08.004 [DOI] [PubMed] [Google Scholar]
- 13.Willmann J. K., van Bruggen N., Dinkelborg L. M., Gambhir S. S., “Molecular imaging in drug development,” Nat. Rev. Drug Discovery 7, 591–607 (2008). 10.1038/nrd2290 [DOI] [PubMed] [Google Scholar]
- 14.Ale A., Ermolayev V., Herzog E., Cohrs C., de Angelis M. H., Ntziachristos V., “Fmt-xct: in vivo animal studies with hybrid fluorescence molecular tomography-x-ray computed tomography,” Nat. Meth. 9, 615–620 (2012). 10.1038/nmeth.2014 [DOI] [PubMed] [Google Scholar]
- 15.Wang G., Cong W., Durairaj K., Qian X., Shen H., Sinn P., Hoffman E., McLennan G., Henry M., “In vivo mouse studies with bioluminescence tomography,” Opt. Express 14, 7801–7809 (2006). 10.1364/OE.14.007801 [DOI] [PubMed] [Google Scholar]
- 16.Zhong J., Tian J., Yang X., Qin C., “Whole-body cerenkov luminescence tomography with the finite element sp3 method,” Ann. Biomed. Eng. 39, 1728–1735 (2011). 10.1007/s10439-011-0261-1 [DOI] [PubMed] [Google Scholar]
- 17.Lv Y., Tian J., Cong W., Wang G., Yang W., Qin C., Xu M., “Spectrally resolved bioluminescence tomography with adaptive finite element analysis: methodology and simulation,” Phys. Med. Biol. 52, 4497 (2007). 10.1088/0031-9155/52/15/009 [DOI] [PubMed] [Google Scholar]
- 18.Liu J., Wang Y., Qu X., Li X., Ma X., Han R., Hu Z., Chen X., Sun D., Zhang R., “In vivo quantitative bioluminescence tomography using heterogeneous and homogeneous mouse models,” Opt. Express 18, 13102 (2010). 10.1364/OE.18.013102 [DOI] [PMC free article] [PubMed] [Google Scholar]
- 19.Tian J., Liu K., Lu Y., Qin C., Yang X., Zhu S., Han D., Feng J., Ma X., Chang Z., “Evaluation of the simplified spherical harmonics approximation in bioluminescence tomography through heterogeneous mouse models,” Opt. Express 18, 20988–21002 (2010). 10.1364/OE.18.020988 [DOI] [PubMed] [Google Scholar]
- 20.Naser M. A., Patterson M. S., “Bioluminescence tomography using eigenvectors expansion and iterative solution for the optimized permissible source region,” Biomed. Opt. Express 2, 3179–3193 (2011). 10.1364/BOE.2.003179 [DOI] [PMC free article] [PubMed] [Google Scholar]
- 21.Zhang Q., Chen X., Qu X., Liang J., Tian J., “Comparative studies of lp-regularization-based reconstruction algorithms for bioluminescence tomography,” Biomed. Opt. Express 3, 2916–2936 (2012). 10.1364/BOE.3.002916 [DOI] [PMC free article] [PubMed] [Google Scholar]
- 22.Brindle K., “New approaches for imaging tumour responses to treatment,” Nat. Rev. Cancer 8, 94–107 (2008). 10.1038/nrc2289 [DOI] [PubMed] [Google Scholar]
- 23.Allard M., Côté D., Davidson L., Dazai J., Henkelman R. M., “Combined magnetic resonance and bioluminescence imaging of live mice,” J. Biomed. Opt. 12, 034018 (2007). 10.1117/1.2745298 [DOI] [PubMed] [Google Scholar]
- 24.Unlu M. B., Lin Y., Birgul O., Nalcioglu O., Gulsen G., “Simultaneous in vivo dynamic magnetic resonance-diffuse optical tomography for small animal imaging,” J. Biomed. Opt. 13, 060501 (2008). 10.1117/1.3041165 [DOI] [PMC free article] [PubMed] [Google Scholar]
- 25.Gong R., Wang G., Cheng X., Han W., “A novel approach for studies of multispectral bioluminescence tomography,” Numerische Mathematik 115, 553–583 (2010). 10.1007/s00211-010-0293-8 [DOI] [Google Scholar]
- 26.Cong W., Wang G., Kumar D., Liu Y., Jiang M., Wang L. V., Hoffman E. A., McLennan G., McCray P. B., Zabner J., “Practical reconstruction method for bioluminescence tomography,” Opt. Express 13, 6756–6771 (2005). 10.1364/OPEX.13.006756 [DOI] [PubMed] [Google Scholar]
- 27.Ntziachristos V., Yodh A., Schnall M., Chance B., “Concurrent mri and diffuse optical tomography of breast after indocyanine green enhancement,” Proc. Nat. Acad. Sci. USA 97, 2767–2772 (2000). 10.1073/pnas.040570597 [DOI] [PMC free article] [PubMed] [Google Scholar]
- 28.Brooksby B., Pogue B. W., Jiang S., Dehghani H., Srinivasan S., Kogel C., Tosteson T. D., Weaver J., Poplack S. P., Paulsen K. D., “Imaging breast adipose and fibroglandular tissue molecular signatures by using hybrid mri-guided near-infrared spectral tomography,” Proc. Nat. Acad. Sci. USA 103, 8828–8833 (2006). 10.1073/pnas.0509636103 [DOI] [PMC free article] [PubMed] [Google Scholar]
- 29.Brooksby B. A., Dehghani H., Pogue B. W., Paulsen K. D., “Near-infrared (nir) tomography breast image reconstruction with a priori structural information from mri: algorithm development for reconstructing heterogeneities,” IEEE J. Sel. Top. Quantum Electron. 9, 199–209 (2003). 10.1109/JSTQE.2003.813304 [DOI] [Google Scholar]
- 30.Choe R., Corlu A., Lee K., Durduran T., Konecky S. D., Grosicka-Koptyra M., Arridge S. R., Czerniecki B. J., Fraker D. L., DeMichele A., Chance B., Rosen M. A., Yodh A. G., “Diffuse optical tomography of breast cancer during neoadjuvant chemotherapy: a case study with comparison to mri,” Med. Phys. 32, 1128 (2005). 10.1118/1.1869612 [DOI] [PubMed] [Google Scholar]
- 31.Davis S. C., Pogue B. W., Springett R., Leussler C., Mazurkewitz P., Tuttle S. B., Gibbs-Strauss S. L., Jiang S. S., Dehghani H., Paulsen K. D., “Magnetic resonance–coupled fluorescence tomography scanner for molecular imaging of tissue,” Rev. Sci. Instrum. 79, 064302 (2008). 10.1063/1.2919131 [DOI] [PMC free article] [PubMed] [Google Scholar]
- 32.Davis S. C., Samkoe K. S., Tichauer K. M., Sexton K. J., Gunn J. R., Deharvengt S. J., Hasan T., Pogue B. W., “Dynamic dual-tracer mri-guided fluorescence tomography to quantify receptor density in vivo,” Proc. Nat. Acad. Sci. USA 110, 9025–9030 (2013). 10.1073/pnas.1213490110 [DOI] [PMC free article] [PubMed] [Google Scholar]
- 33.Wang G., Shen H., Durairaj K., Qian X., Cong W., “The first bioluminescence tomography system for simultaneous acquisition of multiview and multispectral data,” Int. J. Biomed. Imaging 2006, 58601 (2006). 10.1155/IJBI/2006/58601 [DOI] [PMC free article] [PubMed] [Google Scholar]
- 34.Chaudhari A. J., Darvas F., Bading J. R., Moats R. A., Conti P. S., Smith D. J., Cherry S. R., Leahy R. M., “Hyperspectral and multispectral bioluminescence optical tomography for small animal imaging,” Phys. Med. Biol. 50, 5421 (2005). 10.1088/0031-9155/50/23/001 [DOI] [PubMed] [Google Scholar]
- 35.Hillman E. M., Moore A., “All-optical anatomical co-registration for molecular imaging of small animals using dynamic contrast,” Nat. Photonics 1, 526–530 (2007). 10.1038/nphoton.2007.146 [DOI] [PMC free article] [PubMed] [Google Scholar]
- 36.Arridge S., Schweiger M., Hiraoka M., Delpy D., “A finite element approach for modeling photon transport in tissue,” Med. Phys. 20, 299 (1993). 10.1118/1.597069 [DOI] [PubMed] [Google Scholar]
- 37.Ntziachristos V., Tung C.-H., Bremer C., Weissleder R., “Fluorescence molecular tomography resolves protease activity in vivo,” Nat. Med. 8, 757–761 (2002). 10.1038/nm729 [DOI] [PubMed] [Google Scholar]
- 38.Schulz R. B., Ripoll J., Ntziachristos V., “Experimental fluorescence tomography of tissues with noncontact measurements,” IEEE Trans. Med. Imaging 23, 492–500 (2004). 10.1109/TMI.2004.825633 [DOI] [PubMed] [Google Scholar]
- 39.Abdoulaev G. S., Hielscher A. H., “Three-dimensional optical tomography with the equation of radiative transfer,” J. Electron. Imaging 12, 594–601 (2003). 10.1117/1.1587730 [DOI] [Google Scholar]
- 40.Tarvainen T., Vauhkonen M., Kolehmainen V., Kaipio J., “Finite element model for the coupled radiative transfer equation and diffusion approximation,” Int. J. Numerical Methods Engineering 65, 383–405 (2006). 10.1002/nme.1451 [DOI] [Google Scholar]
- 41.Klose A. D., Larsen E. W., “Light transport in biological tissue based on the simplified spherical harmonics equations,” J. Comput. Phys. 220, 441–470 (2006). 10.1016/j.jcp.2006.07.007 [DOI] [Google Scholar]
- 42.Arridge S. R., “Optical tomography in medical imaging,” Inverse Probl. 15, R41 (1999). 10.1088/0266-5611/15/2/022 [DOI] [Google Scholar]
- 43.Welch A. J., Van Gemert M. J., Optical-Thermal Response of Laser-Irradiated Tissue (Springer, 2010). [Google Scholar]
- 44.Pogue B. W., Geimer S., McBride T. O., Jiang S., Österberg U. L., Paulsen K. D., “Three-dimensional simulation of near-infrared diffusion in tissue: boundary condition and geometry analysis for finite-element image reconstruction,” Appl. Opt. 40, 588–600 (2001). 10.1364/AO.40.000588 [DOI] [PubMed] [Google Scholar]
- 45.Schweiger M., Arridge S., Hiraoka M., Delpy D., “The finite element method for the propagation of light in scattering media: boundary and source conditions,” Med. Phys. 22, 1779 (1995). 10.1118/1.597634 [DOI] [PubMed] [Google Scholar]
- 46.Duderstadt J. J., Hamilton L. J., “Nuclear reactor analysis,” (1976).
- 47.Lv Y., Tian J., Cong W., Wang G., Luo J., Yang W., Li H., “A multilevel adaptive finite element algorithm for bioluminescence tomography,” Opt. Express 14, 8211–8223 (2006). 10.1364/OE.14.008211 [DOI] [PubMed] [Google Scholar]
- 48.Han R., Liang J., Qu X., Hou Y., Ren N., Mao J., Tian J., “A source reconstruction algorithm based on adaptive hp-fem for bioluminescence tomography,” Opt. Express 17, 14481–14494 (2009). 10.1364/OE.17.014481 [DOI] [PubMed] [Google Scholar]
- 49.Ahn S., Chaudhari A. J., Darvas F., Bouman C. A., Leahy R. M., “Fast iterative image reconstruction methods for fully 3d multispectral bioluminescence tomography,” Phys. Med. Biol. 53, 3921 (2008). 10.1088/0031-9155/53/14/013 [DOI] [PMC free article] [PubMed] [Google Scholar]
- 50.Wang G., Li Y., Jiang M., “Uniqueness theorems in bioluminescence tomography,” Med. Phys. 31, 2289 (2004). 10.1118/1.1766420 [DOI] [PubMed] [Google Scholar]
- 51.Cong A. X., Wang G., “Multispectral bioluminescence tomography: methodology and simulation,” Int. J. Biomed. Imaging 2006, 57614 (2006). 10.1155/IJBI/2006/57614 [DOI] [PMC free article] [PubMed] [Google Scholar]
- 52.Zhang B., Yang X., Qin C., Liu D., Zhu S., Feng J., Sun L., Liu K., Han D., Ma X., “A trust region method in adaptive finite element framework for bioluminescence tomography,” Opt. Express 18, 6477–6491 (2010). 10.1364/OE.18.006477 [DOI] [PubMed] [Google Scholar]
- 53.Feng J., Qin C., Jia K., Zhu S., Yang X., Tian J., “Bioluminescence tomography imaging in vivo: recent advances,” IEEE J. Sel. Top. Quantum Electron. 18, 1394–1402 (2012). 10.1109/JSTQE.2011.2178234 [DOI] [Google Scholar]
- 54.Arbelaez P., Maire M., Fowlkes C., Malik J., “Contour detection and hierarchical image segmentation,” IEEE Trans. Pattern Analysis and Machine Intelligence 33, 898–916 (2011). 10.1109/TPAMI.2010.161 [DOI] [PubMed] [Google Scholar]
- 55.Ren S., Chen X., Wang H., Qu X., Wang G., Liang J., Tian J., “Molecular optical simulation environment (mose): A platform for the simulation of light propagation in turbid media,” PloS one 8, e61304 (2013). 10.1371/journal.pone.0061304 [DOI] [PMC free article] [PubMed] [Google Scholar]
- 56.Alexandrakis G., Rannou F. R., Chatziioannou A. F., “Tomographic bioluminescence imaging by use of a combined optical-pet (opet) system: a computer simulation feasibility study,” Phys. Med. Biol. 50, 4225 (2005). 10.1088/0031-9155/50/17/021 [DOI] [PMC free article] [PubMed] [Google Scholar]
- 57.Jenkins D. E., Oei Y., Hornig Y. S., Yu S.-F., Dusich J., Purchio T., Contag P. R., “Bioluminescent imaging (bli) to improve and refine traditional murine models of tumor growth and metastasis,” Clin. Exp. Metastasis 20, 733–744 (2003). 10.1023/B:CLIN.0000006815.49932.98 [DOI] [PubMed] [Google Scholar]


