

Abstract
Multiple studies show that people prefer attractive over unattractive faces. But what is an attractive face and why is it preferred? Averageness theory claims that faces are perceived as attractive when their facial configuration approximates the mathematical average facial configuration of the population. Conversely, faces that deviate from this average configuration are perceived as unattractive. The theory predicts that both attractive and mathematically averaged faces should be processed more fluently than unattractive faces, whereas the averaged faces should be processed marginally more fluently than the attractive faces. We compared neurocognitive and behavioral responses to attractive, unattractive, and averaged human faces to test these predictions. We recorded event-related potentials (ERPs) and reaction times (RTs) from 48 adults while they discriminated between human and chimpanzee faces. Participants categorized averaged and high attractive faces as “human” faster than low attractive faces. The posterior N170 (150 – 225 ms) face-evoked ERP component was smaller in response to high attractive and averaged faces versus low attractive faces. Single-trial EEG analysis indicated that this reduced ERP response arose from the engagement of fewer neural resources and not from a change in the temporal consistency of how those resources were engaged. These findings provide novel evidence that faces are perceived as attractive when they approximate a facial configuration close to the population average and suggest that processing fluency underlies preferences for attractive faces.
Keywords: Facial Attractiveness, Averaging, Event-Related Potentials, Visual Cortex
Introduction
It is well established that human adults, children, and even infants judge and behave toward others differently based on facial attractiveness. Unattractive children and adults are judged as less well-adjusted, less socially appealing, and less academically and interpersonally competent than more attractive children and adults (Langlois et al., 2000). Infants approach and interact with attractive strangers, but withdraw from and avoid unattractive strangers (Langlois, Roggman, & Rieser-Danner, 1990). Mothers of attractive infants provide them with more positive attention compared to mothers of unattractive infants (Langlois, Ritter, Casey, & Sawin, 1995). Attractive adults earn higher wages than unattractive adults with the same level of education (Hamermesh, 2011; Judge, Hurst, & Simon, 2009) and are considered to be more intelligent and sociable (Griffin & Langlois, 2006). Thus, given the ubiquitous role that facial attractiveness plays in social and affective interactions, it is important to understand what makes faces attractive and why they are preferred.
Theories of Facial Attractiveness
Two theoretical perspectives have emerged as explanations of facial attractiveness, one based on evolutionary principles and the other based on information processing and cognitive averaging. Most evolutionary theories view preferences for attractive faces as the result of an evolved, domain specific module that identifies—for mate selection purposes—good genes, health, and reproductive fitness. Indicators of health and reproductive fitness are different in men and women but include square jaws (men), high cheekbones (women), big eyes and lips (women), and symmetry (both) among others (Fink & Penton-Voak, 2002; Perrett et al., 1998; Rhodes, 2006; Rhodes, Proffitt, Grady, & Sumich, 1998; Thornhill & Gangestad, 1993; 1999; but see Kalick, Zebrowitz, Langlois, & Johnson, 1998). A major argument against these particular evolutionary accounts is that although health and reproductive fitness indicators may enhance attractiveness, these characteristics are neither necessary nor sufficient to produce it. Many perfectly symmetrical faces are not attractive, many youthful faces are not attractive, many faces with big lips are not attractive, and many highly masculine faces are not attractive (Langlois, Roggman, & Musselman, 1994; Rubenstein, Langlois, & Roggman, 2002).
In contrast, theoretical perspectives based on cognitive averaging (collectively termed here as averageness theory) view preferences for attractive faces as resulting from their similarity to facial prototypes, categorical central tendencies of a population of faces (Langlois & Roggman, 1990). In this account, facial attractiveness is driven by a face’s averageness or degree to which its configuration approximates the mathematical average facial configuration of a population of male or female faces. Multiple studies have shown that adult humans perceive faces possessing high averageness as highly attractive, whereas faces with low averageness (i.e. faces that deviate from the average facial configuration of a population) are perceived as unattractive (Bronstad, Langlois, & Russell, 2008; Langlois & Roggman, 1990; Langlois, Roggman, Casey, & Ritter, 1987; Langlois et al., 1994; Rhodes & Tremewan, 1996; Rubenstein, Kalakanis, & Langlois, 1999). This preference for average faces is shared across cultures (Apicella, Little, & Marlowe, 2007). These studies suggest that the averageness of a face is both necessary and sufficient in determining facial attractiveness (Langlois et al., 1994; Rubenstein et al., 2002). Preferences for faces near their prototype arise because, in general, prototypical stimuli are processed more rapidly and efficiently than other stimuli (Komatsu, 1992; Posner & Keele, 1970; Reed, 1972; Rosch, Mervis, Gray, Johnson, & Boyes-Braem, 1976). Such fluent stimulus processing is associated with positive affective responses that render prototypical stimuli more visually “pleasing” than non-prototypical stimuli (Harmon-Jones & Allen, 2001; Principe & Langlois, 2011, 2012; Winkielman & Cacioppo, 2001; Winkielman, Halberstadt, Fazendeiro, & Catty, 2006). This is presumably because fluent processing is typically error-free and indicates successful recognition of a stimulus (Winkielman et al., 2006).
The Present Study
The purpose of the present study was to examine the predictions of averageness theory for the neural processing of facial attractiveness, as to our knowledge such an examination has not yet been performed. Our objective was not to devise a single experiment that could decide between averageness and evolutionary theory, but instead provide evidence to either support or falsify the neural processing predictions of the former. To accomplish this, we compared neurocognitive responses to averaged faces (prototypes) and to individual faces varying in attractiveness. We recorded event-related potential (ERP) measures of stimulus-evoked electroencephalographic (EEG) activity at the scalp while adults categorized images of faces as human or chimpanzee, a task that engaged automatic, stimulus-driven processing related to the attractiveness of the human faces. There were three kinds of human faces: high attractive, low attractive, and averaged faces consisting of mathematical composites of 32 individual faces varying along a wide range of attractiveness. The averaged faces were used as estimates of the mean of the face population from which they were sampled (see Methods – Stimuli & Procedure section, below) and are highly attractive, not average, in appearance (see Results – Behavior section, below, and Supplementary Materials).
We tested two predictions of averageness theory in this study. First, attractive faces should be perceived as more typical and less distinctive than unattractive faces, as the former are more similar to the prototype whereas the latter are more distinguishable from the prototype. This prediction had been supported by studies that found attractiveness to be negatively correlated with distinctiveness (Light, Hollander, & Kayra-Stuart, 1981; Peskin & Newell, 2004; Rhodes & Tremewan, 1996; Vokey & Read, 1992). Here we expected that both averaged and attractive faces would be rated as less distinctive than low attractive faces. However, we also expected that averaged faces would be rated as less distinctive than high attractive faces because the former are closer to the face prototype than the latter. Second, attractive faces should be processed more fluently than unattractive faces because of their similarity to the facial prototype. Consistent with this prediction, Hoss, Ramsey, Griffin, & Langlois (2005) found in a reaction time study that attractiveness facilitates the speed and accuracy of gender-based face classification (but see Schacht, Werheid, & Sommer, 2008). In the present study, we hypothesized that participants would categorize high attractive and averaged faces as “human” faster than low attractive faces and would categorize the averaged faces marginally faster than the high attractive faces.
We also measured processing fluency via the well-known ERP index of face processing, the N170 component1. The N170 is a negative-polarity ERP component observed over bilateral occipital temporal scalp regions approximately 170 ms post-stimulus onset. The N170 response is larger for faces versus non-face objects (Bentin, Allison, Puce, Perez, & McCarthy, 1996; Rossion & Jacques, 2011), although in general this component is sensitive to entry-level object categorization, of which face perception is a privileged case (Rossion, Curran, & Gauthier, 2002). The N170 has a magentoencephalographic (MEG) counterpart, the M170, which has a similar time course and response properties (Deffke et al., 2007; Halgren, Raji, Marinkovic, Jousmäki, & Hari, 2000; Linkenkaer-Hansen et al., 1998). Although the N170/M170 complex arises from activity in multiple cortical regions (including occipitemporal sulcus, posterior superior temporal sulcus, posterior lingual gyrus, and the fusiform gyrus), it appears that the dominant sources are in the lateral posterior fusiform gyrus and anterior/middle fusiform gyrus (for full review, see Rossion & Jacques, 2011). These latter regions respectively correspond to the occipital and fusiform face areas as identified by functional magnetic resonance imaging (fMRI) studies (Haxby, Hoffman, & Gobbini, 2000; Kanwisher, McDermott, & Chun, 1997).
Importantly, the N170 is increased and often delayed in response to inverted versus upright photorealistic faces (Bentin et al., 1996; Itier & Taylor, 2002; Itier & Taylor, 2004a, 2004b; Jacques & Rossion, 2007; Rossion et al., 1999; Rossion & Jacques, 2011; Rossion, Joyce, Cottrell, & Tarr, 2003; Vizioli, Foreman, Rousselet, & Caldara, 2010). These N170 face inversion effects have been attributed to the disruption of configural face processing (Rossion et al., 1999; Rossion & Gauthier, 2002) because face recognition is disproportionately affected by inversion as compared to other objects (Yin, 1969). Thus the N170 ERP response provides a sensitive metric to investigate fluent versus non-fluent face processing. With respect to attractiveness, Halit et al. (2000) observed atypical unattractive faces to elicit a larger N170 ERP response than typical attractive faces (when typicality varies across, but not within, facial identity). Halit et al. suggested that their N170 effects “may reflect processing related to perceiving an individual in relation to a general face prototype” (p. 1874), consistent with the interpretation that the N170 responses observed in their study arise from the more fluent processing of the attractive versus unattractive faces. Nonetheless, their finding cannot be taken as a confirmation of cognitive averaging theory because they did not include averaged faces in their stimulus set or obtain behavioral measures that could index fluency of processing; hence one motivation for the present study. Based on the predictions of averageness theory and previous observations of the N170, we hypothesized that low attractive faces would elicit larger N170 amplitudes and/or more delayed latencies than high attractive and averaged faces, whereas high attractive faces would elicit larger N170 amplitudes and/or more delayed latencies than averaged faces.
The above reviewed N170 findings are consistent with other evidence that fluent stimulus processing is associated with a reduction of neural activity in the brain. For example, face-selective neurons in monkey inferotemporal cortex exhibit monotonic decreases in firing rates as face stimuli transition from non-prototypical individual faces toward the average of the faces (Leopold, Bondar, & Giese, 2006). Hemodynamic activity in human fusiform gyrus and occipital cortex is smaller for prototypical than for nonprototypical faces and visual dot patterns, respectively (Loffler, Yourganov, Wilkinson, & Wilson, 2005; Reber, Stark, & Squire, 1998). Nonetheless, it is not yet clear why prototypical stimuli are processed fluently. Prototypical stimuli may require fewer neural resources to process, and thus recruit a lesser number of neurons and/or activate neurons to a lesser degree, than non-prototypical stimuli. Then again, prototypical stimuli may engage neural resources with a rapid and consistent time course, while other stimuli engage the same neural responses more slowly and/or with a more variable time course. A third possibility is that processing fluency affects both the degree and timing of neural response. Hence distinguishing among these alternatives was an additional goal of the present study. We utilized a simple single-trial peak detection procedure (Spencer, 2005; Spencer, Abad, & Donchin, 2000) that allowed separate measurement of amplitude and timing changes across conditions (see Methods – ERP Quantification section, below).
Methods
Participants
Fifty-five undergraduates participated for course credit or payment. We excluded seven participants due to excessive EEG artifacts or technical recording problems (see EEG Acquisition, Preprocessing, & Data Reduction section, below). Thus the final sample consisted of 48 undergraduates (30 female, 18 male; 18.60 ± .17 years of age, 44 right-handed); this number of participants was chosen a priori to provide balanced assignment of stimuli to each condition as necessitated by our experimental design (see Stimuli & Procedure section, below). All participants were fully informed of the experimental methods and proceedings before consent. The Institutional Review Board for Human Studies at the University of Texas at Austin approved this study.
Stimuli & Procedure
Participants viewed color images of high attractive, low attractive, and averaged young adult Caucasian female faces in the context of a species categorization task described below. (We included only female faces in this study because adult observers of both sexes more consistently agree on the attractiveness of female faces than the attractiveness of male faces, e.g. Hoss et al., 2005; Rennels, Bronstad, & Langlois, 2008.) We constructed the averaged faces by mathematically averaging 32 individual faces (Langlois & Roggman, 1990; Langlois et al., 1994). A constant size oval occluding window, applied to each photograph, excluded background and hair. All faces were presented against a uniform white background. Importantly, low- and high-level visual properties that might differentially affect behavioral and/or ERP responses were equated across human face categories (see Supplemental Material for description). Another group of participants (N = 55; see Supplemental Material for ratings procedure) determined the a priori attractiveness of each face. Participants rated the faces along a 7-point attractiveness scale, with high attractive and averaged faces rated near the high end of the scale (mean ratings of 5.15 ± 0.15 and 5.60 ± 0.12, respectively) and the low attractive faces rated near the low end of the scale (mean rating = 2.06 ± 0.09).
One notable feature of averaged faces is that different averaged faces constructed from different face sets are highly perceptually similar (see Figure 1). This poses a problem when presenting averaged faces in the context of experimental designs that present exemplars of each face/stimulus category. The presentation of perceptually similar averaged faces are likely perceived as multiple instances of the same averaged face and, therefore, could induce differential repetition effects between averaged faces and other face categories even though all faces are presented equally often. To avoid this confound, we implemented a design that ensured that all individual human faces and general human face categories (attractive, unattractive) would be repeated, and perceived to be repeated, equally often. We created three groups of faces on the basis of the a priori attractiveness ratings – one group of high attractive individual faces (two faces), one group of low attractive individual faces (four faces), and one group of averaged faces (2 faces). These faces were rated as the most highly attractive or unattractive in their category. Each participant repeatedly viewed one face each from the high attractive and averaged face groups and two faces from the low attractive face group (4 faces total). Selection of faces from the face category groups was balanced across participants and categories; each participant received 1 of 48 possible unique across-category combinations of faces. Block analyses showed that potential differential habituation effects due to the numerous repetitions of each face were negligible (see the ERP Quantification section in the Method and the Behavior section in the Results, below).
Figure 1.
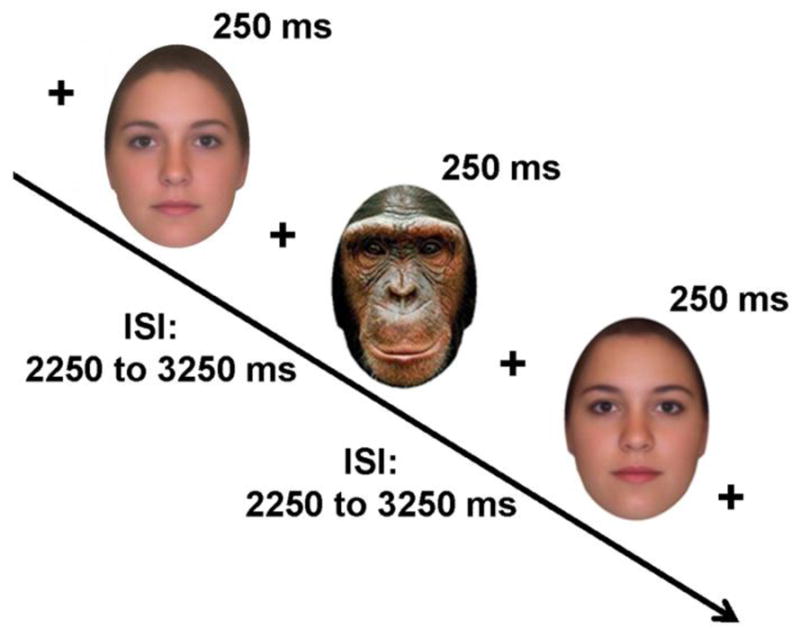
Basic task design. On all trials, participants viewed a central fixation cross before a face was presented for 250 ms. ISIs ranged from 2250 ms – 3250 ms, with the central fixation cross displayed throughout. Participants categorized the faces via a button press as human or chimpanzee. The figure shows the two averaged face exemplars used in this study; note the high perceptual similarity between the two averaged faces (see Methods – Stimuli & Procedure section).
Participants also viewed a set of 10 color images of chimpanzee faces that were the same size as the human faces, with external background, hair, and head features excluded in the same manner (Figure 1). Participants individually categorized each face as a human or chimpanzee as quickly and as accurately as possible. This cover task served two purposes: first, it ensured that participants attended to the faces; second, it encouraged participants to appraise the human faces in a manner that did not directly involve facial attractiveness. An important aspect of our design was that ERP responses to the three categories of human faces would be assessed under conditions in which they received the same classification response, thus ensuring that any observed ERP differences were not due to differences in conscious stimulus categorization. Hence, the primary comparisons of interest in this paper involve comparisons among the human faces. Nonetheless, we also report behavioral and ERP responses to the chimpanzee faces for comparison with the responses to the human faces, as well as to ascertain that participants performed the species categorization task satisfactorily (see the Behavior section in the Results, below).
Participants viewed the randomly intermixed human and chimpanzee faces over 12 trial blocks, with 50 face presentations per block (10 high attractive, 10 averaged, 20 low attractive, 10 chimpanzee); see Figure 1. We presented the faces for 250 ms centered on a 17″ computer LCD screen. All faces were displayed against a white background and subtended ~ 7.52° (w) × 11.31° (h) of visual angle at a viewing distance of 75 cm; a small cross was presented at central fixation during all interstimulus intervals (ISIs). For each face, participants indicated a human versus chimpanzee categorization by using their dominant hand to press one of two buttons on a response box placed in front of them on a table (left button = human; right button = chimpanzee). ISIs ranged from 2,250 ms – 3,250 ms; participants had 1,500 ms to respond on each trial.
After the categorization task, participants rated the human faces for facial attractiveness and distinctiveness (see Supplementary Materials for ratings methods description). Facial distinctiveness was defined as the ease of spotting a face in a crowd (Wickham & Morris, 2003).
Behavioral Data Reduction & Analysis
Based on the known limits of human visual processing speed and recommended methods for dealing with RT outliers (Fabre-Thorpe, Delorme, Marlot, & Thorpe, 2001; Ratcliff, 1993), we restricted the categorization task analysis to correct trials with response times (RTs) > 200 ms and < 2.5 standard deviations of the grand mean across conditions To remove false starts and extreme outliers, 2.48% ± 0.12% of all trials were rejected due to RTs outside the specified limits. Next, the twelve experimental blocks of behavioral data were separated into four groups of 3 blocks for each condition (i.e. block group #1 = trial blocks 1–3; block group #2 = trial blocks 4–6, etc.). We computed mean categorization task response times (RTs) and accuracy-hit rates (defined as the percentage of correct trials within the total number of trials after removal of timeout trials) for each block group, face category, and participant. Separation of data into block groups was performed to reduce data variability and simplify data interpretation and analysis. Because there were twice as many low attractive trials as high attractive and averaged trials, we computed each individual’s behavioral measures for the low attractive condition from a random sampling (without replacement) of their low attractive trials. This sampling was constrained such that 1) the number of sampled trials for a given block group was equivalent to the average number of correct high attractive and averaged face trials for that group, and 2) the sampled trials contained approximately equal contributions from the two sets of low attractive face exemplar trials. In addition, we computed mean attractiveness and distinctiveness ratings from the human face ratings data (low attractive face ratings were averaged across all of the faces in this category).
We used the SPSS statistical software package (IBM Corporation, Armonk, NY, USA) to compare among responses to the human and chimpanzee faces via two-way repeated measures ANOVAs with factors of block group and face type (high attractive, averaged, low attractive, chimpanzee). We also analyzed mean attractiveness and distinctiveness ratings of the human faces via one-way repeated measures ANOVA. To account for sphericity violations when factors involved more than two levels, the p values of all ANOVAs were adjusted using the Greenhouse–Geisser correction (Greenhouse & Geisser, 1959). For ease of interpretation, reports of all significant F-tests subject to Greenhouse–Geisser correction include uncorrected degrees of freedom, corrected p-values, and the Greenhouse–Geisser epsilon value ε. In addition, p-values for all reported post-hoc comparisons and auxiliary ANOVAs used to decompose significant interactions were corrected for multiple comparisons using the Holm-Bonferroni procedure (Holm, 1979), which controls the familywise error rate at level α (here, α = 0.05). Effect sizes were estimated via the partial eta-squared (η2p) measure.
We also examined the predictive relationship between distinctiveness and attractiveness ratings of the human faces via generalized estimating equations using SPSS (Gardiner, Luo, & Roman, 2009; Ghisletta & Spini, 2004; normal distribution with identity link, robust covariance estimate, exchangable working correlation matrix, maximum likelihood-estimate scale parameter), a generalized regression procedure that accounts for correlations across repeated measures.
EEG Acquisition, Preprocessing, & Data Reduction
Participants wore a 32-channel Geodesics Sensor Net (Electrical Geodesics Inc., Eugene, OR, USA), which included channels placed at the inferior orbits and outer canthi of each eye; see Figure 2. Impedances were adjusted to below 50 kΩ, following standard recommendations for the EGI system. We recorded continuous EEG (250 Hz sampling rate) via NetStation 4.4 software (Electrical Geodesics Inc.) with respect to a CZ reference. We extracted 2,000 ms EEG data epochs from −750 ms to 1,250 ms with respect to the onset of the human face stimuli that were imported into the MATLAB computing environment (MathWorks, Natick, MA, USA).
Figure 2.

(A) N170 peak and (B) N170 difference wave scalp topographies for all four face conditions. Different colors indicate positive or negative values; times indicate peak latencies or difference wave averaging intervals. Head maps are individually scaled to clearly show individual between-condition differences. (C) Representative non-latency-jitter-corrected grand-average event-related potentials (ERPs) in response to high attractive (solid black lines), averaged (dashed black lines), and low attractive (red lines) human faces, and chimpanzee faces (dashed red lines). The representative ERP waveforms are collapsed across posterior left lateral (left column) and right lateral (right column) extended 10–20 scalp EEG recording locations, indicated by black dots on the peak and difference wave scalp maps (see the EEG Acquisition, Preprocessing, & Data Reduction section; recording sites shown outside the radius of the head represent locations that are below the equatorial FPZ–T7–T8–OZ plane of the assumed spherical head model). Negative polarity is oriented upward.
We performed all subsequent analyses in MATLAB via in-house scripts that utilized functions from the EEGLAB toolbox (Delorme & Makeig, 2004). First, the epoched EEG data were transformed to an average reference2. Next, we excluded incorrect trials and trials with RTs < 200 or > 2.5 standard deviations from the grand mean across conditions from further analysis; on average, 3.20 % ± 0.19 % and 2.03 % ± 0.28 % of the human face category and chimpanzee face category EEG trials, respectively, were rejected for these reasons. We also removed trials contaminated with muscle and EEG signal artifacts via visual inspection. Bad EEG channels were replaced using an EEGLAB-based spherical spline interpolation algorithm (Perrin, Perrier, Bertrand, Giard, & Echallier, 1987; mean number of interpolated channels = .48 ± .12). We removed electrooculargraphic (EOG) artifacts due to blinks and saccades via a two-stage procedure (Trujillo, Kornguth, & Schnyer, 2009) that simultaneously minimizes data loss and the physical and neural impact of ocular activity on the EEG signals. In the first stage, we rejected trials contaminated with EOG activity in the −200 ms to 300 ms interval with respect to face onset based on activity present in two bipolar montage channels computed offline (vertical EOG; FP2 – right inferior orbit; horizontal EOG: F9 – F10; rejection criteria: +/− 40 μV). In the second stage, we corrected the scalp EEG signals for residual EOG activity outside the rejection interval by application of an adaptive filter regression-based ocular correction algorithm (He, Wilson, & Russell, 2004) to the entirety of each EEG epoch using the Automatic Artifact Removal v1.3 add-on for the EEGLAB toolbox. Because ocular artifact correction algorithms occasionally fail to remove all EOG artifacts on some trials, a second round of manual artifact scoring was performed after band-pass filtering the EEG data between .1 Hz and 48 Hz (166 point zero phase shift FIR filter with .03 Hz and 7 HZ transition bands, respectively). On average, 15.11 % ± 1.15 % and 25.66 % ± 1.64 % of the human face category and chimpanzee face category EEG trials, respectively, were rejected due to muscle, signal, and/or ocular artifacts.
After artifact removal, the band-pass filtered EEG trials were truncated to the −200 ms to 400 ms interval to remove artifactual filter-related edge effects. EEG trials were then baseline-corrected to the −200 ms to 0 ms pre-stimulus interval and divided into the three human face categories (high attractive, averaged, low attractive); the average number of trials per human face category was 98.02 ± .87 (after collapsing across all experimental blocks; see below).
ERP Quantification
We visually estimated the general time window and scalp location of the N170 (150 – 225 ms) ERP components from the across-participant grand-average ERPs. We quantified N170 component amplitudes at six temporal-occipital scalp sites (P7, P8, PO9, PO10, M1, M2) where N170 effects are typically maximal (Bentin et al., 1996; Rossion et al., 1999), as was the case in the present grand-average ERPs (see Figure 2). To simplify data interpretation, ERP waveforms at left and right hemisphere locations were averaged together separately to form two regional waveforms. N170 latency was defined as the latency of the most negative peak within the general N170 time window. N170 amplitude was quantified as the mean activity within the time window defined by those points in the immediate leading and lagging edge of the N170 peak where the ERP amplitude was 75% of the peak amplitude (Picton et al., 2000). We analyzed ERP component amplitudes and latencies via two-way repeated measures univariate ANOVAs with factors of face type and hemisphere, after collapsing across experimental blocks3. P-values were adjusted using the Greenhouse–Geisser correction for nonsphericity, post-hoc comparisons and auxiliary ANOVAs were corrected for multiple comparisons via the Holm-Bonferroni procedure, and effect sizes were estimated via the partial eta-squared measure (see Behavioral Data Reduction & Analysis section, above).
For graphical display, we generated grand-average ERP waveforms by averaging ERPs at a given electrode across participants separately for each condition. We visualized the scalp distribution of ERP component differences by computing between-condition amplitude differences for a component at each electrode that were displayed as interpolated topographical scalp maps using algorithms from the EEGLAB MATLAB toolbox.
N170 latency jitter correction (LJC) analysis
To determine the contribution of amplitude and/or timing changes to attractiveness-related N170 effects across the human face conditions, we identified the N170 latency on each trial and corrected the ERPs for any latency jitter that was present. By comparing N170 amplitudes after latency jitter correction (LJC), as well as the standard deviation of single-trial peak latencies for each condition, we could ascertain whether our effects involved changes in ERP amplitude, timing, or both. To this end, we adapted a peak-picking latency jitter correction technique previously utilized to estimate P300 latency (Spencer et al., 2000). This computationally simple technique matches the performance of more sophisticated latency estimation measures when signal-to-noise ratios are high and/or the width of the true ERP component is relatively narrow (Gratton, Kramer, Coles, & Donchin, 1989; Jáskowski & Verleger, 2000; Smulders, Kenemans, & Kok, 1994). This method was well suited to our data, given the relatively clean ERP baselines of our data (see Results – Event-Related Potentials section) and the high numbers of trials entering into each ERP. A limitation of our procedure is that it cannot distinguish between changes in the across-trial variability of ERP peak latencies versus changes in the rate at which ongoing pre-stimulus EEG oscillations are realigned following stimulation onset, a process known as phase-resetting (Gruber, Klimesch, Sauseng, & Doppelmayr, 2005; Klimesch et al., 2004; Makeig et al., 2002; Trujillo & Allen, 2007). However, this limitation does not impede our present goal of ascertaining whether EEG timing changes contribute to N170 effects of facial attractiveness by either timing mechanism.
For each individual participant and condition, we first identified the latency of the positive-polarity P1 and P2 ERP components that respectively preceded and followed the N170 in their averaged left and right hemisphere regional ERP waveforms; P1 and P2 latencies were defined as the time points of the most positive values of the noncorrected waveform in the 75 – 150 ms and 175 – 275 ms time windows, respectively. We next searched for the largest negative peak between the P1 and P2 latencies for each trial at these sites, with the latency of this negative peak taken as the N170 latency for a given trial. On average, the LJC procedure produced mean latency shifts of 21 ms ± 17 ms per condition per electrode, with latency shifts ranging from 0 ms to ± 76 ms. To determine that this peak-picking technique was detecting true single-trial N170 responses rather than noise, we applied a chi-squared test for goodness of fit, testing the observed single-trial latency distribution against the null hypothesis of a uniform distribution (Spencer et al., 2000). If the peak-picking technique detected random noise then we would expect that the distribution of single-trial negative peak latencies would be uniformly distributed across the P1 to P2 component interval. However, if the peak-picking technique reliably detected true single-trial N170 response, then the latencies of these responses should be clustered around a mean latency and their distribution should deviate from uniformity. The chi-squared tests were significant for each participant, condition and electrode of interest (all ps < .05 after correction for multiple comparisons across electrodes via the Holm-Bonferroni procedure). Hence we concluded that the peak-picking technique was successfully detecting single-trial N170 responses and not noise.
After identifying the single-trial N170 latencies, we computed latency jitter-corrected (LJC) waveforms at electrode sites of interest by shifting the N170 peak on each trial in time so that epochs were aligned to the mean single-trial N170 latency. We then quantified mean amplitudes of the LJC N170 responses in the same manner as amplitudes of the non-LJC ERPs. In addition, we used the standard deviation of the single-trial N170 latencies as a measure of latency jitter for each participant, condition, and electrode of interest. We analyzed mean LJC N170 amplitude, single-trial latency, and latency standard deviation via univariate ANOVAs, with all tests corrected for nonsphericity and for multiple comparisons.
RT/N170/Face Rating Regression Analysis
We examined the general within-condition predictive relationship between processing fluency and the N170 response by regressing RTs against N170 amplitude across participants after collapsing across human face conditions; a separate analysis of chimpanzee responses was also performed. We also examined the across-condition predictive relationship between the N170 and RT by first arranging the data according to the theoretically predicted monotonic N170 amplitude increase and RT decrease over averaged to high attractive to low attractive face conditions and then computing the slopes of across-condition changes for each variable separately for each participant. We used linear regression to predict the slopes of across-condition changes for the N170 from the corresponding slopes for the RTs. Finally, we examined the relative within- and across-condition contributions of processing fluency, attractiveness, and distinctiveness to the N170 response by multiply regressing N170 amplitude against RT and the attractiveness/distinctiveness ratings of the human faces viewed during the categorization task.
These analyses were carried out via reweighted least trimmed squares linear regression (Rousseeuw & Leroy, 2003), a robust statistical procedure that is not unduly affected by outliers and violations of model assumptions. Least trimmed squares regression finds the subset k of n data points with the minimal sum of squared residuals. Here, k was determined a priori according to a 95% confidence interval global exclusion threshold for outliers. On average, 6.6 ±.4% of data points were excluded from the final across- and within-participant tests relating RT to N170 amplitude, whereas 7.3 ±.4% of data points were excluded from the tests relating N170 amplitude to the attractiveness/distinctiveness ratings and RTs. We implemented the regressions via the Forward Search Data Analysis toolbox for Matlab (Riani, Perrotta, & Torti, 2012) and applied them to the mean RTs and mean latency jitter-corrected and noncorrected N170 amplitudes computed from the correct trials entering into the ERP averages after artifact-rejection. Left and right hemisphere N170 responses were analyzed separately, with the p-values of all regressions corrected for multiple comparisons. We report standardized regression coefficients (β) to facilitate comparison among the predictive conditions.
Results
Behavior
Accuracy
A two-way ANOVA of human versus chimpanzee categorization hit rates yielded a main effect of block group F(3, 141) = 8.32, p <.001, ε = .77, η2p = .15, a main effect of face type, F(3, 141) = 58.96, p < .001, ε = .35, η2p = .56, and a Block Group x Face Type interaction F(9, 423) = 6.96, p < .001, ε = .40, η2p = .13. Overall, participants classified the human faces more accurately than the chimpanzee faces overall (high attractive: 99.2 ± .2%; low attractive: 99.3 ± .1%; averaged: 99.2 ± .2%; chimpanzee: 88.9 ± 1.4%); there were no accuracy difference among the human faces, ps > .984. However, accuracy in classifying chimpanzee faces decreased across block group (block group 1: 91.4 ± 1.3%, block group 4: 86.3 ± 1.9%; F(3,141) = 8.95, p < .001, ε = .78, η2p = .16, post-hoc p < .006), while remaining constant for the human faces, ps > .296.
Reaction Time
A two-way ANOVA of human versus chimpanzee categorization RTs yielded a main effect of block group, F(3, 141) = 15.52, p <.001, ε = .72, η2p = .25, a main effect of face type, F(3, 141) = 213.18, p < .001, ε = .41, η2p = .82, and a Block Group x Face Type interaction, F(9, 423) = 3.71, p < .001, ε = .86, η2p = .07. Overall, participants were faster in classifying human than chimpanzee faces (high attractive: 383 ± 9 ms; low attractive: 388 ± 9 ms; averaged: 384 ± 9 ms; chimpanzee: 450 ± 9 ms). Importantly, participants categorized the high attractive and averaged faces more rapidly than the low attractive faces, post-hoc ps < 0.009. Furthermore, RTs to categorize human faces significantly decreased over block group (block group 1: 401 ± 10 ms, block group 4: 370 ± 9 ms, RT values collapsed across human face categories; F(3,141) = 19.45, p < 0.001, ε = .71, η2p = .29, post-hoc p < .006), a decrease in RTs to classify the chimpanzee faces only approached significance, F(3,141) = 2.83, p < .053, ε = .81, η2p = .06.
Attractiveness and Distinctiveness Ratings
Attractiveness
One-way ANOVA of the human face attractiveness ratings gathered after the species categorization task revealed a significant main effect of face type, F(2, 94) = 336.42, p < .001, ε = .98, η2p = .88). Participants rated the high attractive faces (5.17 ± 0.12) and averaged faces (5.70 ± 0.15) as more attractive than the low attractive faces (2.02 ± .09; post-hoc ps < .003). In addition, the averaged faces were rated as more attractive than the high attractive faces (post-hoc p < .003). These findings replicate previous observations that averaged faces are judged to be highly attractive (Bronstad et al., 2008; Langlois & Roggman, 1990).
Distinctiveness
One-way ANOVA of the distinctiveness ratings revealed a significant main effect of distinctiveness, F(2, 94) = 16.27, p < .001, ε = .95, η2p = .26. The averaged faces (3.52 ± 0.16) were rated as less distinctive than either the high attractive (4.27 ± 0.17) or low attractive (4.84 ± 0.18) faces (post-hoc ps < 0.009). The high attractive faces were rated as less distinctive than the low attractive faces, post-hoc p < 0.025.
Predictive Relationship Between Attractiveness and Distinctiveness Ratings
The generalized estimating equation-based regression showed that that the attractiveness ratings were significantly associated with the distinctiveness ratings, B = −.23, Wald χ2 (1, N = 48) = 16.01, p < .001. In general, the more attractive the faces were rated, the less distinctive they were rated.
Event Related Potentials
Figure 2 shows the grand average ERP scalp topographies (panel A), difference topographies (panel B), and representative waveforms for each condition over the left and right hemispheres (panel C). The N170 showed the typical lateral occipitotemporal distribution of this component, as well as a positive counterfield over the scalp vertex called the vertex positive potential (Jeffreys, 1989, 1996) which reflects volume conduction of electric signals emanating from the same neural generators of the N170 (Joyce & Rossion, 2005). The N170 differences were mostly restricted to the lateral scalp areas except for the contrasts between the chimpanzee and human faces, which also showed vertex positive potential differences over the medial central posterior scalp (these differences were not assessed).
Non-LJC Analysis
ANOVA of the noncorrected N170 amplitude yielded a significant main effect of face type, F(3,141) = 37.88, p < .001, ε = .74, η2p = .45. The main effect of hemisphere was marginally significant, F(1,47) = 3.96, p < .052, ε = 1.00, η2p = .08, but the Face Type x Hemisphere interaction was not significant, F(3,141) = 1.33, p < .269, ε = .70, η2p = .03. Follow-up analysis of the face type main effect showed that the N170 was significantly larger for the low attractive human faces (−3.29 ±.25 μV) versus the high attractive (−3.07 ±.25 μV) and averaged human faces (−3.08 ±.24 μV), post-hoc ps < .048, but the latter two face categories did not differ from one another, post-hoc ps < .909. In addition, the N170 response to chimpanzee faces (−4.18 ±.28 μV) was significantly larger than all the human faces, post-hoc ps <.006.
Analysis of N170 latency yielded a significant main effect of face type, F(3,141) = 44.75, p < .001, ε = .80, η2p = .49, which indicated that N170 responses were delayed for chimpanzee faces (179 ± 1 ms) versus the human faces (high attractive: 170 ± 1 ms; averaged: 171 ± 2 ms; low attractive: 171 ± 2 ms; post-hoc ps < .006). There were no N170 latency differences among the human faces, post-hoc ps > .406. In addition, a main effect of hemisphere, F(1,47) = 4.91, p < .032, ε = 1.00, η2p = .10, indicated that overall N170 responses were delayed over the left (174 ± 2 ms) versus the right hemisphere (171 ± 1 ms).
LJC Analysis
The analysis of the N170 amplitude after latency jitter correction yielded similar effects as the non-corrected analysis. A main effect of face type was significant, F(3,141) = 49.24, p < .001, ε = .55, η2p = .51, but the main effect of hemisphere, F(1,47) = 2.23, p < .142, ε = 1.00, η2p = .05, and the Face Type x Electrode Location interaction, F(3,141) = .24, p < .802, ε = .71, η2p = .01, were not. Follow-up analysis of the face type main effect showed that the LJC N170 was significantly larger for the low attractive human faces (−8.05 ±.29 μV) versus the high attractive (−7.70 ±.27 μV) and averaged human faces (−7.84 ±.27 μV), post-hoc ps < .015, but the latter two face categories did not differ from one another, post-hoc ps < .114. In addition, the LJC N170 response to chimpanzee faces (−9.18 ±.34 μV) was significantly larger than all the human faces, post-hoc ps <.006.
The ANOVA of single-trial latency jitter yielded a main effect of face type, F(3,141) = 6.39, p < .001, ε = .85, η2p = .12, which indicated that LJC N170 latencies were more variable for chimpanzee (28 ± 1 ms) versus the human faces (high attractive: 24 ± 1 ms; averaged: 25 ± 1 ms; low attractive: 25 ± 1 ms; post-hoc ps < .048). There were no latency jitter differences among the human faces, post-hoc ps > .802.
RT/N170 Regression Analysis
In general, larger N170 responses were associated with slower RTs within conditions. This was the case for the noncorrected N170 over the left scalp hemisphere within the collapsed human face condition (βleft = −.34 ± .14, t(45) = −2.39, p < .042) and over both hemispheres within the chimpanzee face condition (βleft = −.20 ± .07, t(42) = −2.83, p < .014; βright = −.14 ± .06 ms/μV, t(44) = −2.11, p < .041). After N170 latency jitter correction, these within-condition N170/RT relationships were only significant at left hemisphere sites within both conditions (human faces: βleft = −.40 ± .14, t(45) = −2.86, p < .013; chimpanzee faces: βleft = −.33 ± .14, t(45) = −2.36, p < .046). Furthermore, increases in N170 amplitude (negative slopes) across the human face conditions (averaged to high attractive to low attractive) were significantly associated with RT increases (positive slopes) across these conditions. This was the case for both the noncorrected and corrected N170 at left and right hemisphere scalp locations (noncorrected: βleft = −.49 ± .13, t(44) = −3.73, p < .001; βright = −.33 ± .15, t(44) = −2.24, p < .03; corrected: βleft = −.44 ± .14, t(44) = −3.17, p < .006; βright = −.34 ± .15, t(43) = −2.29, p < .027).
N170/RT/Human Face Ratings Multiple Regression Analysis
Across experimental conditions, RTs were significantly associated with left hemisphere N170 amplitude within the context of the additional predictors of attractiveness and distinctiveness ratings of the human faces; this was the case both before and after latency jitter correction of the N170 (noncorrected: βleft = −.52 ± .13, t(42) = −3.97, p < .002; corrected: βleft = −.42 ± .12, t(43) = −3.39, p < .01). Furthermore, decreases in ratings of attractiveness across the human face conditions (negative slopes) were significantly associated with left hemisphere N170 amplitude increases (negative slopes), but only after N170 latency jitter correction (βleft = .45 ± .13, t(43) = 3.54, p < .006). In contrast, the distinctiveness ratings were not significantly associated with N170 amplitude across conditions either before or after latency jitter correction (ps = 1). We ascertained whether the attractiveness ratings and/or the RTs were associated with the N170 response across conditions beyond the contribution of the other variable (plus distinctiveness held constant). We achieved this via use of the standard R2 change statistic applied to the regression outcome for the left hemisphere latency jitter-corrected N170 amplitudes. We found that attractiveness and RT were both associated with N170 amplitude beyond the contribution of the other variable to a roughly equal degree (attractiveness: R2 change = .25, F(1,41) = 16.98, p < .001; RT: R2change = .20, F(1, 41) = 13.52, p < .001). Finally, none of the three variables were significantly associated with N170 amplitude within conditions (ps < 0.32).
Discussion
The present study provided a test of the averageness theory of facial attractiveness by comparing behavioral and ERP responses to high attractive, averaged, and low attractive faces presented in the context of a simple species face categorization task. To our knowledge, this is the first study to directly compare neurobehavioral responses among facial prototypes and individual faces varying in attractiveness.
Attractive and Averaged Faces are More Prototypical Than Unattractive Faces
Our first finding demonstrated an inverse relationship between the attractiveness and distinctiveness of our face stimuli. Averageness theory predicts that attractive faces similar to the prototype should be perceived as more typical and less distinctive than unattractive faces that differ from the prototype. Consistent with this prediction, participants rated high attractive and averaged faces as more attractive and less distinctive than the low attractive faces. In addition, they rated the averaged faces as more attractive and less distinctive than the high attractive faces, consistent with the expectation that averaged faces should be even more prototypical than high attractive faces. Furthermore, regression analysis showed that attractiveness was negatively associated with distinctiveness – the more attractive a face, the less distinctive it was rated. These findings replicate previous observations of an inverse relationship between facial attractiveness and facial distinctiveness (Light et al., 1981; Peskin & Newell, 2004; Rhodes & Tremewan, 1996; Vokey & Read, 1992) and support the claim that attractive and averaged faces are more prototypical than unattractive faces.
In closing this section, we should note that faces with atypical features are sometimes rated as highly attractive or even more attractive than averaged faces (Alley & Cunningham, 1991; Cunningham, Barbee, & Pike, 1990; Mende-Siedlecki, Said, & Todorov, 2013; Perrett, May, & Yoshikawa, 1994; Wickham & Morris, 2003). However, comparison of these findings with the predictions of averageness theory (or any other theory for that matter) is impeded by the fact that measurement of the relationship between attractiveness and distance from the prototype varies across studies. For example, some studies measure facial typicality (the degree of deviation from an averaged face) whereas other studies measure facial distinctiveness (the degree to which a face stands out in a crowd). Wickham and Morris (2003) directly compared these two measures and found a strong linear inverse relationship between attractiveness and typicality but a curvilinear relationship between attractiveness and distinctiveness. They explained their findings by suggesting that some high attractive faces might be similar to an averaged face overall, yet also distinctive due to certain unique factors such as the presence of an unusual facial feature or the similarity of a face to friends, relatives, or famous people.4 Thus the findings of Wickham and Morris support the basic claim of averageness theory by suggesting that proximity to the facial prototype is necessary for a face to be considered attractive, although such attractiveness may be modulated by other known factors such as individual rater preferences, facial sexual dimorphism, symmetry, familiarity, and hormone dependent facial features (Fink, Neave, Manning, & Grammer, 2006; Hönekopp, 2006; Hoss et al., 2005; Penton-Voak et al., 2001; Perrett et al., 1998; Peskin & Newell, 2004; Rennels et al., 2008; Rhodes, Profitt, Grady, & Sumich, 1998; Rhodes & Tremewan, 1996; Rubenstein et al., 2002; Thornhill & Gangestad, 1999).
Attractive and Averaged Faces Engage Fluent Neurocognitive Processing
Our second finding showed that participants categorized high attractive and averaged faces as “human” faster than low attractive faces. These RT differences, though small (~ 4 – 5 ms), were highly reliable and are consistent with a previous observation that attractiveness facilitates the speed and accuracy of gender-based face classification (Hoss et al., 2005). Importantly, the present RT findings demonstrate for the first time that, like high attractive faces, prototypical (averaged) faces are processed more fluently than unattractive faces. Given that our participants also rated the averaged faces as highly attractive, these findings support the premise of averageness theory - that high attractive faces are attractive and unattractive faces are unattractive by virtue of their respective similarity and dissimilarity to the averaged face and the effects this has on the ease of face processing.
Our third finding demonstrated that the more fluent processing of averaged and high attractive faces was accompanied by a reduced N170 ERP component relative to the N170 elicited by the less fluently processed low attractive faces. We observed these findings both before and after latency jitter correction of the N170 (see next section, below). These findings replicate a previously observed N170 reduction in response to attractive versus unattractive faces (Halit et al., 2000), while extending this observation to the case of averaged faces. Our study also extends Halit et al. by examining these attractiveness-related N170 changes in the context of similar changes in RT (the earlier study used a simple passive viewing paradigm). This allows us to draw conclusions about the fluency of the neurocognitive processes indexed by the N170. Regression analyses showed that larger N170 amplitude were associated with longer RTs both within and across the human face conditions both before and after N170 latency jitter correction. In addition, RTs were associated with noncorrected and corrected N170 amplitude across conditions in the context of additional predictors of attractiveness and distinctiveness ratings. Our findings are also consistent with the well-known N170 face inversion effect (enhanced N170 for inverted versus upright photorealistic faces; Itier & Taylor, 2002; Itier & Taylor, 2004a, 2004b; Rossion et al., 1999; Rossion et al., 2003; Vizioli et al., 2010) that is thought to arise from the disruption of configural processing of inverted faces that is preserved for upright faces (Rossion & Gauthier, 2002). Here, we conjecture that the different levels of fluent processing do not arise from a disruption of configural processing per se, but instead are due to the configural similarity of the high attractive and averaged faces to facial prototypes developed through life-long experience with faces.
A further observation of interest is that the regression analyses indicated that decreases in attractiveness ratings across averaged to high attractive to low attractive conditions predicted corresponding increases in latency jitter corrected N170 amplitude. However, analysis of the R2 change statistic showed that both attractiveness and RT were associated with the latency jitter corrected N170 amplitude in a roughly equal manner. That is, both behavioral indices are each uniquely related to the N170 response and thus do not reflect exactly the same cognitive processes. We speculate that the attractiveness ratings index the effect of distance from the prototype on processing fluency during the early perceptual stage indexed by the N170, whereas RT may reflect the effects such fluent processing has on later cognitive processes directly responsible for the production of an overt motor response.
We also observed poorer categorization accuracy, slower RTs and a larger N170 for chimpanzee versus human faces, a finding consistent with the interpretation that the former were processed less fluently than the latter. However, this interpretation is confounded by the fact that the chimpanzee stimuli were not matched with the human faces in terms of physical stimulus properties or stimulus probability; infrequent stimuli, such as the chimpanzee faces, are especially well-known to produce increased RTs and ERP amplitudes, all other factors being equal (Blackman, 1972; Squires, Donchin, Herning, & McCarthy, 1977). Nevertheless, interpretation of the regression analysis relating the N170 to RTs within the chimpanzee face condition is not subject to these confounds because between-condition differences in stimulus property and frequency are not relevant. Here, the regression analysis found that larger latency jitter-corrected and noncorrected N170 amplitude were associated with longer RTs within the chimpanzee face condition. This finding provides further evidence that the N170 reflected the processing fluency of the faces.
We note that averageness theory also predicts that to the degree to which the averaged faces are closer to the prototype than the high attractive individual faces, then the former should be more fluently processed than the latter. This fluent processing should manifest as differences in RT and N170 response. However, we found no mean RT/N170 differences between the high attractive individual and averaged faces, suggesting that both kinds of faces were processed with roughly equal fluency. We speculate that these null findings between the high attractive and averaged faces indicate that the early stages of the visual system treat different faces as highly similar when they are within a certain degree of proximity to the prototype. The averaged faces we utilized were arguably closer to the prototype than the high attractive faces because the former were composites of 32 individual exemplars; this conclusion is also supported by the lower distinctiveness ratings for the averaged versus high attractive faces. However, we did not explicitly quantify how much closer the averaged faces were to the prototype than the high attractive faces; it may be that the distance between the two face types is small enough that only perceptual differences (i.e. attractiveness, distinctiveness), and not fluency differences, are supported between the two faces categories. Nevertheless, it is likely the case that if we were to use slightly less attractive faces for the high attractive face condition and/or used a better estimate of the facial prototype (by using air brushing or mixed race faces during the construction of the average faces, for example), fluency differences between the averaged and individual high attractive faces would emerge. This raises an interesting question for future research, namely what is the criterion distance at which different faces will be treated as similar to one another by the brain? This question could be answered by a future study employing a finer parametric variation of attractiveness and distance from the prototype among individual and averaged faces.
Could it be the case that, rather than fluency, our N170 effects merely reflect an increased salience of the high attractive and averaged faces relative to the low attractive faces? This is unlikely because previous studies linking stimulus salience to the N170 have observed a larger response for this component for salient versus non-salient stimuli (Batty & Taylor, 2003; Blau, Maurer, Tottenham, & McCandliss, 2007), the opposite pattern to that observed here. It is also unlikely that our N170 effects are due to the low attractive faces being more salient because of their high distinctiveness—salient stimuli should be more easily detectable and/or discriminable and thus should lead to faster categorization RTs for this condition, again a pattern opposite to that observed here. Furthermore, regression analysis showed that ratings of facial distinctiveness were not associated with N170 amplitude in the present data set. Finally, these N170 effects cannot be due to the low attractive faces possessing salient low-level stimulus properties, as these were matched across face categories (see Supplemental Materials).
We close this section by noting that these N170 fluency effects are most likely not specific to faces because this ERP component is also larger for subordinate versus basic level nonface object categorization (Tanaka, Luu, Weisbrod, & Kiefer, 1999), as well as nonface objects of expertise versus objects of non-expertise (Busey & Vanderkolk, 2005; Rossion, Collins, Goffaux, & Curran, 2007; Tanaka & Curran, 2001). This suggests a more general N170 sensitivity to entry-level object categorization (Rossion et al., 2002). Indeed the N170 evidence implies that expert object categorization performance recruits similar experience-dependent early stage neural resources as faces (Busey & Vanderkolk, 2005; Rossion et al., 2007; Tanaka & Curran, 2001), although the exact mechanism of how this is accomplished is still unknown (Rossion & Jacques, 2011). Nonetheless, it is important to distinguish these general N170 expertise effects from the N170 fluency effects reported here. General expertise effects are defined via across-category comparisons (e.g. cars versus birds, faces vs. non-faces, etc.) and thus reflect a preference for objects of expertise over those of other objects. In contrast, the present N170 effects are defined via a comparison within a single object category (e.g. human faces) and thus reflect a preference for a particular configuration of the same object. Hence like the N170 face inversion effect, our findings suggest that when category structure is held constant, a prototypical object will elicit a smaller N170 response than a non-prototypical object. However, if both stimuli are also objects of expertise, they will produce a larger N170 response than objects of non-expertise (absent the presence of other confounding factors such as the low stimulus frequency of the chimpanzee faces relative to the human faces in the present study). This suggestion is supported by the N170 face inversion effect, as well as an N170 inversion effect for non-face objects of expertise (Rossion et al., 2002) and the impairment of expert non-face object categorization performance with inversion (Diamond & Carey, 1986; Rossion & Curran, 2010).
N170 Fluency Effects Reflect the Engagement of Fewer Neural Resources
Our fourth finding suggests that the overall reduction in N170 differences for high attractive and averaged faces versus low attractive faces resulted from differences in the degree to which these stimuli engaged neural resources and not from a difference in the temporal consistency of that resource engagement. Our single-trial EEG latency jitter correction technique produced jitter-free measures of ERP amplitude to index the relative contribution of amplitude and timing changes to the between-category differences that were evident in the noncorrected ERPs. Corrected N170 amplitudes were smaller for high attractive and averaged faces versus low attractive faces and were significantly associated with longer RTs within and across face conditions. Nevertheless, no single-trial EEG latency jitter difference accompanied these N170 amplitude differences. This indicates that the N170 differences are due to differences in the amplitude of the neural activity underlying the N170. Additional support for this conclusion is that we did not observe any N170 latency delays for one condition relative to another, either in the conventional ERP analysis or the latency jitter corrected analysis. Such delays (~ 10 – 20 ms) are often observed for inverted versus upright faces (Bentin et al., 1996; Rossion et al., 1999; Rossion et al., 2000) or when facial configuration information is removed or degraded (as happens with inversion). These latency delays arise from either a lag in the onset of face processing or a slower rate at which face information is accumulated by the neurons representing the faces (Rossion & Jacques, 2011). Such latency delays should not be expected in the present data, as all of our stimuli portrayed complete facial configurations in upright orientations. The fact that we observed no such N170 delays provides additional evidence that timing differences were not a factor in the present data.
Our finding of an overall reduction in latency jitter corrected N170 amplitude to high attractive and averaged faces versus low attractive faces is consistent with previous observations of decreased hemodynamic activity in human visual cortex for prototypical versus nonprototypical faces and visual dot patterns (Loffler et al., 2005; Reber et al., 1998) and with larger firing rates of face-selective neurons in the inferotemporal cortex of nonhuman primates for nonprototypical individual faces versus the average of the faces (Leopold et al., 2006). Our findings are also consistent with the conclusion of Rousselet, Husk, Bennett, & Sekuler (2007) that differences in the timing of single-trial EEG responses do not contribute to the large N170 face effect (i.e. larger N170 for faces versus objects). Rousselet et al. showed that the N170 face effect arises from between-condition EEG amplitude differences in the 5 – 15 Hz range via wavelet-based time-frequency analysis, which can decompose an EEG signal into component signals of individual frequencies to separately quantify their amplitude and phase. However, this prior study was unable to reach a definite conclusion regarding the contribution of single-trial EEG timing changes to the much smaller N170 face inversion effect because of the poor temporal resolution of wavelet analysis at low frequencies. In contrast, the single-trial analysis used here does not suffer from this problem because it directly quantified single-trial peak latencies on each trial with millisecond resolution. Thus we were able to reach a decisive conclusion about the contribution of amplitude and timing changes to the even smaller attractiveness-related N170 effects observed here. One suggestion for future research is to apply our single-trial analysis method to studies of the face inversion effect to confirm the likelihood that this effect also depends purely on between-condition changes in EEG amplitude.
Conclusion
We have provided novel evidence that high attractive and mathematically averaged faces both engage fluent facial processing at early stages of visual perception. The present findings, together with previous observations (Bronstad et al., 2008; Langlois & Roggman, 1990; Langlois et al., 1994; Rhodes & Tremewan, 1996; Rubenstein et al., 1999), support the theory that faces are perceived as attractive when they approximate an average facial configuration.
Supplementary Material
Acknowledgments
We thank Arian Mobasser, Stevie Schein, and Erin Anderson for assistance with data collection. We thank Connor Principe and three anonymous reviewers for comments on earlier drafts of this manuscript. This research was supported by the National Institutes of Health [HD021332 to JHL; 5T32MH065728-08 through the Texas Consortium in Behavioral Neuroscience Diversity Training Program to LTT].
Footnotes
We also measured the early (~100 ms) P1 and the intermediate stage (~ 200 – 300 ms) P2 ERP components as part of our N170 quantification methodology (see Methods – ERP quantification – N170 latency jitter correction (LJC) analysis section, below). Despite a previous finding that the P1 component is sensitive to facial attractiveness (Halit, de Haan, & Johnson, 2000), we do not present a detailed analysis of the P1 component in this paper because preliminary analyses revealed no P1 differences among the human faces. In the Supplemental Materials, we report an analysis of the P2, as this component reflected attractiveness-related affective factors that were not directly relevant to processing fluency, the main focus of this paper.
We utilized an average reference because Joyce and Rossion (2005) showed that it optimally indexes categorical differences for the N170 ERP component. Although the size of the electrode montage used in the present study (32 channels) is lower than typically recommended for use of an average reference (> 64 electrodes; Junghöfer, Elbert, Tucker, & Braun, 1999), we believe these ERP findings are not dependent on choice of EEG reference. An additional analysis (data not shown) utilizing a CZ reference and an estimation of a neutral reference “at infinity” (Yao, 2001) revealed similar ERP effects to those found using the average reference.
Additional ANOVAs on the non-latency jitter corrected ERP data that included block as a factor revealed no significant differences among the different human face types as a function of block for the N170 amplitudes or latencies (ps < .341). Thus we report the results of the N170 component derived from averages across all trials within each condition in order to increase the signal-to-noise ratio of the ERPs and hence the statistical power.
We also suggest that attractiveness and distinctiveness ratings could be distorted by using stimulus sets that are unbalanced in terms of the number of attractive and unattractive faces, as was done in some of these studies (Mende-Siedlecki et al., 2013; Perrett et al., 1994). For example, a small number of attractive faces embedded in a larger set of less attractive faces could appear to be highly distinctive due to their low frequency, whereas attractiveness ratings of a set of extremely attractive faces could be driven by distinctiveness factors as participants search for any criteria to distinguish among the faces. In the present study, our stimulus set was balanced among attractive and unattractive faces, so we measured the distinctiveness of the faces due to the greater generality of this property.
References
- Alley TR, Cunningham MR. Averaged faces are attractive, but very attractive faces are not average. Psychological Science. 1991;2:123–125. [Google Scholar]
- Apicella CL, Little AC, Marlowe FW. Facial averageness and attractiveness in an isolated population of hunter-gatherers. Perception. 2007;36:1813–1820. doi: 10.1068/p5601. [DOI] [PubMed] [Google Scholar]
- Batty M, Taylor MJ. Early processing of the six basic facial emotional expressions. Cognitive Brain Research. 2003;17:613–620. doi: 10.1016/s0926-6410(03)00174-5. [DOI] [PubMed] [Google Scholar]
- Bentin S, Allison T, Puce A, Perez E, McCarthy C. Electrophysiological studies of face perception in humans. Journal of Cognitive Neuroscience. 1996;8:551–565. doi: 10.1162/jocn.1996.8.6.551. [DOI] [PMC free article] [PubMed] [Google Scholar]
- Blackman AR. Stimulus probability and choice reaction time. Perception & Psychophysics. 1972;12:146–150. [Google Scholar]
- Blau VC, Maurer U, Tottenham N, McCandliss BD. The face-specific N170 component is modulated by emotional facial expression. Behavioral and Brain Functions. 2007;3 doi: 10.1186/1744-9081-3-7. [DOI] [PMC free article] [PubMed] [Google Scholar]
- Bronstad PM, Langlois JH, Russell R. Computational models of facial attractiveness judgments. Perception. 2008;37:126–142. doi: 10.1068/p5805. [DOI] [PubMed] [Google Scholar]
- Busey TA, Vanderkolk JR. Behavioral and electrophysiological evidence for configural processing in fingerprint experts. Vision Research. 2005;45:431–448. doi: 10.1016/j.visres.2004.08.021. [DOI] [PubMed] [Google Scholar]
- Cunningham MR, Barbee AP, Pike CL. What do women want? Facialmetric assessment of multiple motives in the perception of male facial physical attractiveness. Journal of Personality and Social Psychology. 1990;59:61–72. doi: 10.1037//0022-3514.59.1.61. [DOI] [PubMed] [Google Scholar]
- Deffke I, Sander T, Heidenreich J, Sommer W, Curio G, Trahms L, Lueschow A. MEG/EEG sources of the 170-ms response to faces are co-localized in the fusiform gyrus. NeuroImage. 2007;35:1495–1501. doi: 10.1016/j.neuroimage.2007.01.034. [DOI] [PubMed] [Google Scholar]
- Delorme A, Makeig S. EEGLAB: an open source toolbox for analysis of single-trial EEG dynamics including independent component analysis. Journal of Neuroscience Methods. 2004;134(1):9–21. doi: 10.1016/j.jneumeth.2003.10.009. [DOI] [PubMed] [Google Scholar]
- Diamond R, Carey S. Why faces are and are not special: An effect of expertise. Journal of Experimental Psychology: General. 1986;115:107–117. doi: 10.1037//0096-3445.115.2.107. [DOI] [PubMed] [Google Scholar]
- Fabre-Thorpe M, Delorme A, Marlot C, Thorpe S. A limit to the speed of processing in ultra-rapid visual categorization of novel scenes. Journal of Cognitive Neuroscience. 2001;13:171–180. doi: 10.1162/089892901564234. [DOI] [PubMed] [Google Scholar]
- Fink B, Neave N, Manning JT, Grammer K. Facial symmetry and judgments of attractiveness, health and personality. Personality and Individual Differences. 2006;41:491–499. [Google Scholar]
- Fink B, Penton-Voak I. Evolutionary psychology of facial attractiveness. Current Directions on Psychological Science. 2002;11:154–158. [Google Scholar]
- Gardiner JC, Luo Z, Roman LA. fixed effects, random effects and GEE: What are the differences? Statistics in Medicine. 2009;28:221–239. doi: 10.1002/sim.3478. [DOI] [PubMed] [Google Scholar]
- Ghisletta P, Spini D. An introduction to generalized estimating equations and an application to assess selectivity effects in a longitudinal study on very old individuals. Journal of Educational and Behavioral Statistics. 2004;29:421–437. [Google Scholar]
- Gratton G, Kramer AF, Coles MGH, Donchin E. Simulation studies of latency measures of components of the event-related brain potential. Psychophysiology. 1989;26:233–248. doi: 10.1111/j.1469-8986.1989.tb03161.x. [DOI] [PubMed] [Google Scholar]
- Greenhouse SW, Geisser S. On methods in the analysis of profile data. Psychometrika. 1959;24:95–112. [Google Scholar]
- Griffin AM, Langlois JH. Stereotype directionality and attractiveness stereotyping: Is beauty good or is ugly bad? Social Cognition. 2006;24:187–206. doi: 10.1521/soco.2006.24.2.187. [DOI] [PMC free article] [PubMed] [Google Scholar]
- Gruber WR, Klimesch W, Sauseng P, Doppelmayr M. Alpha phase synchronization predicts P1 and N1 latency and amplitude size. Cerebral Cortex. 2005;15:371–377. doi: 10.1093/cercor/bhh139. [DOI] [PubMed] [Google Scholar]
- Halgren E, Raji T, Marinkovic K, Jousmäki V, Hari R. Cognitive response profile of the human fusiform face area as determined by MEG. Cerebral Cortex. 2000;10:69–81. doi: 10.1093/cercor/10.1.69. [DOI] [PubMed] [Google Scholar]
- Halit H, de Haan M, Johnson MH. Modulation of event-related potentials by prototypical and atypical faces. NeuroReport. 2000;11:1871–1875. doi: 10.1097/00001756-200006260-00014. [DOI] [PubMed] [Google Scholar]
- Hamermesh DS. Beauty pays: Why attractive people are more successful. Princeton, NJ: Princeton University Press; 2011. [Google Scholar]
- Harmon-Jones E, Allen JJB. The role of affect in the mere exposure effect: Evidence from psychophysiological and individual difference approaches. Personality and Social Psychology Bulletin. 2001;27:889–898. [Google Scholar]
- Haxby JV, Hoffman EA, Gobbini IA. The distributed neural system for face perception. Science. 2000;4:223–233. doi: 10.1016/s1364-6613(00)01482-0. [DOI] [PubMed] [Google Scholar]
- He P, Wilson G, Russell C. Removal of ocular artifacts from electroencephalogram by adaptive filtering. Medical & Biological Engineering & Computing. 2004;42:407–412. doi: 10.1007/BF02344717. [DOI] [PubMed] [Google Scholar]
- Holm S. A simple sequentially rejective multiple test procedure. Scandinavian Journal of Statisitics. 1979;6:65–70. [Google Scholar]
- Hönekopp J. Once more: Is beauty in the eye of the beholder? Relative contributions of private and shared taste to judgments of facial attractiveness. Journal of Experimental Psychology: Human Perception and Performance. 2006;32:199–209. doi: 10.1037/0096-1523.32.2.199. [DOI] [PubMed] [Google Scholar]
- Hoss RA, Ramsey JL, Griffin AM, Langlois JH. The role of facial attractiveness and facial masculinity/femininity in sex classification of faces. Perception. 2005;34:1459–1474. doi: 10.1068/p5154. [DOI] [PMC free article] [PubMed] [Google Scholar]
- Itier RJ, Taylor MJ. Inversion and contrast polarity reversal affect both encoding and recognition processes of unfamiliar faces: a repetition study using ERPs. NeuroImage. 2002;15:353–373. doi: 10.1006/nimg.2001.0982. [DOI] [PubMed] [Google Scholar]
- Itier RJ, Taylor MJ. Effects of repetition learning on upright, inverted, and contrast-reversed face processing using ERPs. NeuroImage. 2004a;21:1518–1532. doi: 10.1016/j.neuroimage.2003.12.016. [DOI] [PubMed] [Google Scholar]
- Itier RJ, Taylor MJ. N170 or N1? Spatiotemporal differences between object and face processing using ERPs. Cerebral Cortex. 2004b;14:132–142. doi: 10.1093/cercor/bhg111. [DOI] [PubMed] [Google Scholar]
- Jacques C, Rossion B. Early electrophysiological responses to multiple face orientations correlate with individual discrimination performance in humans. NeuroImage. 2007;36:863–876. doi: 10.1016/j.neuroimage.2007.04.016. [DOI] [PubMed] [Google Scholar]
- Jáskowski P, Verleger R. An evaluation of methods for single-trial estimation of P3 latency. Psychophysiology. 2000;37:153–162. [PubMed] [Google Scholar]
- Jeffreys DA. A face-responsive potential recorded from the human scalp. Experimental Brain Research. 1989;78:193–202. doi: 10.1007/BF00230699. [DOI] [PubMed] [Google Scholar]
- Jeffreys DA. Evoked studies of face and object processing. Visual Cognition. 1996;6:1–38. [Google Scholar]
- Joyce C, Rossion B. The face-sensitive N170 and VPP components manifest the same brain processes: The effect of reference electrode site. Clinical Neurophysiology. 2005;116:2613–2631. doi: 10.1016/j.clinph.2005.07.005. [DOI] [PubMed] [Google Scholar]
- Judge TA, Hurst C, Simon LS. Does it pay to be smart, attractive, or confident (or all three)? Relationships among general mental ability, physical attractiveness, core self-evaluations, and income. Journal of Applied Psychology. 2009;94:742–755. doi: 10.1037/a0015497. [DOI] [PubMed] [Google Scholar]
- Junghöfer M, Elbert T, Tucker DM, Braun C. The polar average reference effect: a bias in estimating the head surface integral in EEG recording. Clinical Neurophysiology. 1999;110:1149–1155. doi: 10.1016/s1388-2457(99)00044-9. [DOI] [PubMed] [Google Scholar]
- Kalick SM, Zebrowitz LA, Langlois JH, Johnson RM. Does human facial attractiveness honestly advertise health? Psychological Science. 1998;9:8–13. [Google Scholar]
- Kanwisher N, McDermott J, Chun MM. The fusiform face area: A module in human extrastriate cortex specialized for face perception. Journal of Neuroscience. 1997;17:4302–4311. doi: 10.1523/JNEUROSCI.17-11-04302.1997. [DOI] [PMC free article] [PubMed] [Google Scholar]
- Klimesch W, Schack B, Schabus M, Doppelmayr M, Gruber W, Sauseng P. Phase-locked alpha and theta oscillations generate the P1–N1 complex and are related to memory performance. Cognitive Brain Research. 2004;19:302–316. doi: 10.1016/j.cogbrainres.2003.11.016. [DOI] [PubMed] [Google Scholar]
- Komatsu LK. Recent views of conceptual structure. Psychological Bulletin. 1992;112:500–526. [Google Scholar]
- Langlois JH, Kalakanis L, Rubenstein AJ, Larson A, Hallam M, Smoot M. Maxims or myths of beauty? A meta-analytic and theoretical review. Psychological Bulletin. 2000;126:390–423. doi: 10.1037/0033-2909.126.3.390. [DOI] [PubMed] [Google Scholar]
- Langlois JH, Ritter JM, Casey RJ, Sawin DB. Infant attractiveness predicts maternal behaviors and attitudes. Developmental Psychology. 1995;31:464–472. [Google Scholar]
- Langlois JH, Roggman LA. Attractive faces are only average. Psychological Science. 1990;1:115–121. [Google Scholar]
- Langlois JH, Roggman LA, Casey RJ, Ritter JM. Infant preferences for attractive face: Rudiments of a stereotype? Developmental Psychology. 1987;23:363–369. [Google Scholar]
- Langlois JH, Roggman LA, Musselman L. What is average and what is not average about attractive faces? Psychological Science. 1994;5:214–220. [Google Scholar]
- Langlois JH, Roggman LA, Rieser-Danner LA. Infants’ differential social responses to attractive and unattractive faces. Developmental Psychology. 1990;26:153–159. [Google Scholar]
- Leopold DA, Bondar IV, Giese MA. Norm-based face encoding by single neurons in the monkey inferotemporal cortex. Nature. 2006;442:572–575. doi: 10.1038/nature04951. [DOI] [PubMed] [Google Scholar]
- Light LL, Hollander S, Kayra-Stuart F. Whay attractive people are harder to remember. Personality and Social Psychology Bulletin. 1981;7:269–276. [Google Scholar]
- Linkenkaer-Hansen K, Palva JM, Sams M, Hietanen JK, Aronen HJ, Ilmoniemi RJ. Face-selective processing in human extrastriate cortex around 120 ms after stimulus onset revealed by magneto- and electroencephalography. Neuroscience Letters. 1998;253:147–150. doi: 10.1016/s0304-3940(98)00586-2. [DOI] [PubMed] [Google Scholar]
- Loffler G, Yourganov G, Wilkinson F, Wilson HR. fMRI evidence for the neural representation of faces. Nature Neuroscience. 2005;8:1386–1390. doi: 10.1038/nn1538. [DOI] [PubMed] [Google Scholar]
- Makeig S, Westerfield M, Jung TP, Enghoff S, Townsend J, Courchesne E. Dynamic brain sources of visual evoked responses. Science. 2002;295:690–694. doi: 10.1126/science.1066168. [DOI] [PubMed] [Google Scholar]
- Mende-Siedlecki P, Said CP, Todorov A. The social evaluation of faces: a meta-analysis of functional neuroimaging studies. Social Cognitive and Affective Neuroscience. 2013;8:285–299. doi: 10.1093/scan/nsr090. [DOI] [PMC free article] [PubMed] [Google Scholar]
- Penton-Voak IS, Jones BC, Little AC, Baker S, Tiddeman B, Burt DM, Perrett DI. Symmetry, sexual dimorphism in facial proportions and male facial attractiveness. Proceedings of the Royal Society of London. B Biological Sciences. 2001;268:1617–1623. doi: 10.1098/rspb.2001.1703. [DOI] [PMC free article] [PubMed] [Google Scholar]
- Perrett DI, Lee KJ, Penton-Voak I, Rowland D, Yoshikawa S, Burt DM, Akamatsu S. Effects of sexual dimorphism on facial attractiveness. Nature. 1998;394:884–887. doi: 10.1038/29772. [DOI] [PubMed] [Google Scholar]
- Perrett DI, May KA, Yoshikawa S. Facial shape judgements of female attractiveness. Nature. 1994;368:239–242. doi: 10.1038/368239a0. [DOI] [PubMed] [Google Scholar]
- Perrin F, Perrier J, Bertrand O, Giard MH, Echallier JF. Mapping of scalp potentials by surface spline interpolation. Electroencephalography and Clinical Neurophysiology. 1987;66:75–81. doi: 10.1016/0013-4694(87)90141-6. [DOI] [PubMed] [Google Scholar]
- Peskin M, Newell FN. Familiarity breeds attraction: Effects of exposure on the attractiveness of typical and distinctive faces. Perception. 2004;33:147–157. doi: 10.1068/p5028. [DOI] [PubMed] [Google Scholar]
- Picton TW, Bentin S, Berg P, Donchin E, Hillyard SA, Johnson R, Jr, Taylor MJ. Guidelines for using human event-related potentials to study cognition: recording standards and publication criteria. Psychophysiology. 2000;37(2):127–152. [PubMed] [Google Scholar]
- Posner MI, Keele SW. Retention of abstract ideas. Journal of Experimental Psychology. 1970;83:304–308. doi: 10.1037/h0025953. [DOI] [PubMed] [Google Scholar]
- Principe CP, Langlois JH. Faces differing in attractiveness elicit corresponding affective responses. Cognition and Emotion. 2011;25:140–148. doi: 10.1080/02699931003612098. [DOI] [PMC free article] [PubMed] [Google Scholar]
- Principe CP, Langlois JH. Shifting the prototype: Experience with faces influence affective and attractiveness preferences. Social Cognition. 2012;30:108–120. doi: 10.1521/soco.2012.30.1.109. [DOI] [PMC free article] [PubMed] [Google Scholar]
- Ratcliff R. Methods for dealing with reaction time outliers. Psychological Bulletin. 1993;114:510–532. doi: 10.1037/0033-2909.114.3.510. [DOI] [PubMed] [Google Scholar]
- Reber PJ, Stark CEL, Squire LR. Cortical areas supporting category learning identified using functional MRI. Proceedings of the National Academy of Sciences USA. 1998;95:747–750. doi: 10.1073/pnas.95.2.747. [DOI] [PMC free article] [PubMed] [Google Scholar]
- Reed SK. Pattern recognition and categorization. Cognitive Psychology. 1972;3:382–407. [Google Scholar]
- Rennels JL, Bronstad PM, Langlois JH. Are attractive men’s faces masculine or feminine? The importance of type of facial stimuli. Journal of Experimental Psychology: Human Perception and Performance. 2008;34:884–893. doi: 10.1037/0096-1523.34.4.884. [DOI] [PubMed] [Google Scholar]
- Rhodes G. The evolutionary psychology of facial beauty. Annual Review of Psychology. 2006;57:199–226. doi: 10.1146/annurev.psych.57.102904.190208. [DOI] [PubMed] [Google Scholar]
- Rhodes G, Proffitt F, Grady JM, Sumich A. Facial symmetry and the perception of beauty. Psychonomic Bulletin & Review. 1998;5:659–669. [Google Scholar]
- Rhodes G, Profitt F, Grady JM, Sumich A. Facial symmetry and the perception of beauty. Psychonomic Bulletin & Review. 1998;5:659–669. [Google Scholar]
- Rhodes G, Tremewan T. Averageness, exaggeration, and facial attractiveness. Psychological Science. 1996;7:105–110. [Google Scholar]
- Riani M, Perrotta D, Torti F. FSDA: A MATLAB toolbox for robust analysis and interactive data exploration. Chemometrics and Intelligent Laboratory Design. 2012;116:17–32. [Google Scholar]
- Rosch E, Mervis CB, Gray WD, Johnson DM, Boyes-Braem P. Basic objects in natural categories. Cognitive Psychology. 1976;8:382–439. [Google Scholar]
- Rossion B, Curran T. Visual expertise with pictures of cars correlates with RT magnitude of the car inversion effect. Perception. 2010;39:173–183. doi: 10.1068/p6270. [DOI] [PubMed] [Google Scholar]
- Rossion B, Collins D, Goffaux V, Curran T. Long-term expertise with artificial objects increases visual competition with early face categorization processes. Journal of Cognitive Neuroscience. 2007;19:543–555. doi: 10.1162/jocn.2007.19.3.543. [DOI] [PubMed] [Google Scholar]
- Rossion B, Curran T, Gauthier I. A defense of the subordinate-level expertise account for the N170 component. Cognition. 2002;85:189–196. doi: 10.1016/s0010-0277(02)00101-4. [DOI] [PubMed] [Google Scholar]
- Rossion B, Delvenne JF, Debatisse D, Goffaux V, Bruyer R, Crommelinck M, Guérit JM. Spatio-temporal localization of the face inversion effect: an event-related potentials study. Biological Psychology. 1999;50:173–189. doi: 10.1016/s0301-0511(99)00013-7. [DOI] [PubMed] [Google Scholar]
- Rossion B, Gauthier I. How does the brain process upright and inverted faces? Behavioral and Cognitive Neuroscience Reviews. 2002;1:63–75. doi: 10.1177/1534582302001001004. [DOI] [PubMed] [Google Scholar]
- Rossion B, Gauthier I, Tarr MJ, Despland P, Bruyer R, Linotte S, Crommelinck M. The N170 occipito-temporal component is delayed and enhanced to inverted faces but not inverted objects: an electrophysiological account of face-specific processes in the human brain. NeuroReport. 2000;11:70–74. doi: 10.1097/00001756-200001170-00014. [DOI] [PubMed] [Google Scholar]
- Rossion B, Jacques C. The N170: Understanding the time course of face perception in the human brain. In: Luck S, Kappenman E, editors. The Oxford Handbook of ERP Components. New York, New York: Oxford University Press; 2011. pp. 115–142. [Google Scholar]
- Rossion B, Joyce CA, Cottrell GW, Tarr MJ. Early lateralization and orienting tuning for face, word, and object processing in the visual cortex. NeuroImage. 2003;20:1609–1624. doi: 10.1016/j.neuroimage.2003.07.010. [DOI] [PubMed] [Google Scholar]
- Rousseeuw PJ, Leroy AM. Robust Regression and Outlier Detection. Hoboken, New Jersey: John Wiler & Sons, Inc; 2003. [Google Scholar]
- Rousselet GA, Husk JS, Bennett PJ, Sekuler AB. Single-trial EEG dynamics of object and face processing. NeuroImage. 2007;36:843–862. doi: 10.1016/j.neuroimage.2007.02.052. [DOI] [PubMed] [Google Scholar]
- Rubenstein AJ, Kalakanis L, Langlois JH. Infant preferences for attractive faces: A cognitive explanation. Developmental Psychology. 1999;35:848–855. doi: 10.1037//0012-1649.35.3.848. [DOI] [PubMed] [Google Scholar]
- Rubenstein AJ, Langlois JH, Roggman LA. What makes a face attractive and why: The role of averageness in defining facial beauty. In: Rhodes G, Zebrowitz LA, editors. Facial Attractiveness: Evolutionary, Cognitive, and Social Perspectives. Westport, CT, USA: Ablex Publishing; 2002. pp. 1–33. [Google Scholar]
- Schacht A, Werheid K, Sommer W. The appraisal of facial beauty is rapid but not mandatory. Cognitive, Affective, & Behavioral Neuroscience. 2008;8:132–142. doi: 10.3758/cabn.8.2.132. [DOI] [PubMed] [Google Scholar]
- Smulders FTY, Kenemans JL, Kok A. A comparison of different methods for estimating single-trial P300 latencies. Electroencephalography and Clinical Neurophysiology. 1994;92:107–114. doi: 10.1016/0168-5597(94)90051-5. [DOI] [PubMed] [Google Scholar]
- Spencer KM. Averaging, detection, and classification of single-trial ERPs. In: Handy TC, editor. Event-Related Potentials: A Methods Handbook. Cambridge, MA: MIT Press; 2005. pp. 209–228. [Google Scholar]
- Spencer KM, Abad EV, Donchin E. On the search for the neurophysiological manifestation of recollective experience. Psychophysiology. 2000;37:494–506. [PubMed] [Google Scholar]
- Squires KC, Donchin E, Herning RI, McCarthy G. On the influence of task relevance and stimulus probability on event-related-potential components. Electroencephalography and Clinical Neurophysiology. 1977;42:1–14. doi: 10.1016/0013-4694(77)90146-8. [DOI] [PubMed] [Google Scholar]
- Tanaka JW, Curran T. A neural basis for expert object recognition. Psychological Science. 2001;12:43–47. doi: 10.1111/1467-9280.00308. [DOI] [PubMed] [Google Scholar]
- Tanaka JW, Luu P, Weisbrod M, Kiefer M. Tracking the time course of object categorization using event-related potentials. NeuroReport. 1999;10:829–835. doi: 10.1097/00001756-199903170-00030. [DOI] [PubMed] [Google Scholar]
- Thornhill R, Gangestad SW. Human facial beauty: Averageness, symmetry, and parasite resistance. Human Nature. 1993;4:237–269. doi: 10.1007/BF02692201. [DOI] [PubMed] [Google Scholar]
- Thornhill R, Gangestad SW. Facial attractiveness. Trends in Cognitive Science. 1999;3:452–460. doi: 10.1016/s1364-6613(99)01403-5. [DOI] [PubMed] [Google Scholar]
- Trujillo LT, Allen JJB. Theta EEG dynamics of the error-related negativity. Clinical Neurophysiology. 2007;118:645–668. doi: 10.1016/j.clinph.2006.11.009. [DOI] [PubMed] [Google Scholar]
- Trujillo LT, Kornguth S, Schnyer DM. An ERP examination of the differential effects of sleep deprivation on exogenously cued and endogenously cued attention. Sleep. 2009;32:1285–1297. doi: 10.1093/sleep/32.10.1285. [DOI] [PMC free article] [PubMed] [Google Scholar]
- Vizioli L, Foreman K, Rousselet GA, Caldara R. Inverting faces elicits sensitivity to race on the N170 component: a cross-cultural study. Journal of Vision. 2010;10(1):15, 11–23. doi: 10.1167/10.1.15. [DOI] [PubMed] [Google Scholar]
- Vokey JR, Read DJ. Familiarity, memorability, and the effect of typicality on the recognition of faces. Memory & Cognition. 1992;20:291–302. doi: 10.3758/bf03199666. [DOI] [PubMed] [Google Scholar]
- Wickham LHV, Morris PE. Attractiveness, distinctiveness, and recognition of faces: Attractive faces can be typical or distinctive but are not better recognized. The American Journal of Psychology. 2003;116:455–468. [PubMed] [Google Scholar]
- Winkielman P, Cacioppo JT. Mind at ease puts a smile on the face: Psychophysiological evidence that processing facilitation leads to positive affect. Journal of Personality and Social Psychology. 2001;81:989–1000. [PubMed] [Google Scholar]
- Winkielman P, Halberstadt J, Fazendeiro T, Catty S. Prototypes are attractive because they are easy on the mind. Psychological Science. 2006;17:799–806. doi: 10.1111/j.1467-9280.2006.01785.x. [DOI] [PubMed] [Google Scholar]
- Yao D. A method to standardize a reference of scalp EEG recordings to a point at infinity. Physiological Measurement. 2001;22:693–711. doi: 10.1088/0967-3334/22/4/305. [DOI] [PubMed] [Google Scholar]
- Yin RK. Looking at upside-down faces. Journal of Experimental Psychology. 1969;81:141–145. [Google Scholar]
Associated Data
This section collects any data citations, data availability statements, or supplementary materials included in this article.