

Abstract
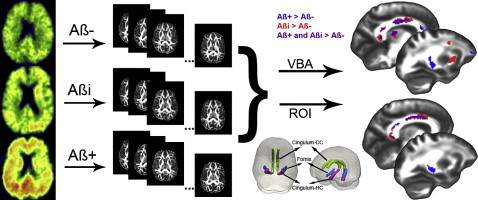
Some cognitively healthy individuals develop brain amyloid accumulation, suggestive of incipient Alzheimer's disease (AD), but the effect of amyloid on other potentially informative imaging modalities, such as Diffusion Tensor Imaging (DTI), in characterizing brain changes in preclinical AD requires further exploration. In this study, a sample (N = 139, mean age 60.6, range 46 to 71) from the Wisconsin Registry for Alzheimer's Prevention (WRAP), a cohort enriched for AD risk factors, was recruited for a multimodal imaging investigation that included DTI and [C-11]Pittsburgh Compound B (PiB) positron emission tomography (PET). Participants were grouped as amyloid positive (Aβ+), amyloid indeterminate (Aβi), or amyloid negative (Aβ−) based on the amount and pattern of amyloid deposition. Regional voxel-wise analyses of four DTI metrics, fractional anisotropy (FA), mean diffusivity (MD), axial diffusivity (Da), and radial diffusivity (Dr), were performed based on amyloid grouping. Three regions of interest (ROIs), the cingulum adjacent to the corpus callosum, hippocampal cingulum, and lateral fornix, were selected based on their involvement in the early stages of AD. Voxel-wise analysis revealed higher FA among Aβ+ compared to Aβ− in all three ROIs and in Aβi compared to Aβ− in the cingulum adjacent to the corpus callosum. Follow-up exploratory whole-brain analyses were consistent with the ROI findings, revealing multiple regions where higher FA was associated with greater amyloid. Lower fronto-lateral gray matter MD was associated with higher amyloid burden. Further investigation showed a negative correlation between MD and PiB signal, suggesting that Aβ accumulation impairs diffusion. Interestingly, these findings in a largely presymptomatic sample are in contradistinction to relationships reported in the literature in symptomatic disease stages of Mild Cognitive Impairment and AD, which usually show higher MD and lower FA. Together with analyses showing that cognitive function in these participants is not associated with any of the four DTI metrics, the present results suggest an early relationship between PiB and DTI, which may be a meaningful indicator of the initiating or compensatory mechanisms of AD prior to cognitive decline.
Abbreviations: DTI, Diffusion Tensor Imaging; PIB, Pittsburgh compound B; WRAP, Wisconsin Registry for Alzheimer's Prevention; FA, fractional anisotropy; MD, mean diffusivity; Da, axial diffusivity; Dr, radial diffusivity; APOE4, apolipoprotein E gene ε4; FH, (parental) family history; WM, white matter; GM, gray matter; Aβ+, amyloid positive; Aβi, amyloid indeterminate; Aβ−, amyloid negative; SPM, Statistical Parametric Mapping; FSL, FMRIB Software Library; PRELUDE, phase region expanding labeler for unwrapping discrete estimates; FUGUE, FMRIB's utility for geometrically unwarping EPIs; BET, Brain Extraction Tool; DTI-TK, Diffusion Tensor Imaging Toolkit; HARDI, high angular resolution diffusion imaging; DVR, distribution volume ratio; ICBM, International Consortium for Brain Mapping; ANTs, Advanced Normalization Tools; Cingulum–CC, cingulum adjacent to corpus callosum; Cingulum–HC, hippocampal cingulum (projecting to medial temporal lobe); PCC, posterior cingulate cortex; RAVLT, Rey Auditory Verbal Learning Test; TMT, Trail Making Test; ANCOVA, Analysis of Covariance; FWE, family wise error; WASI, Wechsler Abbreviated Scale of Intelligence; WRAT, Wide Range Achievement Test
Keywords: Alzheimer's disease, Amyloid imaging, AD risk, White matter
Graphical abstract
Highlights
-
•
Study cohort of preclinical subjects (N = 139) at risk for Alzheimer's disease
-
•
Examination of four DTI metrics in three groups based on global amyloid load
-
•
Greater amyloid load was associated with higher fractional anisotropy.
-
•
Diffusivity was negatively associated with amyloid in fronto-lateral gray matter.
-
•
DTI metrics were not correlated with cognition at this early disease stage.
1. Introduction
Amyloid deposition and changes in white matter (WM) microstructure have each been implicated in Alzheimer's disease (AD) using amyloid imaging with positron emission tomography (PET) and MRI diffusion-weighted imaging of cerebral microstructure, respectively. However, few studies have examined these imaging modalities in a multimodal framework and there is little knowledge about concurrent brain imaging features associated with amyloid burden in the important presymptomatic phase of sporadic AD. Such knowledge may improve the understanding of the temporal dynamics between these markers of brain health and may also improve the prediction of future disease.
Diffusion Tensor Imaging (DTI) is a potentially important tool for probing the effects of disease and aging on brain microstructure as it is highly sensitive to changes at the cellular and microstructural level. This study examined 4 different DTI measures: mean diffusivity (MD), fractional anisotropy (FA), axial (parallel) diffusivity (Da), and radial (perpendicular) diffusivity (Dr). MD is the average of the three diffusion tensor eigenvalues, the lengths of the three axes of the ellipsoid tensor, and is an inverse measure of membrane density and fluid viscosity in both gray and white matter. MD is sensitive to cellularity, edema, and necrosis (Alexander et al., 2011). FA is a scalar measure (ranging between 0 and 1) of the directional coherence of water diffusion and is considered to be highly sensitive to WM features including myelination, axonal degeneration, axonal packaging, and cytoskeletal features (Alexander et al., 2011; Beaulieu, 2002; Bendlin et al., 2010b). While FA is highly sensitive to various microstructural changes, it is relatively nonspecific; for instance, a decrease in FA could reflect either an increase in Dr or a decrease in Da. It has been suggested that Dr is more sensitive to WM demyelination or dysmyelination as well as changes in axonal diameter or density, whereas Da is more sensitive to axonal degeneration (Alexander et al., 2007, 2011).
Early studies investigating the relationship between WM and amyloid have used a combination of DTI and ex vivo histopathology. Both Song et al. (2004) and Sun et al. (2005) found a positive correlation between amyloid deposition and WM abnormalities indicative of greater myelin degeneration in mouse models. More recently, several studies in APP mice have demonstrated both increased and decreased FA and MD, suggesting a more complex relationship between amyloid and white matter (Muller et al., 2013; Qin et al., 2013; Shu et al., 2013; Zerbi et al., 2013). In human subjects, one study found opposite effects in FA and MD in presymptomatic compared to symptomatic subjects who harbored genetic mutations for early onset AD known to have considerable amyloid deposition (Ryan et al., 2013). Another study on older adults, with and without Mild Cognitive Impairment (MCI) and enriched with multiple vascular risk factors, found an association between amyloid and lower FA in fornix and corpus callosum (Chao et al., 2013). Further investigation of amyloid and white matter is needed in cohorts ranging in age, risk factors, AD profiles, and disease stages as well as in conjunction with other neuroimaging techniques. This study aims to fill this critical gap by employing multimodal imaging to investigate relationships between amyloid and WM in a relatively young, presymptomatic cohort at risk for sporadic AD. We expected that participants with more amyloid would present with white matter changes observed in later stages of AD: lower FA, higher MD, lower Da, and higher Dr.
It is also important to investigate if and how neuroimaging measures might relate to cognitive decline. Studies have reported dissociations between amyloid deposition and cognitive decline in healthy controls and subjects with MCI and AD (Jack et al., 2009) while others have found associations between amyloid burden and poorer cognitive performance (Kennedy et al., 2012; Rodrigue et al., 2012) and even changing associations based on the disease stage (Chetelat, 2013; Jack et al., 2009; Naslund et al., 2000; Villemagne et al., 2013). The potential predictive power of DTI on cognition has been less explored, but there is evidence that DTI values correlate with decline in working memory in healthy elderly (Bendlin et al., 2010a; Charlton et al., 2006; Pfefferbaum et al., 2000; Raz et al., 2010), and significant correlations between measures of white matter and AD symptom severity have been found, suggesting that measures of WM could be used to measure disease progression in the symptomatic phases of AD (Heo et al., 2009; Sexton et al., 2011). Recent publications using the same cohort as the present study revealed that amyloid is not associated with cognitive decline in these relatively young subjects (Johnson et al., 2014). More direct measures of neural integrity may be more strongly related to cognition. Therefore, this study aims to expand on the analyses by (Okonkwo et al. (in press)) and Johnson by testing the relationship between DTI measures and preclinical cognitive decline. We hypothesized that DTI metrics indicative of impaired white matter health would be positively related to poorer cognitive scores.
2. Material and methods
2.1. Participants
Participants were recruited from the Wisconsin Registry for Alzheimer's Prevention (WRAP), a well-characterized cohort of longitudinally-followed adults (Sager et al., 2005), via in-person invitations at their main WRAP study visit or by mail. The mean age was 60.6 (SD = 5.81) and 70.5% were female. One hundred and thirty-nine subjects were selected on the basis of having DTI and PiB scans within a 6-month time frame. The sample was enriched with participants who had parental family history of AD (66.9%) and possession of the epsilon4 allele of the apolipoprotein E gene (APOE4) (38.1%). Table 1 summarizes baseline characteristics of participants. Because it is possible that cognitive reserve might contribute to delayed or reduced incidence of AD (Scarmeas and Stern, 2004; Stern et al., 1999; Wilson et al., 2007), the three groups were also compared on three indicators of cognitive reserve measured at baseline: years of education, Wechsler Abbreviated Scale of Intelligence (WASI) vocabulary, and Wide Range Achievement Test (WRAT) reading. Groups did not significantly differ on these measures. The methods for determining family history of AD have been described previously (La Rue et al., 2008). The University of Wisconsin Institutional Review board approved all study procedures and each subject provided signed informed consent before participation.
Table 1.
Baseline characteristics of participants (n = 139)a.
| Demographic variable | Amyloid negative n = 59 | Amyloid indeterminate n = 53 | Amyloid positive n = 27 | p-Valueb |
|---|---|---|---|---|
| FH positive, % | 66.1 | 60.4 | 81.5 | 0.166 |
| APOE4 positive, % | 33.9 | 32.1 | 59.3 | 0.041 |
| Female, % | 61 | 75.5 | 81.5 | 0.094 |
| Age at PiB scan | 59.74 (5.95) | 60.06 (6.0) | 63.3 (4.32) | 0.021 |
| Education | 15.76 (2.37) | 16 (2.3) | 16.3 (2.45) | 0.617 |
| WASI vocabulary | 64.81 (7.76) | 66.87 (5.90) | 65.52 (5.77) | 0.271 |
| WRAT reading | 105.12 (11.09) | 108.70 (8.60) | 108.48 (7.56) | 0.106 |
FH = parental family history of Alzheimer's disease; APOE4 = the varepsilon 4 allele of the apolipoprotein E gene; PiB = Pittsburgh compound B.
All values are mean (SD) except where otherwise indicated.
Reported p-value is for omnibus test of group difference.
2.2. PET imaging and processing
2.2.1. PET-PiB
Subjects underwent [C-11]PiB PET scan and a 3.0 T MRI scan. Detailed methods for [C-11] PiB Radiochemical synthesis, PiB PET scanning, distribution volume ratio (DVR) map generation, and PiB visual rating have been described previously (Johnson et al., 2014). Briefly, after a 70 minute dynamic [C-11]PiB PET acquisition, PET data were reconstructed using a filtered back-projection algorithm (DIFT) and were corrected for random events, attenuation of annihilation radiation, deadtime, scanner normalization, and scatter radiation and were realigned and coregistered in SPM8 (www.fil.ion.ucl.ac.uk/spm). The data were then transformed into voxel-wise DVR maps of [C-11]PiB binding using the time activity curve in the gray matter (GM) of the cerebellum as the reference region.
After achieving high inter- and intra-reliability between two raters on a subset of images, a single rater visually rated the resulting DVR maps on the intensity and pattern of cortical amyloid binding using a method described previously (Johnson et al., 2014). Based on these ratings, subjects were classified into three categories: amyloid negative (Aβ−) subjects had no cortical amyloid burden or non-significant patchy or diffuse cortical GM binding not resembling AD pattern; amyloid indeterminate (Aβi) subjects had GM amyloid binding in at least three cortical lobes resembling an AD disease pattern but less intense than an overtly positive scan; and amyloid positive (Aβ+) subjects showed unambiguous positive amyloid binding in the cortex. Of the 139 subjects, 59 subjects were classified as Aβ−, 53 were Aβi, and 27 were Aβ+.
2.3. Magnetic resonance imaging and diffusion tensor image processing
2.3.1. DTI acquisition
Participants were imaged on a General Electric 3.0 T Discovery MR750 (Waukesha, WI) MRI system with an 8-channel head coil and parallel imaging with ASSET (R = 2). DTI was acquired using a diffusion-weighted, spin-echo, single-shot, echo planar imaging pulse sequence in 40 encoding directions, b-value = 1300 s/mm2, with eight non-diffusion-weighted (b = 0) reference images. The cerebrum was covered using contiguous 2.5 mm thick axial slices, FOV = 24 cm, TR = 8000 ms, TE = 67.8, matrix = 96 × 96, resulting in isotropic 2.5 mm3 voxels. High order shimming was performed prior to the DTI acquisition to optimize the homogeneity of the magnetic field across the brain and to minimize EPI distortions.
2.3.2. Image analysis
When conducting analyses across a large sample, it is critical to ensure accurate registration of individual brain imaging maps into a common space. In order to ensure the best possible methods, we employed a robust processing pipeline, based on methods in Zhang et al. (2007a).
First, head motion and image distortions (stretches and shears) due to eddy currents were corrected with affine transformation in the FSL (FMRIB Software Library) package (http://www.fmrib.ox.ac.uk/fsl/) and diffusion gradients were reoriented using the output transformations from the eddy correction in FSL. Geometric distortion from the inhomogeneous magnetic field applied was corrected with a B0 field map and PRELUDE (phase region expanding labeler for unwrapping discrete estimates) and FUGUE (FMRIB's utility for geometrically unwarping EPIs) from FSL. Brain tissue was extracted using FSL's BET (Brain Extraction Tool). Tensor fitting was performed using a nonlinear least squares method in CAMINO (http://cmic.cs.ucl.ac.uk/camino/).
2.3.3. Template creation
Individual maps were registered to a population specific template constructed using Diffusion Tensor Imaging Toolkit (DTI-TK) (http://www.nitrc.org/projects/dtitk/) which is an optimized DTI spatial normalization and atlas construction tool (Wang et al., 2011; Zhang et al., 2006, 2007b) that has been shown to perform superior registration compared to scalar based registration methods (Adluru et al., 2012). The template is constructed in an unbiased way that captures both the average diffusion features (e.g. diffusivities and anisotropy) and anatomical shape features (tract size) in the population (Zhang et al., 2007b). A subset of 77 diffusion tensor maps, from subjects that did not differ demographically from the main sample, was used to create a common space template. We chose to use a subset relatively free of the risk factors under study to avoid circularity and contamination of the template with underlying disease.
2.3.4. Spatial normalization
White matter alignment was performed using a diffeomorphic (topology preserving) registration method (Zhang et al., 2007a) that incrementally estimates the displacement field using a tensor-based registration formulation (Zhang et al., 2006). Tensor-based registration provides optimal alignment between subjects by taking advantage of similarity measures comparing whole tensors via explicit optimization of tensor reorientation (Alexander and Gee, 2000; Alexander et al., 2001). By computing image similarity on the basis of full tensor images rather than scalar features, the algorithm incorporates local fiber orientations as features to drive the alignment of individual white matter tracts. Using full-tensor information is highly effective in spatially normalizing tract morphology and tensor orientation, and enhances sensitivity to microstructural variations (Zhang et al., 2007a). All diffusion tensor maps were normalized to the template with rigid, affine, and diffeomorphic alignments and interpolated to 2 × 2 × 2 mm voxels. With DTI-TK, FA maps were calculated in the normalized space, while MD, λ1, λ2, and λ3 were calculated in native space then warped to the same normalized space as the FA maps with a 2 × 2 × 2 mm voxel dimension. The order of processing steps was slightly different because diffusivities, but not fractional anisotropy, are more accurate when calculated in native space prior to warping. Dr maps were calculated, (λ2 + λ3) / 2, using fslmaths and then FA, MD, Da (λ1), and Dr maps were smoothed using a 6 mm full width at half maximum Gaussian kernel in SPM8.
The Johns Hopkins International Consortium for Brain Mapping (ICBM) FA template was warped to the study's template space using Advanced Normalization Tools (ANTs) (Avants et al., 2011). ANTs was demonstrated to be among the most accurate intensity-based normalization methods among fourteen different methods (Klein et al., 2009).
2.4. Regions of interest
2.4.1. Regions of interest selection
Depicted in Fig. 1, the lateral fornix and two regions of the cingulum bundle, cingulum adjacent to the cingulate cortex (cingulum–CC) and cingulum bundle projections to the hippocampus (cingulum–HC), were selected as the three ROIs based on their previously described sensitivity to changes during MCI and AD, their role in various executive and memory functions, and connectivity to gray matter structures important for memory and executive functions that have been implicated in AD. Further discussion of the functional and clinical significance of these ROIs can be found in the first paragraphs of Section 4.
Fig. 1.
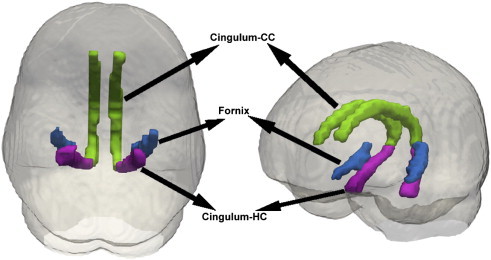
Regions of interest. The 3 ROIs assessed in this study are the cingulum-CC, which is the cingulum adjacent to the corpus callosum (green), the lateral fornix (blue), and the cingulum-HC, which is the part of the cingulum that extends from the posterior cingulum to the hippocampus (magenta).
The cingulum consists of white matter fibers connecting the hippocampus to posterior cingulate gyrus and prefrontal cortex. In this study, the cingulum–CC is identified as the portion of the cingulum that runs within the cingulate gyrus, traveling dorsally around the corpus callosum and then transitions to the cingulum–HC as it progresses from the splenium of the corpus callosum along the ventral surface of the hippocampus, terminating at entorhinal cortex. The fornix is a white matter tract that connects the hippocampus to the septal nuclei, ventral striatum, cingulate cortex, contralateral hippocampus, and mammillary bodies. Lateral fornix was selected due to its proximity to the hippocampus and connectivity to other regions affected in AD. It arises from the rostral entorhinal cortex and dorsal regions of the hippocampus and ends at the crus of the fornix.
2.4.2. Regions of interest construction
Using ANTs, the Johns Hopkins regions of interest (Wakana et al., 2004) were individually warped to the study's template space. The FA map for each subject in normalized template space was masked by the resulting FA ROIs, which were then thresholded at 0.2 to reduce inclusion of gray matter voxels in the white matter masks. The thresholded FA ROIs were binarized and then combined into a single mask used to isolate the white matter ROIs of each subject's standard space FA, MD, Da, and Dr.
2.5. Measures of cognitive decline
Cognitive measures of interest included the Rey Auditory Verbal Learning Test (RAVLT) and the Trail Making Test (TMT). The RAVLT, a widely used measure of learning and memory, is a word-list learning task in which 15 unrelated words are presented orally and the participant is asked to recall as many as he/she can. Higher scores on Trials 2–5 represent better learning ability (Trial 1 is a measure of immediate and working memory). Higher scores on Delayed Recall, the number of correctly recalled words after the 20-min delay, represent better long-term episodic memory recollection. The test is sensitive to memory system deficits in a variety of disorders (Lezak, 2004) and is sensitive to changes over time (Ivnik et al., 1990; Knight et al., 2007); as such, it can be useful for identifying cognitive decline or impairments resulting from neurological disorders and diseases.
TMT is one of the most commonly used neuropsychological tests in clinical practice (Rabin et al., 2005) and is highly sensitive to brain damage and progressive cognitive decline, even in early disease stages (Lezak, 2004). It is divided into Part A and Part B, both of which are reported as the number of seconds before task completion; thus higher scores are indicative of greater impairment (Gaudino et al., 1995). Part A involves drawing a line connecting numbers sequentially, while Part B involves connecting numbers and letters in an alternating spatial sequence (Lezak, 2004). Part B is more cognitively difficult than Part A and its set-switching component is thought to reflect executive functioning (Ashendorf et al., 2008; Hagen et al., 2014; Lezak, 1984). Average baseline and test scores from the study visit closest to the date of the PiB scan are presented in Table 2 but only Part B of TMT was entered into analyses, as it is considered a more representative indication of executive function.
Table 2.
Cognitive Testing Scores.
| Cognitive testa | Baseline score |
Visit test scoreb |
Difference scorec |
|||||||
|---|---|---|---|---|---|---|---|---|---|---|
| Mean | SD | Min | Max | Mean | SD | Min | Max | Min | Max | |
| RAVLT trials 2-5 | 41.6 | 5.9 | 29 | 55 | 42 | 6.3 | 25 | 57 | − 12 | 14 |
| RAVLT delayed recall | 10.3 | 2.7 | 3 | 15 | 10.6 | 2.6 | 3 | 15 | − 7 | 10 |
| TMT part A | 26.62 | 7.9 | 14 | 52 | 25.69 | 6.82 | 14 | 52 | − 21 | 15 |
| TMT part B | 62.2 | 19.4 | 31 | 134 | 61.7 | 20.7 | 32 | 165 | − 63 | 90 |
RAVLT = Rey Auditory Verbal Learning Test, TMT = Trail Making Test.
Test score on study visit closest to PiB scan.
Negative difference scores for TMT represent an improvement while positive scores represent a decline because the score is time to completion. Negative difference scores for RAVLT represent a decline while positive scores represent an improvement because the test is scored by the number of correct recalls, whereby more correct recalls implies better performance.
2.6. Statistical analyses
2.6.1. Imaging
Analyses of Covariance (ANCOVA) were conducted in SPM8 on DTI modalities where amyloid rating was the grouping variable. Separate analyses of covariance were performed for FA, MD, Da, and Dr in which the respective DTI maps were the dependent variable. Mean-centered age and sex were included as covariates because of the known or potential effects they might have on brain structure. Additionally, two binary variables, parental family history and APOE4 status, were included as covariates because amyloid groups differ significantly by APOE4 status (p = 0.041) and show trends for parental family history (p = 0.166).
First, we conducted voxel-wise analyses within 3 prespecified ROIs combined into a single search region: cingulum–CC, cingulum–HC, and fornix. Significance was inferred at the voxel peak-level when α < 0.05, corrected for the small volume of the combined ROI search space (Worsley et al., 1996) and multiple comparisons with family wise error (FWE) correction after initially passing a voxel level threshold of α < 0.005 together with a cluster extent > 20 voxels.
Next, exploratory whole-brain analyses were performed to investigate potential relationships between amyloid and DTI outside of the a priori ROIs. Due to the larger search region and to increase the anatomic plausibility of our results, we used a cluster extent threshold of > 50 contiguous voxels and an initial voxel level threshold of α < 0.001. Significance was inferred at the cluster-level when α < 0.05 after the FWE correction for multiple comparisons. Analyses were restricted to the cerebrum because PiB-DVR maps were scaled by the cerebellum. For FA, Dr, and Da analyses, where the meaningful signal is only present in white matter, inference was constrained to white matter using a mask derived from a 0.2 threshold of the combined average FA map of the sample-specific template and p-values were subsequently corrected for the volume of this derived search space.
In some instances, where deemed informative, uncorrected p-values are also reported in addition to the FWE corrected p-values. For each model, we report the results of univariate tests where the omnibus ANOVA was significant.
Regions that were significantly different in gray matter (MD only) were masked to create a binary ROI. PiB DVR values were extracted from the PiB scans within this ROI. Nonparametric correlational analyses were performed in SPSS on PiB and MD, where the MD signal was meaningfully different.
2.6.2. Cognitive decline
Cognitive decline was quantified by difference scores calculated by subtracting the score from the WRAP visit closest to the PiB scan from their baseline score 4 to 8 years prior. The average interval between PiB scan and cognitive testing was 193.41 days (SD 180.20). Seven subjects had not yet returned for their second WRAP visit and two had missing data for TMT and so 9 subjects were excluded from this part of the analysis. Because the follow-up interval varied (depending on how long the subject had participated in the WRAP study prior to the imaging substudy), interval length was included as a covariate in this analysis, as well as baseline score to account for individual differences not related to cognitive decline. Demographic variables have been shown to significantly affect performance on RAVLT (Lezak, 2004; Schmidt, 1996) and TMT (Ashendorf et al., 2008; Lezak, 2004); therefore, the most notably influential demographic variables, age, sex, and education, were also included as covariates.
For each cognitive measure, difference scores were entered into a regression analysis in SPM8 as the independent variable and the four DTI maps (FA, MD, Da, and Dr) were separately analyzed as the dependent variable. The same WM mask described in Section 2.6.1 was applied to FA, Da, and Dr maps and FWE correction was limited to this search region. We used a cluster extent threshold of > 50 contiguous voxels and an initial voxel level threshold of α < 0.001. Significance was inferred at the voxel peak-level if α < 0.05 after FWE correction. We predicted that associations, if any, would be small because most subjects are asymptomatic.
3. Results
3.1. Baseline characteristics
Groups differed significantly on APOE4 positivity (p = 0.041) and age at scan (p = 0.021) but not family history (p = 0.166) or sex (p = 0.094). Groups also did not differ on education (p = 0.617), WASI vocabulary (p = 0.271), or WRAT reading (p = 0.106). Possible risk factors (APOE4 positivity, FH, age, and education) were included as covariates, and thus are unlikely to be associated with the observed outcome (DTI).
3.2. Region of interest
3.2.1. Fractional anisotropy
Results are summarized in Table 3 and depicted in Fig. 2. Higher FA was found in Aβ+ compared to Aβ− in the right medial cingulum, right posterior cingulum, and left lateral fornix. Trends, which were significant in the absence of correction for multiple comparisons, were observed in the right fornix, left hippocampal cingulum, and left medial cingulum. Significantly higher FA was found in Aβi compared to Aβ− in the right medial cingulum and right posterior cingulum. A trend was observed in the left medial cingulum. There were no significant findings for higher FA in groups with less amyloid compared to groups with higher amyloid burden.
Table 3.
Summary of ROI resultsa.
| DTI metric | Group comparison | Region | T-statistic | p(FWE)b | p(uncorr)c |
|---|---|---|---|---|---|
| FA | Aβ + > Aβ − | Medial cingulum (R) | 4.80 | 0.003 | 0.000 |
| Fornix (L) | 4.16 | 0.030 | 0.000 | ||
| Posterior cingulum (R) | 4.10 | 0.036 | 0.000 | ||
| Fornix (R) | 3.81 | 0.092 | 0.000 | ||
| Hippocampal cingulum (L) | 3.69 | 0.131 | 0.000 | ||
| Medial cingulum (L) | 3.65 | 0.144 | 0.000 | ||
| Posterior cingulum (L) | 3.55 | 0.193 | 0.000 | ||
| Aβi > Aβ − | Medial cingulum (R) | 4.56 | 0.007 | 0.000 | |
| Posterior cingulum (R) | 4.45 | 0.011 | 0.000 | ||
| Medial cingulum (L) | 3.62 | 0.158 | 0.000 |
Atrophy correction did not change the overall pattern of results. Atrophy-corrected data are presented in Inline Supplementary Table S1.
FWE = family wise error correction for multiple comparisons.
p(uncorr) = p-value uncorrected for multiple comparisons.
Fig. 2.
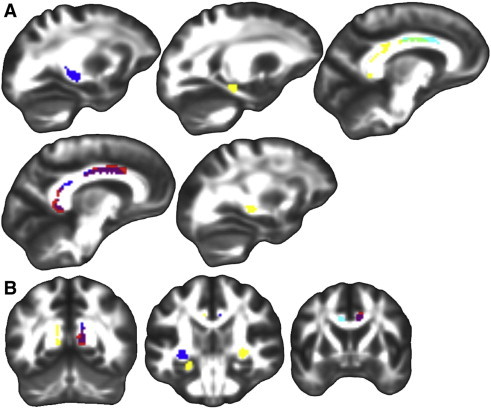
Fractional anisotropy group differences in ROIs. Significant group differences in fractional anisotropy within the three ROIs displayed on FSL's FMRIB58_FA template transformed to this study's population space. Regions where Aβ + had significantly higher FA than Aβ − (p(FWE) < .05, blue), Aβi had significantly higher FA than Aβ − (p(FWE) < .05, red), both Aβ + and Aβi had significantly higher FA than Aβ − (p(FWE) < .05, purple), Aβ + showed a trend of higher FA compared to Aβ − (p(uncorr) < .001, yellow), Aβi showed a trend of higher FA compared to Aβ − (p(uncorr) < .001, cyan), and both Aβ + and Aβi showed a trend of higher FA compared to Aβ − (p(uncorr) < .001, light green). A.) Sagittal slices from left to right. B.) Coronal slices from posterior to anterior. Left is on the left.
3.2.2. Mean, axial, and radial diffusivity
Mean and component diffusion measures did not differ significantly between the three PiB groups for the three ROI's considered.
3.3. Whole brain
Results for whole brain analyses are summarized in Table 4.
Table 4.
Summary of whole brain resultsb.
| Whole brain analyses | ||||
|---|---|---|---|---|
| DTI metric | Group comparison | Significant region | Cluster size | p(FWE)a |
| FA | Aβ + > Aβ − | Superior longitudinal fasciculus (right) | 284 | 0.000 |
| Corpus callosum, genu | 352 | 0.000 | ||
| Corpus callosum, body | 144 | 0.002 | ||
| Inferior longitudinal fasciculus (right) | 421 | 0.000 | ||
| Posterior corona radiata (left) | 357 | 0.000 | ||
| Fornix (left) | 102 | 0.011 | ||
| Aβi > Aβ − | Superior corona radiata (left) | 134 | 0.003 | |
| External capsule (left) | 81 | 0.028 | ||
| Cingulate-CC (right) | 138 | 0.002 | ||
| Corpus callosum, splenium | 217 | 0.000 | ||
| Corpus callosum, body | 86 | 0.022 | ||
| Corpus callosum, genu | 80 | 0.030 | ||
| Thalamus (right) | 108 | 0.008 | ||
| MD | Aβ − > Aβ + | Fronto-lateral GM (right) | 157 | 0.024 |
p(FWE) = p-value after family wise error correction for multiple comparisons.
Atrophy correction did not change the overall pattern of results. Atrophy-corrected data are presented in Inline Supplementary Table S2.
3.3.1. Fractional anisotropy
Aβ+ exhibited higher FA compared to Aβ− in the right superior longitudinal fasciculus, right inferior longitudinal fasciculus, genu and body of the corpus callosum, left posterior corona radiata, and left fornix. Aβi exhibited greater FA than Aβ− in the left superior corona radiata, left external capsule, right thalamus, and the genu, body, and splenium of the corpus callosum. Results are displayed in Fig. 3. Again, no significant findings were observed for higher FA in groups with less amyloid compared to groups with greater amyloid.
Fig. 3.
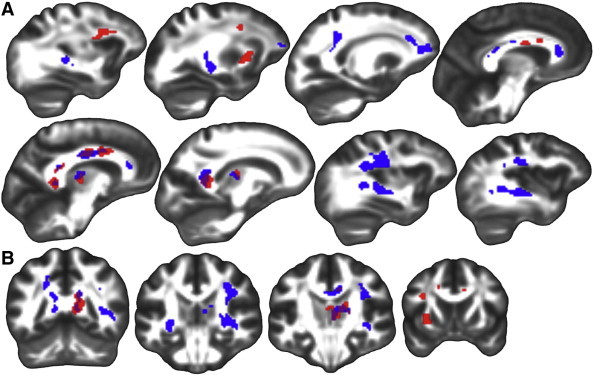
Fractional anisotropy whole-brain group differences. Significant group differences (p(FWE) < .05) from whole-brain analyses in FA displayed on FSL's FMRIB58_FA template transformed to this study's population space. Regions where Aβ + had higher FA than Aβ − (blue), Aβi had higher FA than Aβ − (red), and both Aβ + and Aβi had higher FA than Aβ − (purple). A.) Sagittal slices from left to right. B.) Coronal slices from posterior to anterior. Left is on the left.
3.3.2. Mean diffusivity
Mean diffusion was higher in Aβ− compared to Aβ+ in the right fronto-lateral GM. Results are displayed in Fig. 4.
Fig. 4.
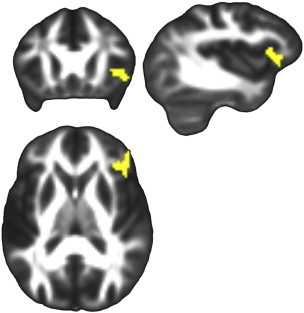
Mean diffusivity whole-brain group differences. Significant group differences from whole-brain analyses in MD displayed on FSL's FMRIB58_FA template transformed to this study's population space. Higher mean diffusivity was observed in Aβ − compared to Aβ + sin fronto-lateral GM, p(FWE) = 0.024. Left is on the left.
Nonparametric correlation analyses revealed a moderate negative correlation (spearman coefficient: − 0.392) between PiB DVR values and MD values in this significant cluster (Fig. 5).
Fig. 5.
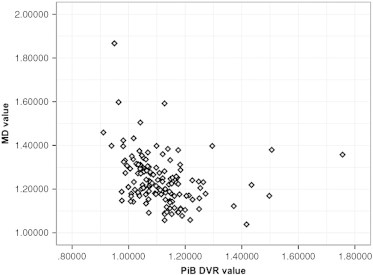
Mean diffusivity and PiB DVR correlation. Moderate correlation between PiB DVR and MD from the significant MD cluster from Table 4 and Fig. 4. Spearman coefficient = − 0.392.
3.3.3. Axial and radial diffusivity
Whole brain analyses revealed no significant differences in white matter between the three PiB groups for Da or Dr.
3.4. Cognitive decline and DTI
A voxel based regression in SPM revealed that cognitive change over a preceding epoch, as measured by difference scores on three cognitive testing measures, cannot be explained by the observed fractional anisotropy or the three measures of diffusion in this preclinical cohort.
4. Discussion
Amyloid is observable in ostensibly normal subjects, but the co-occurring anatomical imaging features have not been well characterized and require multimodal investigations. A more thorough understanding of the relationship between amyloid and white matter will improve upon current models of AD and could provide insight into mechanisms leading to cognitive decline, such as amyloid-induced axonal or myelin changes. Results from this study revealed patterns of higher FA throughout the brain and lower MD in lateral frontal gray matter in subjects with greater and more diffuse amyloid deposition. Higher FA was observed in the right medial and posterior cingulum and left fornix, with trends in the left medial and hippocampal cingulum and right fornix, in Aβ+ compared to Aβ−, and in the right medial and posterior cingulum, with a trend in the left medial cingulum, in Aβi compared to Aβ−. Whole brain analyses were consistent with the pattern observed in the ROI analyses, revealing higher FA in Aβ+ or Aβi compared to Aβ− in regions including the right superior and inferior longitudinal fasciculi, corpus callosum, external capsule, superior and posterior corona radiata, and thalamus. Additionally, MD revealed higher diffusion in Aβ− compared to Aβ+ in right fronto-lateral GM.
ROI analyses focused on regions most likely to be affected in various AD disease stages and were chosen based on structural and functional connections between regions involved in executive function and memory and that have been shown to be affected in AD. The cingulum bundle has been shown to play an important role in memory function (Wu et al., 2010) and to be particularly susceptible to abnormalities in AD (Liu et al., 2011; Teipel et al., 2007), early AD (Villain et al., 2008), MCI (Chua et al., 2008), and even in asymptomatic participants with a family history of AD (Bendlin et al., 2010b). A recent meta-analysis described white matter damage in the posterior cingulum with a medium effect size in MCI and large effect size in AD (Sexton et al., 2011).
Volume decreases of the fornix have been demonstrated in AD (Copenhaver et al., 2006) and damage to the fornix has been shown to be associated with memory deficits (Gaffan and Gaffan, 1991). Altered DTI measures in the fornix have been demonstrated in MCI and AD (Liu et al., 2011; Mielke et al., 2009; Teipel et al., 2007) and even in preclinical and presymptomatic individuals with familial Alzheimer's disease mutations (Ringman et al., 2007). Oishi et al. (2012) observed that FA of the fornix predicted conversion from cognitive normalcy to MCI and from MCI to AD in a study sample, suggesting that DTI, especially FA, is a promising modality for preclinical AD identification and for AD progression (Oishi et al., 2012; Wu et al., 2010).
Both the cingulum and fornix have primary connections with posterior cingulate cortex (PCC) and the hippocampus. Although the hippocampus remains relatively free of Aβ deposition (Fein et al., 2008), hippocampal atrophy is a common occurrence in various stages of AD and this atrophy has been shown to mediate an inverse relationship between PiB and episodic memory in MCI and AD (Mormino et al., 2008). Altered cortico-hippocampal connections, such as the cingulum and fornix, could underlie these associations. The PCC, on the other hand, is one of the most common sites of amyloid deposition, observable even at presymptomatic and early disease stages (Johnson et al., 2014; Kemppainen et al., 2006; Leech and Sharp, 2014; Ziolko et al., 2006).
Both the ROI analyses and whole-brain results are in contradistinction to effects observed in the literature at later symptomatic stages of AD and MCI, where decreased FA and increased MD are the norm, likely reflecting degeneration and loss of integrity of cellular structures (Bozzali and Cherubini, 2007; Chua et al., 2008; Nir et al., 2013). Indeed, decreased FA and increased MD are hallmark features of most neurodegenerative and neurological disorders. However, there are several exceptions to this rule. Decreased MD has been observed in basal ganglia and striatum in Creutzfeldt–Jakob disease (Fujita et al., 2008; Horsfield and Jones, 2002), while increased FA has been observed in group studies of multiple sclerosis in thalamus and basal ganglia (Ciccarelli et al., 2001; Hannoun et al., 2012; Tovar-Moll et al., 2009), superior longitudinal fasciculus in Williams Syndrome (Hoeft et al., 2007), genu in bipolar disorder (Yurgelun-Todd et al., 2007), and postcentral gyri, amygdalae, hippocampi, superior frontal gyri, and anterior cingulate in fibromyalgia (Lutz et al., 2008).
Several recent DTI studies in mouse models of AD have found increased FA in regions including the cingulate, striatum, thalamus, hippocampus, corpus callosum, anterior commissure, internal capsule, septal nuclei, caudate, putamen, fimbria, right piriform cortex, hypothalamus, and external capsule (Muller et al., 2013; Qin et al., 2013; Shu et al., 2013; Zerbi et al., 2013). Abnormal maturation of fibers, myelin degeneration in non-coherently aligned fiber structures, complex nuclei structure, loss of isotropic cells, decreased proportion of unmyelinated fibers, and prevalent crossing fibers were cited as possible explanations for these observed effects. Two of these studies also found decreased MD in the lateral septal nucleus area, dorsal hippocampus, amygdala, and internal capsule (Muller et al., 2013), and corpus callosum and external capsule (Zerbi et al., 2013). Post-DTI histological analyses in some of these studies demonstrated axon loss, swollen axons (Qin et al., 2013), damage to axons and dendrites (Shu et al., 2013), and little to no effects on myelination (Qin et al., 2013; Zerbi et al., 2013) or differences in the amount of nerve fibers (Zerbi et al., 2013). Histology also revealed neuronal loss (Qin et al., 2013; Shu et al., 2013; Zerbi et al., 2013), amyloid deposits (Qin et al., 2013; Shu et al., 2013), swollen neuronal processes (Qin et al., 2013; Shu et al., 2013), pathological neurons (Shu et al., 2013), microgliosis, astrocyte hypertrophy, dilated perivascular space, and neural apoptosis (Qin et al., 2013).
One potential explanation for the observed association between PiB and FA in this study is amyloid-associated axonal degeneration of select white matter regions, namely in regions where fibers cross. Areas of the brain with considerable fiber crossing have correspondingly low FA (Alexander et al., 2007, 2011); therefore higher FA could reflect a decrease in the complexity of constituent voxels from crossing fibers, resulting in stronger voxel level signal, presumably from more homogeneity in the underlying fiber orientation. DTI cannot truly characterize parallel and perpendicular diffusions at regions with multiple fiber populations, which could explain why significant differences were not observed for Da or Dr. Douaud et al. (2011) found that the only white matter region showing abnormalities between MCI patients and healthy subjects was a region of crossing fibers in the centrum semiovale, which showed increased anisotropy, possibly due to a relative preservation of motor-related projection fibers that cross the affected association fibers of the superior longitudinal fasciculus. Using tractography, Zerbi et al. (2013) found that tracts resulting from seed voxels of higher FA in transgenic mice did not form coherent fiber bundles, but rather showed marked colocalization with crossing fibers. Ryan et al. (2013) found that reduced GM volume in the caudate and thalamus were accompanied by increased FA in autosomal dominantly inherited mutation carriers that were presymptomatic compared to widespread decreased FA in symptomatic mutation carriers. They postulated that this increase in FA in presymptomatic at-risk individuals was likely due to a decrease in crossing fibers and selective degeneration of short interneurons with the relative sparing of long projection neurons. Future studies should combine DTI with high angular resolution diffusion imaging (HARDI), which uses 40 or more diffusion directions, to help resolve fiber orientation limitations and improve interpretations of DTI metrics in regions suspected to contain crossing fibers (Alexander et al., 2011; Tournier et al., 2008; Tuch et al., 2002).
All subjects in this study were cognitively normal. Both brain reserve, which refers to intrinsic differences in brain structures, and cognitive reserve, which refers to adaptive cognitive strategies and efficient utilization of neural networks, could facilitate resilience against cognitive decline despite pathological burden (Brickman et al., 2011; Jicha and Rentz, 2013). It is therefore possible that higher FA and lower MD reflect greater brain reserve, which might be complemented by or a manifestation of cognitive reserve. Although the three PiB groups did not significantly differ on the three surrogate measures of cognitive reserve (years of education, WRAT reading, or WASI vocabulary), both Aβ+ and Aβi had higher scores compared to Aβ− on all three measures, which is the same pattern observed in the ROI and whole brain analyses of FA. Longitudinal studies will be critical in understanding the complementary or separable roles of cognitive reserve and brain reserve in resilience to Alzheimer's pathology and disease progression.
Unique patterns before and after symptom onset suggest that a gradual progression to AD is occurring whereby different stages of disease progression could be detected by the non-linear relationship between PiB and DTI. Longitudinal measurements in these subjects are planned, which should be informative about the temporal relationship between amyloid burden and white matter change. It is also possible that these unique multimodal relationships pre- and post-symptom onset are indicative of dissociable processes responsible for disease initiation compared to those underlying cognitive decline observed in later disease stages. Future studies at both the cellular and systems levels will be necessary to further explore these theories of disease progression.
Compensatory glial activation in response to neurotoxic effects of amyloid could also account for both the observed increase in FA and decrease in MD in more amyloid positive subjects. Glial activity is a common response to inflammation and other forms of neuronal stress (Jauregui-Huerta et al., 2010). Recent histopathological evidence shows that the presence of amyloid-β accompanied by robust glia activation, but not amyloid-β in the absence of glia activation, differentiates brains of subjects with AD from brains of non-demented subjects with amyloid deposition (Perez-Nievas et al., 2013). Similarly, a study using a triple transgenic mouse model of AD demonstrated an increase in the density of resting microglia preceding neuritic plaque formation and activation of microglia by accumulation of extracellular Aβ (Rodríguez et al., 2010). Another study found that subjects with AD exhibited 20–35% increases in microglia activation, as measured by [11C](R)PK11195-PET, compared to healthy controls and that the levels of cortical microglial activation, but not amyloid load, were correlated with MMSE scores in AD subjects (Edison et al., 2008).
Oligodendrocyte precursor cells which give rise to oligodendrocytes, the cells primarily responsible for axonal myelination and remyelination in the central nervous system, are activated by injury-induced changes or disturbances in tissue homeostasis detected by microglia and astrocytes (Franklin and Ffrench-Constant, 2008). Increased oligodendritic activation and corresponding increased myelination could increase FA. Although voxel-based analyses of Da and Dr were not significant, these measures can still provide insight into the interpretation of these findings. To further probe these measures, effect size was calculated for FA, Da, and Dr by extracting the DTI metric value from each significant cluster from the ROI analysis, correcting these values for the same covariates used in the voxel-based statistics, and calculating Cohen's d from the unstandardized residuals (Cohen's d = M1 − M2 / spooled where spooled = √[(s12 + s22) / 2]) for each comparison of interest. A table of effect sizes for FA, Da, and Dr can be found in Inline Supplementary Table S3. For all five clusters, Dr had a larger effect than Da and was negative. This suggests that higher FA in subjects with greater amyloid burden is driven by lower Dr, indicative of less dysmyelination (or greater myelination) or changes in axonal diameter or density, lending evidence to the oligodendrocyte theory. However, because Da and Dr were not significant at the voxel-wise level, these results should be interpreted with circumspection. Future studies using specific measurements of glial activation, such as through PET compounds that bind different types of glia, as well as histopathological and in vivo measurements of myelin, such as bound pool fractions (Stikov et al., 2011), in various stages of AD can further investigate this theory.
Inline Supplementary Table S3.
Table S3.
Effect sizes of Fa, Da, and Dr in significant clusters from the ROI analysisa.
| Group contrast | Significant cluster | FA | Da | Dr |
|---|---|---|---|---|
| Aβi > Aβ− | Right medial cingulum (p = 0.007) | 0.525897407 | − 0.194974545 | − 0.205565248 |
| Right posterior cingulum (p = 0.011) | 0.652991784 | − 0.205565903 | − 0.509913831 | |
| Aβ+ > Aβ− | Right medial cingulum (p = 0.003) | 0.400883593 | 0.081314997 | − 0.273506761 |
| Left fornix (p = 0.030) | 0.439366194 | − 0.123822204 | − 0.346614363 | |
| Right posterior cingulum (p = 0.036) | 0.549163898 | 0.088696727 | − 0.273506761 |
Values are Cohen's d. d > 0.2 constitutes a small effect size, d > 0.5 constitutes a medium effect size, and d > 0.8 constitutes a large effect size.
Oligodendrocyte precursor cells which give rise to oligodendrocytes, the cells primarily responsible for axonal myelination and remyelination in the central nervous system, are activated by injury-induced changes or disturbances in tissue homeostasis detected by microglia and astrocytes (Franklin and Ffrench-Constant, 2008). Increased oligodendritic activation and corresponding increased myelination could increase FA. Although voxel-based analyses of Da and Dr were not significant, these measures can still provide insight into the interpretation of these findings. To further probe these measures, effect size was calculated for FA, Da, and Dr by extracting the DTI metric value from each significant cluster from the ROI analysis, correcting these values for the same covariates used in the voxel-based statistics, and calculating Cohen's d from the unstandardized residuals (Cohen's d = (M1 − M2) / spooled where spooled = √[(s12 + s22) / 2] for each comparison of interest. A table of effect sizes for FA, Da, and Dr can be found in Inline Supplementary Table S3. For all five clusters, Dr had a larger effect than Da and was negative. This suggests that higher FA in subjects with greater amyloid burden is driven by lower Dr, indicative of less dysmyelination (or greater myelination) or changes in axonal diameter or density, lending evidence to the oligodendrocyte theory. However, because Da and Dr were not significant at the voxel-wise level, these results should be interpreted with circumspection. Future studies using specific measurements of glial activation, such as through PET compounds that bind different types of glia, as well as histopathological and in vivo measurements of myelin, such as bound pool fractions (Stikov et al., 2011), in various stages of AD can further investigate this theory.
Inline Supplementary Table S3 can be found online at http://dx.doi.org/10.1016/j.nicl.2014.02.001.
An amyloid-induced inflammatory response and resultant glial activation and accumulation could be responsible for restricted diffusion, especially since the observed MD effect occurred in gray matter, where amyloid is present. Diffusion experiments accompanied by immunostaining for glial markers in rat cortex have shown that hypertrophy and increased glial processes during gliosis impair diffusion due to the induction of additional diffusion barriers (Roitbak and Sykova, 1999). Similar to our findings, Ryan et al. found increased MD in symptomatic mutation carriers, as expected, but decreased MD in the right hippocampus as well as trends in other subcortical structures in presymptomatic mutation carriers (Ryan et al., 2013). They postulated that early pathological changes such as microglial activation or accumulation and swelling of neurons and glia might precede neurodegeneration. If reduced MD is indeed a reflection of increased glial activation, lower MD during the asymptomatic phase could be one of the earliest biomarkers for identifying subjects who will progress to dementia, as glial activation has been shown to differentiate subjects with AD from cognitively healthy subjects with AD-like pathology (Perez-Nievas et al., 2013). Alternatively, glial activation at this early stage, compared to symptomatic phases, could be a neuroprotective mechanism that incurs resilience to cognitive decline. In vivo measures of glial activation as well as longitudinal studies are crucial for further exploration of these theories, and are currently being pursued.
Amyloid, even in the absence of gliosis, could impede diffusion, resulting in lower MD. Increased diffusivity is usually explained by loss of neurons and brain atrophy. However, at the earliest stages of the disease, Aβ might not yet be neurotoxic and thus is not associated with significant neuronal death or atrophy. Amyloid that hinders and restricts diffusion, in the absence of neuronal injury, would result in reduced apparent diffusivity (Alexander et al., 2007). Mueggler et al. (2004) found reduced diffusivity in neocortex of APP23 transgenic mice that was accompanied by fibrillar amyloid deposits and associated gliosis, suggesting that extracellular deposition of fibrillar amyloid and/or associated glial proliferation restrict diffusion. Still, the contribution of Aβ plaques to diffusional changes remains controversial (Thiessen et al., 2010). To investigate this theory in the present study, nonparametric correlations were performed on the PiB signal and MD value from the region with significant differences in MD. This analysis revealed a moderate negative correlation (spearman coefficient: − 0.392) between PiB DVR values and MD values in that fronto-lateral GM region, lending evidence to this theory of amyloid-impeded diffusion. Longitudinal studies will be important for determining the point at which neuronal death, rather than impeded amyloid and/or gliosis, becomes the determinant of diffusivity measures, a potentially important phase of disease progression.
Partial volume effects on DTI can be substantial when subjects in one group are likely to be more atrophic than the other group. This can be partially compensated for by including an independent measure of brain atrophy as a covariate in the statistical analysis (Jones and Cercignani, 2010). The subjects in this study are relatively young and prior analyses have not shown cross-sectional differences in volume between the three groups (Johnson et al., 2013) indicative of volume loss, suggesting that not much atrophy is yet occurring. To be assured that atrophy was not driving our results, analyses were repeated with an additional covariate, supratentorial parenchymal volume. Indeed, atrophy correction did not change the overall pattern of results. The atrophy-corrected data are presented in Inline Supplementary Tables S1 and S2.
Inline Supplementary Table S1.
Table S1.
Summary of ROI results with atrophy correction.
| DTI metric | Group comparison | Region | T-statistic | p(FWE)a | p(uncorr)b |
|---|---|---|---|---|---|
| FA | Aβ+ > Aβ− | Medial cingulum (R) | 4.75 | 0.004 | 0.000 |
| Fornix (L) | 4.21 | 0.026 | 0.000 | ||
| Posterior cingulum (R) | 3.94 | 0.062 | 0.000 | ||
| Fornix (R) | 3.64 | 0.111 | 0.000 | ||
| Hippocampal cingulum (L) | 3.85 | 0.056 | 0.000 | ||
| Medial cingulum (L) | 3.27 | 0.372 | 0.001 | ||
| Posterior cingulum (L) | 3.37 | 0.301 | 0.000 | ||
| Aβi > Aβ− | Medial cingulum (R) | 4.42 | 0.012 | 0.000 | |
| Posterior cingulum (R) | 4.20 | 0.027 | 0.000 | ||
| Medial cingulum (L) | 3.28 | 0.369 | 0.001 |
FWE = family wise error correction for multiple comparisons.
p(uncorr) = p-value uncorrected for multiple comparisons.
Inline Supplementary Table S2.
Table S2.
Summary of whole brain results with atrophy correction.
| Whole brain analyses | ||||
|---|---|---|---|---|
| DTI metric | Group comparison | Significant region | Cluster Size | p(FWE)a |
| FA | Aβ+ > Aβ− | Superior longitudinal fasciculus (right) | 262 | 0.000 |
| Corpus callosum, genu | 299 | 0.000 | ||
| Corpus callosum, body | 121 | 0.005 | ||
| Inferior longitudinal fasciculus (right) | 262 | 0.000 | ||
| Fornix (left) | 71 | 0.045 | ||
| Posterior cingulate (right) | 166 | 0.001 | ||
| Thalamus (right) | 80 | 0.029 | ||
| Superior corona radiata (left) | 108 | 0.008 | ||
| Aβi > Aβ− | External capsule (left) | 88 | 0.020 | |
| Posterior cingulum (right) | 122 | 0.004 | ||
| Corpus callosum, body | 122 | 0.058 | ||
| Thalamus (right) | 65 | 0.061 | ||
| Fronto-lateral GM (right) | 145 | 0.033 | ||
| MD | Aβ− > Aβ+ | Fronto-lateral GM (right) | 145 | 0.033 |
p(FWE) = p-value after family wise error correction for multiple comparisons.
Partial volume effects on DTI can be substantial when subjects in one group are likely to be more atrophic than the other group. This can be partially compensated for by including an independent measure of brain atrophy as a covariate in the statistical analysis (Jones and Cercignani, 2010). The subjects in this study are relatively young and prior analyses have not shown cross-sectional differences in volume between the three groups (Johnson et al., 2014) indicative of volume loss, suggesting that not much atrophy is yet occurring. To be assured that atrophy was not driving our results, analyses were repeated with an additional covariate, supratentorial parenchymal volume. Indeed, atrophy correction did not change the overall pattern of results. The atrophy-corrected data are presented in Inline Supplementary Tables S1 and S2.
Inline Supplementary Tables S1 and S2 can be found online at http://dx.doi.org/10.1016/j.nicl.2014.02.001.
Most participants in this study are essentially asymptomatic, which may underlie the lack of relationship between cognitive decline and the DTI metrics assessed in this study. Prior work from our group (Bendlin et al., 2010a) and others (Madden et al., 2009; O'Sullivan et al., 2001; Raz et al., 2010; Sullivan et al., 2010) has found a relationship between cognitive function, particularly processing speed measures, and white matter microstructure, but there is a paucity of longitudinal work. One possibility is that while single-time point measures of white matter microstructure are related to cognitive function across a group, significant individual changes in cognition are more likely to be observed after more advanced neuronal damage has occurred. Longitudinal follow-ups with these subjects will be better suited to address early mechanisms of cognitive decline.
5. Limitations
Several limitations have been brought up in the above discussion including the difficulty in interpretation of DTI findings at regions of crossing fibers, the lack of longitudinal clinical outcomes in this ongoing study, and no direct in vivo measurements of gliosis. Additionally, the nature of this study does not allow for histopathology, which could help to corroborate and interpret the neuroimaging findings, which are only indirect measurements of brain features.
6. Conclusions
Patterns between amyloid and DTI metrics that differ markedly from later disease stages in MCI and AD provide evidence for a gradual progression from asymptomatic to symptomatic disease states, as well as the potential for unique mechanisms underlying the initiation of the disease compared to those resulting in cognitive decline. Molecular mechanisms of disease initiation, such as reactive or compensatory glial responses to amyloid and axonal pruning at regions of crossing fibers, should be investigated further. Longitudinal studies beginning with presymptomatic at-risk subjects are critical to a complete understanding of the mechanisms, progression, and prediction of AD and are currently being pursued.
Acknowledgments
This research was supported by NIH grants AG021155 (SCJ), AG000213 (SA), AG027161 (MAS), AG037639 (BBB), and P50 AG033514 (SA); by a Veterans Administration Merit Review Grant I01CX000165 (SCJ); by the Alzheimer's Association; by NIRG-09-132626; by P50 HD03352; by P30 HD003352, by a Clinical and Translational Science Award (UL1RR025011) to the University of Wisconsin, Madison; and by NSF Award SES 0849122. Portions of this research were supported by the Helen Bader Foundation, Northwestern Mutual Foundation, Extendicare Foundation, and from the Veterans Administration including facilities and resources at the Geriatric Research Education and Clinical Center of the William S. Middleton Memorial Veterans Hospital, Madison, WI. The contents do not represent views of the Department of Veterans Affairs nor the United States Government. The authors gratefully acknowledge Daniel Destiche, Sharon Lu, Nancy Davenport-Sis, Amy Hawley, Sandra Harding, Jennifer Bond, Chuck Illingworth, Dustin Wooten, Andrew Higgins, Erika Starks, Kate Sprecher, Martina Ly, and the support of researchers and staff at the Waisman Center, University of Wisconsin-Madison for their assistance in recruitment, data collection, and data analysis. Above all, we wish to thank our dedicated volunteers for their participation in this research.
References
- Adluru N., Zhang H., Fox A.S., Shelton S.E., Ennis C.M., Bartosic A.M., Oler J.A., Tromp do P.M., Zakszewski E., Gee J.C., Kalin N.H., Alexander A.L. A diffusion tensor brain template for rhesus macaques. NeuroImage. 2012;59:306–318. doi: 10.1016/j.neuroimage.2011.07.029. [DOI] [PMC free article] [PubMed] [Google Scholar]
- Alexander D.C., Gee J.C. Elastic matching of diffusion tensor images. Comput. Vis. Image Underst. 2000;77:233–250. [Google Scholar]
- Alexander D.C., Pierpaoli C., Basser P.J., Gee J.C. Spatial transformations of diffusion tensor magnetic resonance images. IEEE Trans. Med. Imaging. 2001;20:1131–1139. doi: 10.1109/42.963816. [DOI] [PubMed] [Google Scholar]
- Alexander A.L., Lee J.E., Lazar M., Field A.S. Diffusion tensor imaging of the brain. Neurotherapeutics. 2007;4:316–329. doi: 10.1016/j.nurt.2007.05.011. [DOI] [PMC free article] [PubMed] [Google Scholar]
- Alexander A.L., Hurley S.A., Samsonov A.A., Adluru N., Hosseinbor A.P., Mossahebi P., Tromp do P.M., Zakszewski E., Field A.S. Characterization of cerebral white matter properties using quantitative magnetic resonance imaging stains. Brain Connect. 2011;1:423–446. doi: 10.1089/brain.2011.0071. [DOI] [PMC free article] [PubMed] [Google Scholar]
- Ashendorf L., Jefferson A.L., O'Connor M.K., Chaisson C., Green R.C., Stern R.A. Trail Making Test errors in normal aging, mild cognitive impairment, and dementia. Arch. Clin. Neuropsychol. 2008;23:129–137. doi: 10.1016/j.acn.2007.11.005. [DOI] [PMC free article] [PubMed] [Google Scholar]
- Avants B.B., Tustison N.J., Song G., Cook P.A., Klein A., Gee J.C. A reproducible evaluation of ANTs similarity metric performance in brain image registration. NeuroImage. 2011;54:2033–2044. doi: 10.1016/j.neuroimage.2010.09.025. [DOI] [PMC free article] [PubMed] [Google Scholar]
- Beaulieu C. The basis of anisotropic water diffusion in the nervous system — a technical review. NMR Biomed. 2002;15:435–455. doi: 10.1002/nbm.782. [DOI] [PubMed] [Google Scholar]
- Bendlin B.B., Fitzgerald M.E., Ries M.L., Xu G., Kastman E.K., Thiel B.W., Rowley H.A., Lazar M., Alexander A.L., Johnson S.C. White matter in aging and cognition: a cross-sectional study of microstructure in adults aged eighteen to eighty-three. Dev. Neuropsychol. 2010;35:257–277. doi: 10.1080/87565641003696775. [DOI] [PMC free article] [PubMed] [Google Scholar]
- Bendlin B.B., Ries M.L., Canu E., Sodhi A., Lazar M., Alexander A.L., Carlsson C.M., Sager M.A., Asthana S., Johnson S.C. White matter is altered with parental family history of Alzheimer's disease. Alzheimers Dement. 2010;6:394–403. doi: 10.1016/j.jalz.2009.11.003. [DOI] [PMC free article] [PubMed] [Google Scholar]
- Bozzali M., Cherubini A. Diffusion tensor MRI to investigate dementias: a brief review. Magn. Reson. Imaging. 2007;25:969–977. doi: 10.1016/j.mri.2007.03.017. [DOI] [PubMed] [Google Scholar]
- Brickman A.M., Siedlecki K.L., Muraskin J., Manly J.J., Luchsinger J.A., Yeung L.K., Brown T.R., DeCarli C., Stern Y. White matter hyperintensities and cognition: testing the reserve hypothesis. Neurobiol. Aging. 2011;32:1588–1598. doi: 10.1016/j.neurobiolaging.2009.10.013. [DOI] [PMC free article] [PubMed] [Google Scholar]
- Chao L.L., Decarli C., Kriger S., Truran D., Zhang Y., Laxamana J., Villeneuve S., Jagust W.J., Sanossian N., Mack W.J., Chui H.C., Weiner M.W. Associations between white matter hyperintensities and beta amyloid on integrity of projection, association, and limbic fiber tracts measured with diffusion tensor MRI. PLoS One. 2013;8:e65175. doi: 10.1371/journal.pone.0065175. [DOI] [PMC free article] [PubMed] [Google Scholar]
- Charlton R.A., Barrick T.R., McIntyre D.J., Shen Y., O'Sullivan M., Howe F.A., Clark C.A., Morris R.G., Markus H.S. White matter damage on diffusion tensor imaging correlates with age-related cognitive decline. Neurology. 2006;66:217–222. doi: 10.1212/01.wnl.0000194256.15247.83. [DOI] [PubMed] [Google Scholar]
- Chetelat G. Alzheimer disease: Abeta-independent processes-rethinking preclinical AD. Nat. Rev. Neurol. 2013;9:123–124. doi: 10.1038/nrneurol.2013.21. [DOI] [PMC free article] [PubMed] [Google Scholar]
- Chua T.C., Wen W., Slavin M.J., Sachdev P.S. Diffusion tensor imaging in mild cognitive impairment and Alzheimer's disease: a review. Curr. Opin. Neurol. 2008;21:83–92. doi: 10.1097/WCO.0b013e3282f4594b. [DOI] [PubMed] [Google Scholar]
- Ciccarelli O., Werring D.J., Wheeler-Kingshott C.A., Barker G.J., Parker G.J., Thompson A.J., Miller D.H. Investigation of MS normal-appearing brain using diffusion tensor MRI with clinical correlations. Neurology. 2001;56:926–933. doi: 10.1212/wnl.56.7.926. [DOI] [PubMed] [Google Scholar]
- Copenhaver B.R., Rabin L.A., Saykin A.J., Roth R.M., Wishart H.A., Flashman L.A., Santulli R.B., McHugh T.L., Mamourian A.C. The fornix and mammillary bodies in older adults with Alzheimer's disease, mild cognitive impairment, and cognitive complaints: a volumetric MRI study. Psychiatry Res. 2006;147:93–103. doi: 10.1016/j.pscychresns.2006.01.015. [DOI] [PubMed] [Google Scholar]
- Douaud G., Jbabdi S., Behrens T.E., Menke R.A., Gass A., Monsch A.U., Rao A., Whitcher B., Kindlmann G., Matthews P.M., Smith S. DTI measures in crossing-fibre areas: increased diffusion anisotropy reveals early white matter alteration in MCI and mild Alzheimer's disease. NeuroImage. 2011;55:880–890. doi: 10.1016/j.neuroimage.2010.12.008. [DOI] [PMC free article] [PubMed] [Google Scholar]
- Edison P., Archer H.A., Gerhard A., Hinz R., Pavese N., Turkheimer F.E., Hammers A., Tai Y.F., Fox N., Kennedy A., Rossor M., Brooks D.J. Microglia, amyloid, and cognition in Alzheimer's disease: An [11C](R)PK11195-PET and [11C]PIB-PET study. Neurobiol. Dis. 2008;32:412–419. doi: 10.1016/j.nbd.2008.08.001. [DOI] [PubMed] [Google Scholar]
- Fein J.A., Sokolow S., Miller C.A., Vinters H.V., Yang F., Cole G.M., Gylys K.H. Co-localization of amyloid beta and tau pathology in Alzheimer's disease synaptosomes. Am. J. Pathol. 2008;172:1683–1692. doi: 10.2353/ajpath.2008.070829. [DOI] [PMC free article] [PubMed] [Google Scholar]
- Franklin R.J.M., Ffrench-Constant C. Remyelination in the CNS: from biology to therapy. Nat. Rev. Neurosci. 2008;9:839–855. doi: 10.1038/nrn2480. [DOI] [PubMed] [Google Scholar]
- Fujita K., Nakane S., Harada M., Izumi Y., Kaji R. Diffusion tensor imaging in patients with Creutzfeldt–Jakob disease. J. Neurol. Neurosurg. Psychiatry. 2008;79:1304–1306. doi: 10.1136/jnnp.2008.148528. [DOI] [PubMed] [Google Scholar]
- Gaffan D., Gaffan E.A. Amnesia in man following transection of the fornix. A review. Brain. 1991;114(Pt 6):2611–2618. doi: 10.1093/brain/114.6.2611. [DOI] [PubMed] [Google Scholar]
- Gaudino E.A., Geisler M.W., Squires N.K. Construct validity in the Trail Making Test: what makes Part B harder? J. Clin. Exp. Neuropsychol. 1995;17:529–535. doi: 10.1080/01688639508405143. [DOI] [PubMed] [Google Scholar]
- Hagen K., Ehlis A.-C., Haeussinger F.B., Heinzel S., Dresler T., Mueller L., Herrmann M.J., Fallgatter A.J., Metzger F.G. Activation during the Trail Making Test measured with functional near-infrared spectroscopy in healthy elderly subjects. NeuroImage. 2014;85(Pt 1):583–591. doi: 10.1016/j.neuroimage.2013.09.014. [DOI] [PubMed] [Google Scholar]
- Hannoun S., Durand-Dubief F., Confavreux C., Ibarrola D., Streichenberger N., Cotton F., Guttmann C.R., Sappey-Marinier D. Diffusion tensor-MRI evidence for extra-axonal neuronal degeneration in caudate and thalamic nuclei of patients with multiple sclerosis. AJNR Am. J. Neuroradiol. 2012;33:1363–1368. doi: 10.3174/ajnr.A2983. [DOI] [PMC free article] [PubMed] [Google Scholar]
- Heo J.H., Lee S.T., Chu K., Kim M.H. White matter hyperintensities and cognitive dysfunction in Alzheimer's disease. J. Neurol. Sci. 2009;283:286. doi: 10.1177/0891988709335800. [DOI] [PubMed] [Google Scholar]
- Hoeft F., Barnea-Goraly N., Haas B.W., Golarai G., Ng D., Mills D., Korenberg J., Bellugi U., Galaburda A., Reiss A.L. More is not always better: increased fractional anisotropy of superior longitudinal fasciculus associated with poor visuospatial abilities in Williams syndrome. J. Neurosci. 2007;27:11960–11965. doi: 10.1523/JNEUROSCI.3591-07.2007. [DOI] [PMC free article] [PubMed] [Google Scholar]
- Horsfield M.A., Jones D.K. Applications of diffusion-weighted and diffusion tensor MRI to white matter diseases — a review. NMR Biomed. 2002;15:570–577. doi: 10.1002/nbm.787. [DOI] [PubMed] [Google Scholar]
- Ivnik R.J., Malec J.F., Tangalos E.G., Petersen R.C. The Auditory-Verbal Learning Test (AVLT): Norms for ages 55 years and older. Psychol. Assess. 1990;2:304–312. [Google Scholar]
- Jack C.R., Lowe V.J., Weigand S.D., Wiste H.J., Senjem M.L., Knopman D.S., Shiung M.M., Gunter J.L., Boeve B.F., Kemp B.J., Weiner M., Petersen R.C. Serial PIB and MRI in normal, mild cognitive impairment and Alzheimer's disease: implications for sequence of pathological events in Alzheimer's disease. Brain. 2009;132:1355–1365. doi: 10.1093/brain/awp062. [DOI] [PMC free article] [PubMed] [Google Scholar]
- Jauregui-Huerta F., Ruvalcaba-Delgadillo Y., Gonzalez-Castaneda R., Garcia-Estrada J., Gonzalez-Perez O., Luquin S. Responses of glial cells to stress and glucocorticoids. Curr. Immunol. Rev. 2010;6:195–204. doi: 10.2174/157339510791823790. [DOI] [PMC free article] [PubMed] [Google Scholar]
- Jicha G.A., Rentz D.M. Cognitive and brain reserve and the diagnosis and treatment of preclinical Alzheimer disease. Neurology. 2013;80:1180–1181. doi: 10.1212/WNL.0b013e318289714a. [DOI] [PubMed] [Google Scholar]
- Johnson S.C., Christian B.T., Okonkwo O.C., Oh J.M., Harding S., Xu G., Hillmer A.T., Wooten D.W., Murali D., Barnhart T.E., Hall L.T., Racine A.M., Klunk W.E., Mathis C.A., Bendlin B.B., Gallagher C.L., Carlsson C.M., Rowley H.A., Hermann B.P., Dowling N.M., Asthana S., Sager M.A. Amyloid burden and neural function in people at risk for Alzheimer's disease. Neurobiol. Aging. 2014;35:576–584. doi: 10.1016/j.neurobiolaging.2013.09.028. [DOI] [PMC free article] [PubMed] [Google Scholar]
- Jones D.K., Cercignani M. Twenty-five pitfalls in the analysis of diffusion MRI data. NMR Biomed. 2010;23:803–820. doi: 10.1002/nbm.1543. [DOI] [PubMed] [Google Scholar]
- Kemppainen N.M., Aalto S., Wilson I.A., Nagren K., Helin S., Bruck A., Oikonen V., Kailajarvi M., Scheinin M., Viitanen M., Parkkola R., Rinne J.O. Voxel-based analysis of PET amyloid ligand [11C]PIB uptake in Alzheimer disease. Neurology. 2006;67:1575–1580. doi: 10.1212/01.wnl.0000240117.55680.0a. [DOI] [PubMed] [Google Scholar]
- Kennedy K.M., Rodrigue K.M., Devous M.D., Hebrank A.C., Bischof G.N., Park D.C. Effects of beta-amyloid accumulation on neural function during encoding across the adult lifespan. NeuroImage. 2012;62:1–8. doi: 10.1016/j.neuroimage.2012.03.077. [DOI] [PMC free article] [PubMed] [Google Scholar]
- Klein A., Andersson J., Ardekani B.A., Ashburner J., Avants B., Chiang M.C., Christensen G.E., Collins D.L., Gee J., Hellier P., Song J.H., Jenkinson M., Lepage C., Rueckert D., Thompson P., Vercauteren T., Woods R.P., Mann J.J., Parsey R.V. Evaluation of 14 nonlinear deformation algorithms applied to human brain MRI registration. NeuroImage. 2009;46:786–802. doi: 10.1016/j.neuroimage.2008.12.037. [DOI] [PMC free article] [PubMed] [Google Scholar]
- Knight R.G., McMahon J., Skeaff C.M., Green T.J. Reliable Change Index scores for persons over the age of 65 tested on alternate forms of the Rey AVLT. Arch. Clin. Neuropsychol. 2007;22:513–518. doi: 10.1016/j.acn.2007.03.005. [DOI] [PubMed] [Google Scholar]
- La Rue A., Hermann B., Jones J.E., Johnson S., Asthana S., Sager M.A. Effect of parental family history of Alzheimer's disease on serial position profiles. Alzheimers Dement. 2008;4:285–290. doi: 10.1016/j.jalz.2008.03.009. [DOI] [PMC free article] [PubMed] [Google Scholar]
- Leech R., Sharp D.J. The role of the posterior cingulate cortex in cognition and disease. Brain. 2014;137:12–32. doi: 10.1093/brain/awt162. [DOI] [PMC free article] [PubMed] [Google Scholar]
- Lezak M.D. Neuropsychological assessment in behavioral toxicology—developing techniques and interpretative issues. Scand. J. Work Environ. Health. 1984;10(Suppl. 1):25–29. [PubMed] [Google Scholar]
- Lezak M.D. Fourth ed. Oxford University Press; New York, New York: 2004. Neuropsychological Assessment. [Google Scholar]
- Liu Y., Spulber G., Lehtimäki K.K., Könönen M., Hallikainen I., Gröhn H., Kivipelto M., Hallikainen M., Vanninen R., Soininen H. Diffusion tensor imaging and Tract-Based Spatial Statistics in Alzheimer's disease and mild cognitive impairment. Neurobiol. Aging. 2011;32:1558–1571. doi: 10.1016/j.neurobiolaging.2009.10.006. [DOI] [PubMed] [Google Scholar]
- Lutz J., Jager L., de Quervain D., Krauseneck T., Padberg F., Wichnalek M., Beyer A., Stahl R., Zirngibl B., Morhard D., Reiser M., Schelling G. White and gray matter abnormalities in the brain of patients with fibromyalgia: a diffusion-tensor and volumetric imaging study. Arthritis Rheum. 2008;58:3960–3969. doi: 10.1002/art.24070. [DOI] [PubMed] [Google Scholar]
- Madden D.J., Spaniol J., Costello M.C., Bucur B., White L.E., Cabeza R., Davis S.W., Dennis N.A., Provenzale J.M., Huettel S.A. Cerebral white matter integrity mediates adult age differences in cognitive performance. J. Cogn. Neurosci. 2009;21:289–302. doi: 10.1162/jocn.2009.21047. [DOI] [PMC free article] [PubMed] [Google Scholar]
- Mielke M.M., Kozauer N.A., Chan K.C.G., George M., Toroney J., Zerrate M., Bandeen-Roche K., Wang M.C., vanZijl P., Pekar J.J. Regionally-specific diffusion tensor imaging in mild cognitive impairment and Alzheimer's disease. NeuroImage. 2009;46:47–55. doi: 10.1016/j.neuroimage.2009.01.054. [DOI] [PMC free article] [PubMed] [Google Scholar]
- Mormino E.C., Kluth J.T., Madison C.M., Rabinovici G.D., Baker S.L., Miller B.L., Koeppe R.A., Mathis C.A., Weiner M.W., Jagust W.J. Episodic memory loss is related to hippocampal-mediated -amyloid deposition in elderly subjects. Brain. 2008;132:1310–1323. doi: 10.1093/brain/awn320. [DOI] [PMC free article] [PubMed] [Google Scholar]
- Mueggler T., Meyer-Luehmann M., Rausch M., Staufenbiel M., Jucker M., Rudin M. Restricted diffusion in the brain of transgenic mice with cerebral amyloidosis. Eur. J. Neurosci. 2004;20:811–817. doi: 10.1111/j.1460-9568.2004.03534.x. [DOI] [PubMed] [Google Scholar]
- Muller H.P., Kassubek J., Vernikouskaya I., Ludolph A.C., Stiller D., Rasche V. Diffusion tensor magnetic resonance imaging of the brain in APP transgenic mice: a cohort study. PLoS One. 2013;8:e67630. doi: 10.1371/journal.pone.0067630. [DOI] [PMC free article] [PubMed] [Google Scholar]
- Naslund J., Haroutunian V., Mohs R., Davis K.L., Davies P., Greengard P., Buxbaum J.D. Correlation between elevated levels of amyloid beta-peptide in the brain and cognitive decline. JAMA. 2000;283:1571–1577. doi: 10.1001/jama.283.12.1571. [DOI] [PubMed] [Google Scholar]
- Nir T.M., Jahanshad N., Villalon-Reina J.E., Toga A.W., Jack C.R., Weiner M.W., Thompson P.M. Effectiveness of regional DTI measures in distinguishing Alzheimer's disease, MCI and, normal aging. NeuroImage. 2013;3:180–195. doi: 10.1016/j.nicl.2013.07.006. [DOI] [PMC free article] [PubMed] [Google Scholar]
- Oishi K., Mielke M.M., Albert M., Lyketsos C.G., Mori S. The fornix sign: a potential sign for Alzheimer's disease based on diffusion tensor imaging. J. Neuroimaging. 2012;22:365–374. doi: 10.1111/j.1552-6569.2011.00633.x. [DOI] [PMC free article] [PubMed] [Google Scholar]
- Okonkwo O.C., Oh J.M., Koscik R., Jonaitis E., Cleary C.A., Dowling N.M., Bendlin B.B., LaRue A., Hermann B.P., Barnhart T.E., Murali D., Rowley H.A., Carlsson C.M., Gallagher C.L., Asthana S., Sager M.A., Christian B.T., Johnson S.C. Amyloid burden, neuronal function, and cognitive decline in middle-aged adults at risk for Alzheimer's disease. J. Int. Neuropsychol. Soc. 2014 doi: 10.1017/S1355617714000113. (in press) [DOI] [PMC free article] [PubMed] [Google Scholar]
- O'Sullivan M., Jones D.K., Summers P.E., Morris R.G., Williams S.C., Markus H.S. Evidence for cortical “disconnection” as a mechanism of age-related cognitive decline. Neurology. 2001;57:632–638. doi: 10.1212/wnl.57.4.632. [DOI] [PubMed] [Google Scholar]
- Perez-Nievas B.G., Stein T.D., Tai H.C., Dols-Icardo O., Scotton T.C., Barroeta-Espar I., Fernandez-Carballo L., de Munain E.L., Perez J., Marquie M., Serrano-Pozo A., Frosch M.P., Lowe V., Parisi J.E., Petersen R.C., Ikonomovic M.D., Lopez O.L., Klunk W., Hyman B.T., Gomez-Isla T. Dissecting phenotypic traits linked to human resilience to Alzheimer's pathology. Brain. 2013;136:2510–2526. doi: 10.1093/brain/awt171. [DOI] [PMC free article] [PubMed] [Google Scholar]
- Pfefferbaum A., Sullivan E.V., Hedehus M., Lim K.O., Adalsteinsson E., Moseley M. Age-related decline in brain white matter anisotropy measured with spatially corrected echo-planar diffusion tensor imaging. Magn. Reson. Med. 2000;44:259–268. doi: 10.1002/1522-2594(200008)44:2<259::aid-mrm13>3.0.co;2-6. [DOI] [PubMed] [Google Scholar]
- Qin Y.-Y., Li M.-W., Zhang S., Zhang Y., Zhao L.-Y., Lei H., Oishi K., Zhu W.-Z. In vivo quantitative whole-brain diffusion tensor imaging analysis of APP/PS1 transgenic mice using voxel-based and atlas-based methods. Neuroradiology. 2013;55:1027–1038. doi: 10.1007/s00234-013-1195-0. [DOI] [PubMed] [Google Scholar]
- Rabin L.A., Barr W.B., Burton L.A. Assessment practices of clinical neuropsychologists in the United States and Canada: a survey of INS, NAN, and APA Division 40 members. Arch. Clin. Neuropsychol. 2005;20:33–65. doi: 10.1016/j.acn.2004.02.005. [DOI] [PubMed] [Google Scholar]
- Raz N., Ghisletta P., Rodrigue K.M., Kennedy K.M., Lindenberger U. Trajectories of brain aging in middle-aged and older adults: regional and individual differences. NeuroImage. 2010;51:501–511. doi: 10.1016/j.neuroimage.2010.03.020. [DOI] [PMC free article] [PubMed] [Google Scholar]
- Ringman J.M., O'Neill J., Geschwind D., Medina L., Apostolova L.G., Rodriguez Y., Schaffer B., Varpetian A., Tseng B., Ortiz F., Fitten J., Cummings J.L., Bartzokis G. Diffusion tensor imaging in preclinical and presymptomatic carriers of familial Alzheimer's disease mutations. Brain. 2007;130:1767–1776. doi: 10.1093/brain/awm102. [DOI] [PubMed] [Google Scholar]
- Rodrigue K.M., Kennedy K.M., Devous M.D., Rieck J.R., Hebrank A.C., Diaz-Arrastia R., Mathews D., Park D.C. Amyloid burden in healthy aging: regional distribution and cognitive consequences. Neurology. 2012;78:387–395. doi: 10.1212/WNL.0b013e318245d295. [DOI] [PMC free article] [PubMed] [Google Scholar]
- Rodríguez J.J., Witton J., Olabarria M., Noristani H.N., Verkhratsky A. Increase in the density of resting microglia precedes neuritic plaque formation and microglial activation in a transgenic model of Alzheimer's disease. Cell Death Dis. 2010;1:e1. doi: 10.1038/cddis.2009.2. [DOI] [PMC free article] [PubMed] [Google Scholar]
- Roitbak T., Sykova E. Diffusion barriers evoked in the rat cortex by reactive astrogliosis. Glia. 1999;28:40–48. doi: 10.1002/(sici)1098-1136(199910)28:1<40::aid-glia5>3.0.co;2-6. [DOI] [PubMed] [Google Scholar]
- Ryan N.S., Keihaninejad S., Shakespeare T.J., Lehmann M., Crutch S.J., Malone I.B., Thornton J.S., Mancini L., Hyare H., Yousry T., Ridgway G.R., Zhang H., Modat M., Alexander D.C., Rossor M.N., Ourselin S., Fox N.C. Magnetic resonance imaging evidence for presymptomatic change in thalamus and caudate in familial Alzheimer's disease. Brain. 2013;136:1399–1414. doi: 10.1093/brain/awt065. [DOI] [PMC free article] [PubMed] [Google Scholar]
- Sager M.A., Hermann B., La Rue A. Middle-aged children of persons with Alzheimer's disease: APOE genotypes and cognitive function in the Wisconsin Registry for Alzheimer's Prevention. J. Geriatr. Psychiatry Neurol. 2005;18:245–249. doi: 10.1177/0891988705281882. [DOI] [PubMed] [Google Scholar]
- Scarmeas N., Stern Y. Cognitive reserve: implications for diagnosis and prevention of Alzheimer's disease. Curr. Neurol. Neurosci. Rep. 2004;4:374–380. doi: 10.1007/s11910-004-0084-7. [DOI] [PMC free article] [PubMed] [Google Scholar]
- Schmidt M. Western Psychological Services; Los Angeles, California: 1996. Rey Auditory Verbal Learning Test: A Handbook. [Google Scholar]
- Sexton C.E., Kalu U.G., Filippini N., Mackay C.E., Ebmeier K.P. A meta-analysis of diffusion tensor imaging in mild cognitive impairment and Alzheimer's disease. Neurobiol. Aging. 2011;32:2322. doi: 10.1016/j.neurobiolaging.2010.05.019. (e2325-2318) [DOI] [PubMed] [Google Scholar]
- Shu X., Qin Y.-Y., Zhang S., Jiang J.-J., Zhang Y., Zhao L.-Y., Shan D., Zhu W.-Z. Voxel-Based Diffusion Tensor Imaging of an APP/PS1 Mouse Model of Alzheimer's Disease. Mol. Neurobiol. 2013;48:78–83. doi: 10.1007/s12035-013-8418-6. [DOI] [PubMed] [Google Scholar]
- Song S.K., Kim J.H., Lin S.J., Brendza R.P., Holtzman D.M. Diffusion tensor imaging detects age-dependent white matter changes in a transgenic mouse model with amyloid deposition. Neurobiol. Dis. 2004;15:640–647. doi: 10.1016/j.nbd.2003.12.003. [DOI] [PubMed] [Google Scholar]
- Stern Y., Albert S., Tang M.X., Tsai W.Y. Rate of memory decline in AD is related to education and occupation: cognitive reserve? Neurology. 1999;53:1942–1947. doi: 10.1212/wnl.53.9.1942. [DOI] [PubMed] [Google Scholar]
- Stikov N., Perry L.M., Mezer A., Rykhlevskaia E., Wandell B.A., Pauly J.M., Dougherty R.F. Bound pool fractions complement diffusion measures to describe white matter micro and macrostructure. NeuroImage. 2011;54:1112–1121. doi: 10.1016/j.neuroimage.2010.08.068. [DOI] [PMC free article] [PubMed] [Google Scholar]
- Sullivan E.V., Rohlfing T., Pfefferbaum A. Quantitative fiber tracking of lateral and interhemispheric white matter systems in normal aging: relations to timed performance. Neurobiol. Aging. 2010;31:464–481. doi: 10.1016/j.neurobiolaging.2008.04.007. [DOI] [PMC free article] [PubMed] [Google Scholar]
- Sun S.W., Song S.K., Harms M.P., Lin S.J., Holtzman D.M., Merchant K.M., Kotyk J.J. Detection of age-dependent brain injury in a mouse model of brain amyloidosis associated with Alzheimer's disease using magnetic resonance diffusion tensor imaging. Exp. Neurol. 2005;191:77–85. doi: 10.1016/j.expneurol.2004.09.006. [DOI] [PubMed] [Google Scholar]
- Teipel S.J., Stahl R., Dietrich O., Schoenberg S.O., Perneczky R., Bokde A.L.W., Reiser M.F., Möller H.-J., Hampel H. Multivariate network analysis of fiber tract integrity in Alzheimer's disease. NeuroImage. 2007;34:985–995. doi: 10.1016/j.neuroimage.2006.07.047. [DOI] [PubMed] [Google Scholar]
- Thiessen J.D., Glazner K.A.C., Nafez S., Schellenberg A.E., Buist R., Martin M., Albensi B.C. Histochemical visualization and diffusion MRI at 7 Tesla in the TgCRND8 transgenic model of Alzheimer's disease. Brain Struct. Funct. 2010;215:29–36. doi: 10.1007/s00429-010-0271-z. [DOI] [PubMed] [Google Scholar]
- Tournier J.D., Yeh C.-H., Calamante F., Cho K.-H., Connelly A., Lin C.-P. Resolving crossing fibres using constrained spherical deconvolution: validation using diffusion-weighted imaging phantom data. NeuroImage. 2008;42:617–625. doi: 10.1016/j.neuroimage.2008.05.002. [DOI] [PubMed] [Google Scholar]
- Tovar-Moll F., Evangelou I.E., Chiu A.W., Richert N.D., Ostuni J.L., Ohayon J.M., Auh S., Ehrmantraut M., Talagala S.L., McFarland H.F., Bagnato F. Thalamic Involvement and Its Impact on Clinical Disability in Patients with Multiple Sclerosis: a diffusion tensor imaging study at 3 T. Am. J. Neuroradiol. 2009;30:1380–1386. doi: 10.3174/ajnr.A1564. [DOI] [PMC free article] [PubMed] [Google Scholar]
- Tuch D.S., Reese T.G., Wiegell M.R., Makris N., Belliveau J.W., Wedeen V.J. High angular resolution diffusion imaging reveals intravoxel white matter fiber heterogeneity. Magn. Reson. Med. 2002;48:577–582. doi: 10.1002/mrm.10268. [DOI] [PubMed] [Google Scholar]
- Villain N., Desgranges B., Viader F., de la Sayette V., Mezenge F., Landeau B., Baron J.C., Eustache F., Chetelat G. Relationships between hippocampal atrophy, white matter disruption, and gray matter hypometabolism in Alzheimer's disease. J. Neurosci. 2008;28:6174–6181. doi: 10.1523/JNEUROSCI.1392-08.2008. [DOI] [PMC free article] [PubMed] [Google Scholar]
- Villemagne V.L., Burnham S., Bourgeat P., Brown B., Ellis K.A., Salvado O., Szoeke C., Macaulay S.L., Martins R., Maruff P., Ames D., Rowe C.C., Masters C.L. Amyloid β deposition, neurodegeneration, and cognitive decline in sporadic Alzheimer's disease: a prospective cohort study. Lancet Neurol. 2013;12:357–367. doi: 10.1016/S1474-4422(13)70044-9. [DOI] [PubMed] [Google Scholar]
- Wakana S., Jiang H., Nagae-Poetscher L.M., van Zijl P.C., Mori S. Fiber tract-based atlas of human white matter anatomy. Radiology. 2004;230:77–87. doi: 10.1148/radiol.2301021640. [DOI] [PubMed] [Google Scholar]
- Wang Y., Gupta A., Liu Z., Zhang H., Escolar M.L., Gilmore J.H., Gouttard S., Fillard P., Maltbie E., Gerig G., Styner M. DTI registration in atlas based fiber analysis of infantile Krabbe disease. NeuroImage. 2011;55:1577–1586. doi: 10.1016/j.neuroimage.2011.01.038. [DOI] [PMC free article] [PubMed] [Google Scholar]
- Wilson R.S., Scherr P.A., Schneider J.A., Tang Y., Bennett D.A. Relation of cognitive activity to risk of developing Alzheimer disease. Neurology. 2007;69:1911–1920. doi: 10.1212/01.wnl.0000271087.67782.cb. [DOI] [PubMed] [Google Scholar]
- Worsley K.J., Marrett S., Neelin P., Vandal A.C., Friston K.J., Evans A.C. A unified statistical approach for determining significant signals in images of cerebral activation. Hum. Brain Mapp. 1996;4:58–73. doi: 10.1002/(SICI)1097-0193(1996)4:1<58::AID-HBM4>3.0.CO;2-O. [DOI] [PubMed] [Google Scholar]
- Wu T.C., Wilde E.A., Bigler E.D., Yallampalli R., McCauley S.R., Troyanskaya M., Chu Z., Li X., Hanten G., Hunter J.V., Levin H.S. Evaluating the relationship between memory functioning and cingulum bundles in acute mild traumatic brain injury using diffusion tensor imaging. J. Neurotrauma. 2010;27:303–307. doi: 10.1089/neu.2009.1110. [DOI] [PMC free article] [PubMed] [Google Scholar]
- Yurgelun-Todd D.A., Silveri M.M., Gruber S.A., Rohan M.L., Pimentel P.J. White matter abnormalities observed in bipolar disorder: a diffusion tensor imaging study. Bipolar Disord. 2007;9:504–512. doi: 10.1111/j.1399-5618.2007.00395.x. [DOI] [PubMed] [Google Scholar]
- Zerbi V., Kleinnijenhuis M., Fang X., Jansen D., Veltien A., Van Asten J., Timmer N., Dederen P.J., Kiliaan A.J., Heerschap A. Gray and white matter degeneration revealed by diffusion in an Alzheimer mouse model. Neurobiol. Aging. 2013;34:1440–1450. doi: 10.1016/j.neurobiolaging.2012.11.017. [DOI] [PubMed] [Google Scholar]
- Zhang H., Yushkevich P.A., Alexander D.C., Gee J.C. Deformable registration of diffusion tensor MR images with explicit orientation optimization. Med. Image Anal. 2006;10:764–785. doi: 10.1016/j.media.2006.06.004. [DOI] [PubMed] [Google Scholar]
- Zhang H., Avants B.B., Yushkevich P.A., Woo J.H., Wang S., McCluskey L.F., Elman L.B., Melhem E.R., Gee J.C. High-dimensional spatial normalization of diffusion tensor images improves the detection of white matter differences: an example study using amyotrophic lateral sclerosis. IEEE Trans. Med. Imaging. 2007;26:1585–1597. doi: 10.1109/TMI.2007.906784. [DOI] [PubMed] [Google Scholar]
- Zhang H., Yushkevich P.A., Rueckert D., Gee J.C. Medical Image Computing and Computer-assisted Intervention: MICCAI. Vol. 10. 2007. Unbiased white matter atlas construction using diffusion tensor images; pp. 211–218. (International Conference on Medical Image Computing and Computer-Assisted Intervention). [DOI] [PubMed] [Google Scholar]
- Ziolko S.K., Weissfeld L.A., Klunk W.E., Mathis C.A., Hoge J.A., Lopresti B.J., DeKosky S.T., Price J.C. Evaluation of voxel-based methods for the statistical analysis of PIB PET amyloid imaging studies in Alzheimer's disease. NeuroImage. 2006;33:94–102. doi: 10.1016/j.neuroimage.2006.05.063. [DOI] [PubMed] [Google Scholar]
Associated Data
This section collects any data citations, data availability statements, or supplementary materials included in this article.