

Abstract
The integrity of descending white matter pathways, measured by fractional anisotropy from DW-MRI, is a key prognostic indicator of motor recovery after stroke. Barriers to translation of fractional anisotropy measures into routine clinical practice include the time required for manually delineating volumes of interest (VOIs), and inter-examiner variability in this process. This study investigated whether registering and then editing template volumes of interest ‘as required’ would improve inter-examiner reliability compared with manual delineation, without compromising validity. MRI was performed with 30 sub-acute stroke patients with motor deficits (mean NIHSS = 11, range 0–17). Four independent examiners manually delineated VOIs for the posterior limbs of the internal capsules on T1 images, or edited template VOIs that had been registered to the T1 images if they encroached on ventricles or basal ganglia. Fractional anisotropy within each VOI and interhemispheric asymmetry were then calculated. We found that 13/30 registered template VOIs required editing. Edited template VOIs were more spatially similar between examiners than the manually delineated VOIs (p = 0.005). Both methods produced similar asymmetry values that correlated with clinical scores with near perfect levels of agreement between examiners. Contralesional fractional anisotropy correlated with age when edited template VOIs were used but not when VOIs were manually delineated. Editing template VOIs as required is reliable, increases the validity of fractional anisotropy measurements in the posterior limb of the internal capsule, and is less time-consuming compared to manual delineation. This approach could support the use of FA asymmetry measures in routine clinical practice.
Keywords: Stroke, Magnetic resonance imaging, Diffusion-weighted imaging, Prognosis
Highlights
-
•
Fractional anisotropy in the PLIC is a key prognostic indicator of motor recovery after stroke.
-
•
Editing template PLIC volumes of interest is valid, reliable and efficient.
-
•
A template-based approach may translate FA asymmetry measures to clinical practice.
1. Introduction
Diffusion tensor imaging provides information about tissue composition that reflects the microstructural integrity of white matter tracts in the brain (Basser, 1995; Basser and Pierpaoli, 1996). Fractional anisotropy (FA) quantifies the extent to which water diffusion is directionally restricted and is the most common DTI parameter used to assess white matter integrity (Jang, 2010). Disruption of white matter tracts results in less restriction on water diffusion and a lowering of the FA value (Basser and Pierpaoli, 1996; Werring et al., 2000). After stroke, reduced white matter integrity can occur acutely within the primary lesion location, and can be a delayed and distant consequence of anterograde and/or retrograde axonal degeneration (Thomalla et al., 2004; Werring et al., 2000). FA derived from DTI correlates with upper limb function in chronic stroke patients (Stinear et al., 2007), and can be used to predict recovery of upper limb motor function at both early (Jang et al., 2005, 2008; Maeda et al., 2005; Stinear et al., 2012) and chronic stages of stroke (Stinear et al., 2007).
Two approaches to DTI-based analysis can be used to evaluate FA values in white matter tracts. The first is white matter tractography, in which three-dimensional reconstructions of tract trajectories are calculated from the DTI vector field (Mori and van Zijl, 2002). Regions of interest are defined, typically on a single axial slice, as seeds, waypoints and endpoints for subsequent tractography. Mean FA values along the tracts can then be compared between contralesional and ipsilesional hemispheres (Borich et al., 2012; Puig et al., 2012; Wakana et al., 2007). This approach can be confounded by anatomical variations or stroke lesions, and requires at least a part of the tract of interest to be intact from start to finish (Borich et al., 2012; Puig et al., 2011; Tang et al., 2010; Wakana et al., 2007). Moreover, tractography is a complex and time-consuming process, and results vary depending upon the particular algorithm employed (Chung et al., 2011; Ciccarelli et al., 2008).
A second approach involves defining a three-dimensional VOI and then calculating the mean FA within the volume. A typical choice of VOI is the posterior limb of the internal capsule (PLIC). Mean FA is calculated bilaterally within the PLIC VOIs to determine FA asymmetry (Borich et al., 2012; Stinear et al., 2007). FA asymmetry correlates with current upper limb motor function (Lindenberg et al., 2010; Zhu et al., 2010), and can be used as a predictor of motor recovery in both chronic (Stinear et al., 2007) and acute patients (Jang et al., 2005; Stinear et al., 2012).
The most commonly used method to define VOIs is manual tracing, in which experienced examiners delineate anatomical structures (Karnath and Perenin, 2005; Moro et al., 2008; Mort et al., 2003). Manual drawing methods remain the gold standard for the exact delineation of anatomical structures as they require fewer computing resources than tractography-based approaches and are more intuitive for clinical use. However, shortcomings of manual tracing include: being limited to regions identifiable by anatomic landmarks (Eckert et al., 2008); being labor intensive (Ashton et al., 2003; Seghier et al., 2008); and erroneous inclusion of structures such as gray matter and other tracts (Holodny et al., 2005; Park et al., 2008). For these reasons, an automated method of VOI delineation may be preferable. Automated methods are much faster, and they may also minimize inter-examiner disagreements (Wilke et al., 2011). However, automated methods may have shortcomings for studies of stroke patients, such as inadequate compensation for the structural distortions introduced by lesions that may result in gray matter or CSF being included in the VOI. Additionally, there may be inadequate correction for anatomical variability between subjects (Fiez et al., 2000). A compromise between manual and automated approaches exists in which VOIs produced by an automated technique are manually edited as required to correct any inappropriate inclusion of gray matter or CSF. It is not clear whether manual or edited VOI delineation methods produce measures that are the more reliable and accurate.
The aims of this study were to compare the reliability and validity of manual and edited VOI methods for defining the PLIC on MR images from sub-acute stroke patients. We hypothesized that editing registered templates would produce valid and more reliable FA values, compared to the more time-consuming process of manual delineation.
2. Material and methods
2.1. Participants
Participants were recruited if they were at least 18 years old and had experienced a first-ever ischemic stroke resulting in persistent unilateral upper limb impairment. Exclusion criteria were any neurological or other conditions that would prevent informed consent or hinder the acquisition or interpretation of the data, such as cognitive or communication deficits, previous stroke, and contra-indications to MRI. Participants were screened using a MRI safety checklist. The study was approved by the regional ethics committee, and all participants provided written informed consent, in accordance with the Declaration of Helsinki.
There were 30 participants in this study (20 females; mean age 68 years, range 31 to 92 years; 19 with right hemisphere lesions and 11 with left hemisphere lesions; Table 1, Fig. 1) and all except one was right-hand dominant before their stroke. All participants completed MR imaging within a mean of 11 (range 4 to 22) days of stroke. At a mean of 13 (range 5 to 23) days after stroke, a clinical assessor evaluated stroke severity using the National Institutes of Health Stroke Scale (NIHSS), motor impairment of the affected upper limb using the Fugl-Meyer (FM) scale, maximum score 66 (Fugl-Meyer et al., 1975); and upper limb function using the Action Research Arm Test (ARAT), maximum score of 57 (Lyle, 1981). The clinical assessor was blinded to the MR images.
Table 1.
Participant demographics.
| Subject | Sex | Age (y) | DH | SH | Lesion location | TSS (d) | NIH-SS (/42) | ARAT (/57) | FM (/66) | Edit |
|---|---|---|---|---|---|---|---|---|---|---|
| 1 | F | 52 | R | R | BS | 21 | 2 | 19 | 21 | N |
| 2 | F | 39 | R | R | CR | 18 | 3 | 19 | 37 | N |
| 3 | M | 68 | R | L | PLIC, Thal, BG | 6 | 1 | 56 | 56 | N |
| 4 | F | 83 | R | R | CR | 10 | 7 | 21 | 29 | N |
| 5 | M | 73 | R | R | CR | 11 | 1 | 51 | 62 | N |
| 6 | F | 73 | R | R | CR | 9 | 1 | 44 | 59 | Y |
| 7 | M | 78 | R | L | CR, PLIC, ALIC, GenIC, Thal, Put, CN, EC | 7 | 6 | 3 | 7 | Y |
| 8 | M | 64 | R | R | CR | 18 | 11 | 3 | 8 | Y |
| 9 | M | 80 | R | R | PLIC, Thal, CN | 5 | 1 | 53 | 59 | Y |
| 10 | M | 48 | R | L | CR | 7 | 6 | 34 | 43 | Y |
| 11 | M | 61 | R | R | CR | 11 | 17 | 3 | 6 | Y |
| 12 | F | 67 | R | R | BS | 14 | 4 | 37 | 55 | N |
| 13 | F | 83 | R | R | CR | 8 | 8 | 3 | 11 | Y |
| 14 | F | 73 | R | L | CR, PLIC, Put | 14 | 2 | 42 | 60 | Y |
| 15 | F | 68 | R | R | PLIC, Thal, Put | 9 | 2 | 19 | 21 | N |
| 16 | F | 77 | L | L | PLIC, GenIC | 11 | 6 | 2 | 11 | N |
| 17 | F | 90 | R | R | CR, PLIC, Put | 9 | 1 | 34 | 57 | N |
| 18 | M | 58 | R | L | PT, FT | 10 | 2 | 52 | 64 | N |
| 19 | M | 53 | R | R | CR, PLIC, GenIC, Thal, Put | 7 | 3 | 57 | 64 | Y |
| 20 | F | 69 | R | L | CR, PLIC | 9 | 3 | 31 | 43 | Y |
| 21 | F | 64 | R | L | BS | 15 | 5 | 41 | 51 | N |
| 22 | M | 31 | R | R | M1 | 11 | 2 | 37 | 54 | N |
| 23 | F | 79 | R | R | CR, PLIC | 4 | 5 | 3 | 12 | N |
| 24 | F | 72 | R | R | M1, PMC, Put, EC, FT | 5 | 12 | 0 | 5 | N |
| 25 | F | 43 | R | R | M1, PMC | 18 | 11 | 0 | 4 | N |
| 26 | F | 83 | R | R | CR, PLIC, ALIC, GenIC, Put | 22 | 9 | 0 | 4 | N |
| 27 | F | 67 | R | R | BS | 9 | 0 | 40 | 61 | Y |
| 28 | F | 76 | R | L | CR | 10 | 4 | 42 | 48 | N |
| 29 | F | 91 | R | L | BS | 5 | 7 | 41 | 60 | Y |
| 30 | F | 71 | R | L | BS | 12 | 9 | 19 | 18 | Y |
| Mean | 68 | 11 | 5 | 27 | 36 | |||||
| Min | 31 | 4 | 0 | 0 | 4 | |||||
| Max | 91 | 22 | 17 | 57 | 64 |
F = female; M = male; y = years; DH = dominant hand; R = right; L = left; SH = stroke-affected hemisphere; Lesion location: ALIC = anterior limb of the internal capsule; BS = brainstem; CN = caudate nucleus; CR = corona radiata; EC = external capsule; FT = frontal lobe; GenIC = genu of the internal capsule; M1 = primary motor cortex; PLIC = posterior limb of the internal capsule; PMC = premotor cortex; PT = parietal lobe; Put = putamen; Thal = thalamus; TP = temporal lobe; TSS = time since stroke when MRI was performed; d = days; NIHSS = National Institutes of Health Stroke Scale; ARAT = Action Research Arm Test; FM = Fugl-Meyer Upper Limb Scale; Edit = registered templates were edited as they encroached on the ventricles and/or thalamus.
Fig. 2.
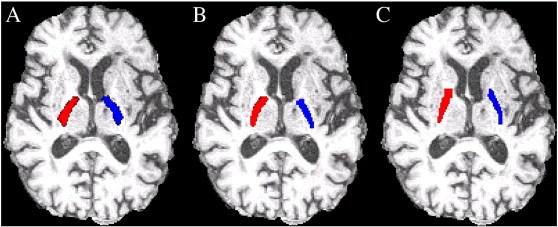
Examples of PLIC VOIs produced by the expert examiner. A) Registered template VOIs. B) Edited template VOIs. C) Manually delineated VOIs.
2.2. MR data acquisition
Scanning was performed using a Siemens Magnetom Avanto 1.5 T MRI system. To provide anatomical reference, T1-weighted images were obtained with a 3D MPRAGE sequence (TR = 11 ms, TE = 4.94 ms, field-of-view = 256 mm and voxel dimensions of 1.0 × 1.0 × 1.0 mm) aligned to an axial plane parallel to the anterior and posterior commissures (the AC–PC line).
Diffusion tensor imaging was conducted with a single shot spin echo EPI pulse sequence (factor = 128, TR = 6700 ms, TE = 101 ms, field-of-view = 230 mm and voxel dimensions of 1.8 × 1.8 × 3.0 mm) with 30 uniformly distributed (Stejskal and Tanner, 1965) motion-probing gradient orientations (β = 2000 s/mm2). Head movement was constrained with expandable foam cushions. MR images were visually inspected for motion artifact or instrumental noise. Scanning was repeated if major artifacts were present. Overall time in the scanner was approximately 20 min per participant.
2.3. Manual PLIC delineation
Each examiner pre-processed the images and manually delineated the PLIC VOIs using FSL (FMRIB Software Library, Oxford) (Smith et al., 2004; Woolrich et al., 2009). Four independent examiners (expert: V.K.; examiner 1: M.P.; examiner 2: C.Z.; examiner 3: E.V.) performed cross-sectional VOI delineation of each PLIC. V.K. is a neurologist with clinical experience in interpreting MR images, and hence was deemed to be an ‘expert’ examiner for the purposes of this study. The other 3 ‘novice’ examiners were medical researchers who had previous experience in identifying the pertinent structures. None of the examiners had prior experience in VOI drawing and so were trained in the use of the software packages and the required workflow.
Examiners used the T1-weighted images to delineate the PLICs and no other images were consulted while drawing in order to prevent any bias that FA maps could introduce when determining the PLIC borders. Training for the VOI drawing task was accomplished using previously delineated examples in reference atlases of healthy brains. Examiners were blinded to the other examiners' evaluations and to other marked-up scans of the same patient that they may have previously processed.
Delineation of the PLICs was performed in both the ipsilesional and contralesional hemisphere, in a voxel-wise fashion using the drawing tools in FSLView. Examiners worked on the axial plane and began at the inferior slice that best corresponded to the AC–PC line. In the case of complete destruction of the ipsilesional PLIC, the region was estimated as a mirror volume to the contralesional PLIC (Stinear et al., 2007). The PLIC typically occupied 20 or more image slices but examiners manually delineated the PLIC on the 10 most inferior slices to allow images to be processed in a timely manner.
2.4. Registration of template PLIC VOIs
Each examiner first skull stripped the structural T1-weighted images using the Brain Extraction Tool (BET) (Smith, 2002). This involved iteratively specifying a skull strip threshold value, visually confirming that the BET process had been completed satisfactorily, and repeating if necessary. DWIs were also skull stripped using BET, using the same iterative procedure.
The Johns Hopkins University (JHU) DTI-based atlas of white matter tracts (Hua et al., 2008; Mori et al., 2008; Wakana et al., 2007) was used to create the PLIC templates. FMRIB's Linear Image Registration Tool (Smith et al., 2004) was then used to perform a linear transform of the Montreal Neurological Institute (MNI152) template to native patient-space and apply that same transform to the PLIC templates. Linear registration was used, instead of non-linear registration; the latter has less clinical utility as it requires lesion masking and takes more time.
Registered template VOIs that encroached on the basal ganglia or ventricles were edited by each of the four examiners. Voxel-wise editing of the template PLIC (overlaid onto the axial view of each T1-weighted image) was performed using the drawing tools in FSLView (Smith et al., 2004; Woolrich et al., 2009). See Fig. 2 for example of PLIC VOIs produced by the expert examiner.
Fig. 1.
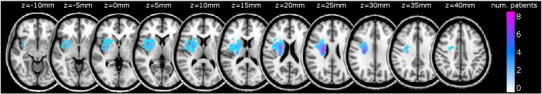
Lesion overlap map. Images have been flipped so all lesions appear in the right hemisphere.
2.5. Spatial similarity analysis
The Dice Similarity Index (DSI) (Dice, 1945) was used to quantify the spatial similarity between the VOIs produced by the expert examiner and each of the non-expert examiners. DSI ranges from 0 to 1 and is calculated to be twice the number of overlapping voxels between two VOIs, A and B, divided by the total number of voxels contained in both VOIs; DSIA,B = 2 × (A ∩ B) / (A ∪ B), where ∩ is the intersection and ∪ is the union. If two VOIs contain the same number of voxels, and 50% of their voxels overlap, this results in a DSI of 0.5.
2.6. Fractional anisotropy
Diffusion-weighted images were corrected for motion and eddy currents before using FMRIB's Diffusion Toolbox to compute diffusion tensors and FA maps. The FA maps were then registered to each participant's T1-weighted image, and masked using the PLIC VOIs produced by the four independent examiners. Mean FA values within the contralesional and ipsilesional VOIs were used to calculate FA asymmetry for each dataset. FA asymmetry values were calculated as: FA asymmetry = (FAC − FAI) / (FAC + FAI), where FAC = mean FA in the PLIC of the contralesional hemisphere and FAI = mean FA in the PLIC of the ipsilesional hemisphere, yielding a value between − 1.0 and + 1.0 for each participant. Zero indicates symmetrical mean FA in the PLICs and positive values indicate relatively reduced mean FA in the ipsilesional PLIC (Stinear et al., 2007). No provisions were made for handedness or sex, as previous research indicates that these factors do not influence FA values within the PLIC (Buchel et al., 2004; Takao et al., 2011; Westerhausen et al., 2007).
2.7. Statistical analysis
The sample size was calculated by determining the minimum number of participants required to detect an intra-class correlation coefficient of at least 0.8 for FA measures. With 4 independent examiners, α = 0.05 and β = 0.20, a minimum sample of 28 participants was required (Walter et al., 1998).
Spatial similarity between the PLIC VOIs produced by the expert and non-expert examiners was analyzed with a RM-ANOVA of the DSIs, with factors: method (manual, edited), examiner (1, 2, 3) and hemisphere (contralesional, ipsilesional). Mean FA values obtained from manually delineated and edited template VOIs were analyzed with a RM-ANOVA with factors: method (manual, edited), examiner (expert, 1, 2, 3) and hemisphere. FA asymmetry was analyzed with a RM-ANOVA with the factor examiner.
To investigate the inter-examiner reliability of the manually delineated and edited template methods, separate two-way random effects, absolute agreement intraclass correlation coefficients (ICC) for single measures were calculated using the mean FA values from the ipsi- and contralesional hemispheres and the FA asymmetry values. According to accepted criteria, ICC values of 0.11–0.2 are considered “slight” agreement, 0.21–0.4 are “fair”, 0.41–0.60 are “moderate”, 0.61–0.80 are “substantial”, and 0.81–1.0 are “almost perfect” agreement (Landis and Koch, 1977).
The ecological validity of the manual and edited VOI delineation methods was evaluated by calculating a simple linear regression between the contralesional FA, measured by each examiner, with age to see if the correlations were negative, as expected. Further validation was performed by calculating separate linear regressions between FA asymmetry and ARAT score, FM score, and NIHSS score. We expected each of these regressions to be significant, as correlations between motor deficit and FA asymmetry have been reported previously (Lindenberg et al., 2010; Puig et al., 2011; Stinear et al., 2007).
Statistical analyses were conducted using SPSS software (20.0 SPSS Inc., Chicago, USA). Statistical results were deemed significant if p < 0.05. Greenhouse–Geisser corrections were undertaken when sphericity was violated.
3. Results
The registered template VOIs were found to encroach on basal ganglia structures, ventricles or both in 13 of the 30 images. The examiners independently edited these templates, prior to calculation of mean FA values, FA asymmetry, and Dice Similarity Indices. The edited template dataset therefore contained data obtained using 13 edited and 17 unedited registered templates. The edited template dataset was compared with the manually delineated dataset.
There was a main effect of method on the spatial similarity of the PLIC VOIs (F1,29 = 9.41, p = 0.005). When the examiners edited templates as required, the non-expert examiners' VOIs were more spatially similar to the expert examiner's VOIs (edited mean DSI = 0.725, 95% CI 0.639–0.810; manual mean DSI = 0.588, 95% CI 0.559–0.617). There were no other main effects or interactions (all p > 0.05). The mean number of transverse slices included in the PLIC VOIs was 10 (range 9–15) for the manually delineated VOIs, and 20 (range 13–28) for the edited template VOIs.
For FA measured in the PLIC VOI of each hemisphere, there were main effects of method (F1,29 = 4.40, p = 0.045), hemisphere (F1,29 = 18.65, p < 0.001), and examiner (F3,87 = 17.99, p < 0.001), and no interactions (all p > 0.10). Overall, mean PLIC FA values were lower when templates were edited as required (edited mean FA = 0.461, 95% CI 0.443–0.479; manual mean FA = 0.472, 95% CI 0.456–0.489). As expected, mean FA values were higher in the contralesional PLIC VOI (contralesional mean FA = 0.498, 95% CI 0.484–0.512; ipsilesional mean FA = 0.436, 95% CI 0.408–0.464). The main effect of examiner arose because examiner 3 produced PLIC VOIs with both methods that resulted in higher FA values across both hemispheres (examiner 3 mean FA = 0.485, other examiners' mean FA = 0.461, 95% CI of the difference in means 0.017–0.031). The mean FA asymmetry was 0.07 (range − 0.04–0.43), with no effects of method or examiner (all p > 0.3).
Intraclass correlation coefficients indicated substantial agreement between examiners for the ipsilesional FA values produced by both the edited and manual methods (Table 2). Agreement was near perfect between examiners for the contralesional FA and FA asymmetry values produced by both the edited and manual methods.
Table 2.
Intraclass correlation coefficients, with 95% confidence intervals.
| Method | Measure |
||
|---|---|---|---|
| Contralesional FA | Ipsilesional FA | FA asymmetry | |
| Manual | 0.622 (0.414–0.784) | 0.870 (0.782–0.930) | 0.872 (0.792–0.930) |
| Edited | 0.617 (0.431–0.773) | 0.864 (0.778–0.925) | 0.896 (0.828–0.943) |
There were negative correlations between contralesional mean FA and age when examiners edited template VOIs as required, but not when they manually delineated the VOIs (Table 3). There were negative correlations between FA asymmetry and ARAT and FM scores, when examiners used both methods of VOI production. There were positive correlations between FA asymmetry and NIHSS score for 3 of the examiners when they manually delineated VOIs, and for all of the examiners when they edited template VOIs as required.
Table 3.
R values for linear regressions between FA parameters, age and clinical scores.
| Expert examiner | Examiner 1 | Examiner 2 | Examiner 3 | |
|---|---|---|---|---|
| Contralesional FA and age | ||||
| Manual | − 0.267 | − 0.360 | − 0.288 | − 0.192 |
| p = 0.153 | p = 0.050 | p = 0.123 | p = 0.309 | |
| Edited | − 0.529 | − 0.458 | − 0.512 | − 0.408 |
| p = 0.003 | p = 0.011 | p = 0.004 | p = 0.025 | |
| FA asymmetry and ARAT score | ||||
| Manual | − 0.430 | − 0.369 | − 0.422 | − 0.473 |
| p = 0.018 | p = 0.045 | p = 0.020 | p = 0.008 | |
| Edited | − 0.454 | − 0.458 | − 0.459 | − 0.439 |
| p = 0.012 | p = 0.011 | p = 0.011 | p = 0.015 | |
| FA asymmetry and FM score | ||||
| Manual | − 0.429 | − 0.375 | − 0.426 | − 0.458 |
| p = 0.018 | p = 0.041 | p = 0.019 | p = 0.011 | |
| Edited | − 0.412 | − 0.433 | − 0.437 | − 0.436 |
| p = 0.024 | p = 0.017 | p = 0.016 | p = 0.016 | |
| FA asymmetry and NIHSS score | ||||
| Manual | 0.369 | 0.347 | 0.403 | 0.420 |
| p = 0.045 | p = 0.060 | p = 0.027 | p = 0.021 | |
| Edited | 0.464 | 0.543 | 0.442 | 0.453 |
| p = 0.010 | p = 0.002 | p = 0.015 | p = 0.012 | |
4. Discussion
The main finding from this study is that multiple examiners can edit registered template PLIC VOIs as required and achieve greater spatial similarity and ecological validity than when they use a more time-consuming manual delineation method. Editing template PLIC VOIs seems viable in the clinical setting, and may allow the use of FA asymmetry measures for predicting motor recovery to become part of routine stroke rehabilitation practice.
The procedural skull-stripping required some decision-making by each examiner, as they iteratively determined the optimal threshold for the brain extraction tool. The subsequent registration of template PLIC VOIs to the participant's T1 image was relatively quick, but did not always account for anatomical variations that exist in older or stroke-affected brains (Fiez et al., 2000). The template PLICs were derived from a MRI database of 152 young adult brains (Mazziotta et al., 1995), so it is unsurprising that the template may not ideally fit older brains. Editing the registered PLIC VOIs was required for the scans of 13 out of 30 participants, to remove voxels that encroached on ventricles or basal ganglia gray matter.
The spatial similarity of the VOIs produced by the expert and non-expert examiners was higher when template VOIs were edited as required, compared to fully manual VOI delineation. The mean overlap of non-experts' VOIs with the expert's was 59% for manually delineated VOIs, and 73% for edited template VOIs. VOI delineation methods are highly sensitive to examiner effects, as the boundary of the fiber tract is often difficult to define and varies between examiners (Borich et al., 2012; Hong et al., 2008; Tang et al., 2010; Wang and Melhem, 2005; Yu et al., 2009). The decision on where to define VOI boundaries can result in substantial differences in mean FA values, even when the VOIs are centered on the same location (Basser and Pajevic, 2000). The present data indicate that editing registered template VOIs is less sensitive to examiner effects than manual drawing methods, as examiners effectively ‘start in the same place’. Written protocols, video-based tutorials, or DTI-specific training, have also been suggested as ways to reduce inter-examiner variability in MR analyses (Bonekamp et al., 2007; Brown et al., 2011).
We also found that manual delineation of PLIC VOIs produced higher overall mean FA values than edited template VOIs, possibly because the examiners more precisely excluded subcortical gray matter when drawing the VOIs by hand. However, it should also be noted that examiners only manually delineated PLIC VOIs for around 10 image slices, whereas the template VOIs extended more superiorly and included approximately 20 image slices. The superior portion of the PLIC, where it transitions to the corona radiata, may have lower FA values due to the ‘fanning out’ of axons and crossing fibers. This could contribute to the lower mean FA values obtained from both hemispheres when examiners edited template VOIs. One of the non-expert examiners produced consistently higher mean FA values than the other examiners. This was likely due to having a conservative bias and restricting the PLIC VOIs to a smaller volume, across both hemispheres and with both methods.
There were no effects of method or examiner on FA asymmetry, and both methods of VOI delineation resulted in ‘almost perfect’ agreement between examiners for FA asymmetry values, despite a lesser agreement between examiners for contralesional FA values (Table 2). This indicates that FA asymmetry is a more robust measure than mean FA values for clinical application in stroke. This is because FA asymmetry detects lateralized white matter damage while compensating for examiner effects and differing methodologies, and normalizes between-subject differences in overall white matter integrity. Furthermore, the FA asymmetry measures produced by both methods were ecologically valid, as they correlated as expected with clinical scores (Table 2) (Jang et al., 2005; Stinear et al., 2012; Thomalla et al., 2004; Watanabe et al., 2001; Yu et al., 2009).
Contralesional mean FA did not correlate with age when PLIC VOIs were manually delineated (Table 3). This may have been due to under-sampling of the FA data, as the manual VOIs were limited to 10 transverse slices by the time required to draw them. A potential advantage of editing template PLIC VOIs was that the templates had a greater volume, and more of the FA data were included in the subsequent analyses. When PLIC VOI templates were edited as required, contralesional mean FA was negatively correlated with age, as expected.
To date, a direct comparison between edited and manual methods of VOI-based analysis in the PLIC has not been conducted. Previous inter-examiner reliability comparisons have mainly used the tractography approach, and been performed either with healthy subjects or patients with other neurological conditions such as head injury or amyotrophic lateral sclerosis (Borich et al., 2012; Hong et al., 2008; Ozturk et al., 2008; Qiu et al., 2011; Tang et al., 2010; Wakana et al., 2007; Zhang et al., 2008). One study that did investigate inter-examiner reliability using the manual method in chronic well-recovered stroke patients reported inter-examiner reliability values of ICC(3,1) = 0.37 for the contralesional side and ICC(3,1) = 0.72 for the ipsilesional side (Borich et al., 2012). Our study sample size is relatively large and employed more examiners compared to other related reliability studies in stroke patients (Borich et al., 2012; Qiu et al., 2011; Tang et al., 2010). The participant group was more heterogeneous for age, functional impairment and lesion location. None of the participants had a history of previous stroke and the time delay between stroke onset and MRI acquisition was relatively short. Participants also had greater upper limb impairment overall, indicating worse stroke severity compared to subjects in previous studies (Borich et al., 2012; Qiu et al., 2011; Tang et al., 2010).
The heterogeneous nature of our study sample and the enrolment of 4 examiners pose a more realistic challenge to the reliability and validity of each method in a clinical setting. We found that editing registered template PLIC VOIs as required allowed more of the PLIC to be included in analyses and improved the spatial similarity of VOIs between examiners, while avoiding examiner effects on subsequent FA measures and improving their ecological validity. We propose that editing registered template PLIC VOIs as required is feasible in a busy clinical environment, and may allow the use of FA parameters for prognoses at the sub-acute stage for post-stroke recovery of motor function.
Acknowledgments
Thanks to the staff of the Centre for Advanced Magnetic Resonance Imaging (CAMRI) at The University of Auckland, New Zealand.
Sources of funding
This study was funded by the Health Research Council of New Zealand, and the Stroke Foundation (Northern Region) of New Zealand.
Disclosures: None.
References
- Ashton E.A., Takahashi C., Berg M.J., Goodman A., Totterman S., Ekholm S. Accuracy and reproducibility of manual and semiautomated quantification of MS lesions by MRI. J. Magn. Reson. Imaging. 2003;17:300–308. doi: 10.1002/jmri.10258. [DOI] [PubMed] [Google Scholar]
- Basser P.J. Inferring microstructural features and the physiological state of tissues from diffusion-weighted images. NMR Biomed. 1995;8:333–344. doi: 10.1002/nbm.1940080707. [DOI] [PubMed] [Google Scholar]
- Basser P.J., Pajevic S. Statistical artifacts in diffusion tensor MRI (DT-MRI) caused by background noise. Magn. Reson. Med. 2000;44:41–50. doi: 10.1002/1522-2594(200007)44:1<41::aid-mrm8>3.0.co;2-o. [DOI] [PubMed] [Google Scholar]
- Basser P.J., Pierpaoli C. Microstructural and physiological features of tissues elucidated by quantitative-diffusion-tensor MRI. J. Magn. Reson. B. 1996;111:209–219. doi: 10.1006/jmrb.1996.0086. [DOI] [PubMed] [Google Scholar]
- Bonekamp D., Nagae L.M., Degaonkar M., Matson M., Abdalla W.M., Barker P.B. Diffusion tensor imaging in children and adolescents: reproducibility, hemispheric, and age-related differences. Neuroimage. 2007;34:733–742. doi: 10.1016/j.neuroimage.2006.09.020. [DOI] [PMC free article] [PubMed] [Google Scholar]
- Borich M.R., Wadden K.P., Boyd L.A. Establishing the reproducibility of two approaches to quantify white matter tract integrity in stroke. Neuroimage. 2012;59(3):2393–2400. doi: 10.1016/j.neuroimage.2011.09.009. [DOI] [PMC free article] [PubMed] [Google Scholar]
- Brown G.G., Mathalon D.H., Stern H., Ford J., Mueller B., Greve D.N. Multisite reliability of cognitive bold data. Neuroimage. 2011;54:2163–2175. doi: 10.1016/j.neuroimage.2010.09.076. [DOI] [PMC free article] [PubMed] [Google Scholar]
- Buchel C., Raedler T., Sommer M., Sach M., Weiller C., Koch M.A. White matter asymmetry in the human brain: a diffusion tensor MRI study. Cereb. Cortex. 2004;14:945–951. doi: 10.1093/cercor/bhh055. [DOI] [PubMed] [Google Scholar]
- Chung H.-W., Chou M.-C., Chen C.-Y. Principles and limitations of computational algorithms in clinical diffusion tensor MR tractography. Am. J. Neuroradiol. 2011;32:3–13. doi: 10.3174/ajnr.A2041. [DOI] [PMC free article] [PubMed] [Google Scholar]
- Ciccarelli O., Catani M., Johansen-Berg H., Clark C., Thompson A. Diffusion-based tractography in neurological disorders: concepts, applications, and future developments. Lancet Neurol. 2008;7:715–727. doi: 10.1016/S1474-4422(08)70163-7. [DOI] [PubMed] [Google Scholar]
- Dice L.R. Measures of the amount of ecologic association between species. Ecology. 1945;26:297–302. [Google Scholar]
- Eckert M.A., Lombardino L.J., Walczak A.R., Bonihla L., Leonard C.M., Binder J.R. Manual and automated measures of superior temporal gyrus asymmetry: concordant structural predictors of verbal ability in children. Neuroimage. 2008;41:813–822. doi: 10.1016/j.neuroimage.2008.03.002. [DOI] [PMC free article] [PubMed] [Google Scholar]
- Fiez J.A., Damasio H., Grabowski T.J. Lesion segmentation and manual warping to a reference brain: intra- and interobserver reliability. Hum. Brain Mapp. 2000;9:192–211. doi: 10.1002/(SICI)1097-0193(200004)9:4<192::AID-HBM2>3.0.CO;2-Y. [DOI] [PMC free article] [PubMed] [Google Scholar]
- Fugl-Meyer A.R., Jaasko L., Leyman I., Olsson S., Steglind S. The post-stroke hemiplegic patient. 1. A method for evaluation of physical performance. Scand. J. Rehabil. Med. 1975;7:13–31. [PubMed] [Google Scholar]
- Holodny A.I., Gor D.M., Watts R., Gutin P.H., Ulug A.M. Diffusion-tensor MR tractography of somatotopic organization of corticospinal tracts in the internal capsule: initial anatomic results in contradistinction to prior reports. Radiology. 2005;234:649–653. doi: 10.1148/radiol.2343032087. [DOI] [PubMed] [Google Scholar]
- Hong Y.H., Sung J.J., Kim S.M., Park K.S., Lee K.W., Chang K.H. Diffusion tensor tractography-based analysis of the pyramidal tract in patients with amyotrophic lateral sclerosis. J. Neuroimaging. 2008;18:282–287. doi: 10.1111/j.1552-6569.2007.00153.x. [DOI] [PubMed] [Google Scholar]
- Hua K., Zhang J.Y., Wakana S., Jiang H.Y., Li X., Reich D.S. Tract probability maps in stereotaxic spaces: analyses of white matter anatomy and tract-specific quantification. Neuroimage. 2008;39:336–347. doi: 10.1016/j.neuroimage.2007.07.053. [DOI] [PMC free article] [PubMed] [Google Scholar]
- Jang S.H. Prediction of motor outcome for hemiparetic stroke patients using diffusion tensor imaging: a review. NeuroRehabilitation. 2010;27:367–372. doi: 10.3233/NRE-2010-0621. [DOI] [PubMed] [Google Scholar]
- Jang S.H., Cho S.H., Kim Y.H., Han B.S., Byun W.M., Son S.M. Diffusion anisotrophy in the early stages of stroke can predict motor outcome. Restor. Neurol. Neurosci. 2005;23:11–17. [PubMed] [Google Scholar]
- Jang S.H., Bai D., Son S.M., Lee J., Kim D.S., Sakong J. Motor outcome prediction using diffusion tensor tractography in pontine infarct. Ann. Neurol. 2008;64:460–465. doi: 10.1002/ana.21444. [DOI] [PubMed] [Google Scholar]
- Karnath H.O., Perenin M.T. Cortical control of visually guided reaching: evidence from patients with optic ataxia. Cereb. Cortex. 2005;15:1561–1569. doi: 10.1093/cercor/bhi034. [DOI] [PubMed] [Google Scholar]
- Landis J.R., Koch G.G. The measurement of observer agreement for categorical data. Biometrics. 1977;33:159–174. [PubMed] [Google Scholar]
- Lindenberg R., Renga V., Zhu L.L., Betzler F., Alsop D., Schlaug G. Structural integrity of corticospinal motor fibers predicts motor impairment in chronic stroke. Neurology. 2010;74:280–287. doi: 10.1212/WNL.0b013e3181ccc6d9. [DOI] [PMC free article] [PubMed] [Google Scholar]
- Lyle R.C. A performance test for assessment of upper limb function in physical rehabilitation treatment and research. Int. J. Rehabil. Res. 1981;4:483–492. doi: 10.1097/00004356-198112000-00001. [DOI] [PubMed] [Google Scholar]
- Maeda T., Ishizaki K., Yura S. Can diffusion tensor imaging predict the functional outcome of supra-tentorial stroke? No To Shinkei. 2005;57:27–32. [PubMed] [Google Scholar]
- Mazziotta J.C., Toga A.W., Evans A., Fox P., Lancaster J. A probabilistic atlas of the human brain — theory and rationale for its development. Neuroimage. 1995;2:89–101. doi: 10.1006/nimg.1995.1012. [DOI] [PubMed] [Google Scholar]
- Mori S., van Zijl P.C.M. Fiber tracking: principles and strategies — a technical review. NMR Biomed. 2002;15:468–480. doi: 10.1002/nbm.781. [DOI] [PubMed] [Google Scholar]
- Mori S., Oishi K., Jiang H.Y., Jiang L., Li X., Akhter K. Stereotaxic white matter atlas based on diffusion tensor imaging in an ICBM template. Neuroimage. 2008;40:570–582. doi: 10.1016/j.neuroimage.2007.12.035. [DOI] [PMC free article] [PubMed] [Google Scholar]
- Moro V., Urgesi C., Pernigo S., Lanteri P., Pazzaglia M., Aglioti S.M. The neural basis of body form and body action agnosia. Neuron. 2008;60:235–246. doi: 10.1016/j.neuron.2008.09.022. [DOI] [PubMed] [Google Scholar]
- Mort D.J., Malhotra P., Mannan S.K., Rorden C., Pambakian A., Kennard C. The anatomy of visual neglect. Brain. 2003;126:1986–1997. doi: 10.1093/brain/awg200. [DOI] [PubMed] [Google Scholar]
- Ozturk A., Sasson A.D., Farrell J.A., Landman B.A., da Motta A.C., Aralasmak A. Regional differences in diffusion tensor imaging measurements: assessment of intrarater and interrater variability. Am. J. Neuroradiol. 2008;29:1124–1127. doi: 10.3174/ajnr.A0998. [DOI] [PMC free article] [PubMed] [Google Scholar]
- Park J.K., Kim B.S., Choi G., Kim S.H., Choi J.C., Khang H. Evaluation of the somatotopic organization of corticospinal tracts in the internal capsule and cerebral peduncle: results of diffusion-tensor MR tractography. Korean J. Radiol. 2008;9:191–195. doi: 10.3348/kjr.2008.9.3.191. [DOI] [PMC free article] [PubMed] [Google Scholar]
- Puig J., Pedraza S., Blasco G., Daunis-i-Estadella J., Prados F., Remollo S. Acute damage to the posterior limb of the internal capsule on diffusion tensor tractography as an early imaging predictor of motor outcome after stroke. Am. J. Neuroradiol. 2011;32:857–863. doi: 10.3174/ajnr.A2400. [DOI] [PMC free article] [PubMed] [Google Scholar]
- Qiu M., Darling W.G., Morecraft R.J., Ni C.C., Rajendra J., Butler A.J. White matter integrity is a stronger predictor of motor function than BOLD response in patients with stroke. Neurorehabil. Neural Repair. 2011;25:275–284. doi: 10.1177/1545968310389183. [DOI] [PMC free article] [PubMed] [Google Scholar]
- Seghier M.L., Ramlackhansingh A., Crinion J., Leff A.P., Price C.J. Lesion identification using unified segmentation-normalisation models and fuzzy clustering. Neuroimage. 2008;41:1253–1266. doi: 10.1016/j.neuroimage.2008.03.028. [DOI] [PMC free article] [PubMed] [Google Scholar]
- Smith S.M. Fast robust automated brain extraction. Hum. Brain Mapp. 2002;17:143–155. doi: 10.1002/hbm.10062. [DOI] [PMC free article] [PubMed] [Google Scholar]
- Smith S.M., Jenkinson M., Woolrich M.W., Beckmann C.F., Behrens T.E.J., Johansen-Berg H. Advances in functional and structural MR image analysis and implementation as FSL. Neuroimage. 2004;23:S208–S219. doi: 10.1016/j.neuroimage.2004.07.051. [DOI] [PubMed] [Google Scholar]
- Stejskal E.O., Tanner J.E. Spin diffusion measurements: spin echoes in the presence of a time-dependent field gradient. J. Chem. Phys. 1965;42:288–292. [Google Scholar]
- Stinear C.M., Barber P.A., Smale P.R., Coxon J.P., Fleming M.K., Byblow W.D. Functional potential in chronic stroke patients depends on corticospinal tract integrity. Brain. 2007;130:170–180. doi: 10.1093/brain/awl333. [DOI] [PubMed] [Google Scholar]
- Stinear C.M., Barber P.A., Petoe M., Anwar S., Byblow W.D. The PREP algorithm predicts potential for upper limb recovery after stroke. Brain. 2012;135(Pt 8):2527–2535. doi: 10.1093/brain/aws146. [DOI] [PubMed] [Google Scholar]
- Takao H., Abe O., Yamasue H., Aoki S., Sasaki H., Kasai K. Gray and white matter asymmetries in healthy individuals aged 21–29 years: a voxel-based morphometry and diffusion tensor imaging study. Hum. Brain Mapp. 2011;32:1762–1773. doi: 10.1002/hbm.21145. [DOI] [PMC free article] [PubMed] [Google Scholar]
- Tang P.F., Ko Y.H., Luo Z.A., Yeh F.C., Chen S.H.A., Tseng W.Y.I. Tract-specific and region of interest analysis of corticospinal tract integrity in subcortical ischemic stroke: reliability and correlation with motor function of affected lower extremity. Am. J. Neuroradiol. 2010;31:1023–1030. doi: 10.3174/ajnr.A1981. [DOI] [PMC free article] [PubMed] [Google Scholar]
- Thomalla G., Glauche V., Koch M.A., Beaulieu C., Weiller C., Rother J. Diffusion tensor imaging detects early Wallerian degeneration of the pyramidal tract after ischemic stroke. Neuroimage. 2004;22:1767–1774. doi: 10.1016/j.neuroimage.2004.03.041. [DOI] [PubMed] [Google Scholar]
- Wakana S., Caprihan A., Panzenboeck M.M., Fallon J.H., Perry M., Gollub R.L. Reproducibility of quantitative tractography methods applied to cerebral white matter. Neuroimage. 2007;36:630–644. doi: 10.1016/j.neuroimage.2007.02.049. [DOI] [PMC free article] [PubMed] [Google Scholar]
- Walter S.D., Eliasziw M., Donner A. Sample size and optimal designs for reliability studies. Stat. Med. 1998;17:101–110. doi: 10.1002/(sici)1097-0258(19980115)17:1<101::aid-sim727>3.0.co;2-e. [DOI] [PubMed] [Google Scholar]
- Wang S., Melhem E.R. Amyotrophic lateral sclerosis and primary lateral sclerosis: the role of diffusion tensor imaging and other advanced MR-based techniques as objective upper motor neuron markers. Ann. N. Y. Acad. Sci. 2005;1064:61–77. doi: 10.1196/annals.1340.013. [DOI] [PubMed] [Google Scholar]
- Watanabe T., Honda Y., Fujii Y., Koyama M., Matsuzawa H., Tanaka R. Three-dimensional anisotropy contrast magnetic resonance axonography to predict the prognosis for motor function in patients suffering from stroke. J. Neurosurg. 2001;94:955–960. doi: 10.3171/jns.2001.94.6.0955. [DOI] [PubMed] [Google Scholar]
- Werring D.J., Toosy A.T., Clark C.A., Parker G.J., Barker G.J., Miller D.H. Diffusion tensor imaging can detect and quantify corticospinal tract degeneration after stroke. J. Neurol. Neurosurg. Psychiatry. 2000;69:269–272. doi: 10.1136/jnnp.69.2.269. [DOI] [PMC free article] [PubMed] [Google Scholar]
- Westerhausen R., Huster R.J., Kreuder F., Wittling W., Schweiger E. Corticospinal tract asymmetries at the level of the internal capsule: is there an association with handedness? Neuroimage. 2007;37:379–386. doi: 10.1016/j.neuroimage.2007.05.047. [DOI] [PubMed] [Google Scholar]
- Wilke M., de Haan B., Juenger H., Karnath H.-O. Manual, semi-automated, and automated delineation of chronic brain lesions: a comparison of methods. Neuroimage. 2011;56:2038–2046. doi: 10.1016/j.neuroimage.2011.04.014. [DOI] [PubMed] [Google Scholar]
- Woolrich M.W., Jbabdi S., Patenaude B., Chappell M., Makni S., Behrens T. Bayesian analysis of neuroimaging data in FSL. Neuroimage. 2009;45:S173–S186. doi: 10.1016/j.neuroimage.2008.10.055. [DOI] [PubMed] [Google Scholar]
- Yu C.S., Zhu C.Z., Zhang Y.J., Chen H., Qin W., Wang M.L. A longitudinal diffusion tensor imaging study on Wallerian degeneration of corticospinal tract after motor pathway stroke. Neuroimage. 2009;47:451–458. doi: 10.1016/j.neuroimage.2009.04.066. [DOI] [PubMed] [Google Scholar]
- Zhang W., Olivi A., Hertig S.J., van Zijl P., Mori S. Automated fiber tracking of human brain white matter using diffusion tensor imaging. Neuroimage. 2008;42:771–777. doi: 10.1016/j.neuroimage.2008.04.241. [DOI] [PMC free article] [PubMed] [Google Scholar]
- Zhu L.L., Lindenberg R., Alexander M.P., Schlaug G. Lesion load of the corticospinal tract predicts motor impairment in chronic stroke. Stroke. 2010;41(5):910–915. doi: 10.1161/STROKEAHA.109.577023. [DOI] [PMC free article] [PubMed] [Google Scholar]