Abstract
Background
Evaluation of glucose tolerance in rodent models is usually performed after intraperitroneal administration of glucose (IPGTT) whereas in humans the test is performed with oral glucose. Hyperglycemia is a major clinical manifestation of burn injury. Our previous studies using IPGTT have demonstrated burn injury induced insulin resistance and the beneficial effects of GLP-1 in improving insulin resistance. The goal of the present study was to compare the results of these two procedures under 1) burn injury induced insulin resistance, and 2) GLP-1 treatment after burn.
Methods
Male CD rats were divided into three groups. Sham Burn (SB), Burn (B) and Burn + GLP-1 treatment (B+GLP). Blood glucose and plasma insulin were measured during intragastric glucose tolerance test (IGGTT) on day 6 after 40% full thickness burn injury. The results were compared with our previous IPGTT.
Results
Blood glucose curves for IGGTT and IPGTT showed a similar pattern. However, IGGTT demonstrated a significant lower level of maximal blood glucose compared with IPGTT. This was accompanied by higher peak insulin levels in both SB and B groups. In contrast, peak insulin levels of each B+GLP group were similar.
Conclusion
1) Both IPGTT and IGGTT demonstrated burn injury induced insulin resistance and the efficacy of GLP-1 for reducing hyperglycemia after burn injury. 2) The observed differences in the plasma glucose and insulin levels between IGGTT and IPGTT suggest that endogenously produced GLP-1 during the IGGTT may play a role in ameliorating insulin resistance after burn injury.
Keywords: burn, hyperglycemia, gulcagon-like peptide 1, intragastric glucose tolerance test
INTRODUCTION
Evaluation of glucose tolerance in rodent models is important for studying interventions for treating insulin resistance after burn injury and is usually performed after intraperitroneal administration of glucose (IPGTT) whereas in humans the test is performed with oral glucose (OGTT). The primary goal of the present study was to compare the results of these procedures in rats after burn injury and also to compare response to GLP-1 treatment in the two models. Our hypothesis is that both procedures provide comparable results.
A major metabolic response to injury is the presence of hyperglycemia and glucose intolerance as the consequence of insulin resistance1, 2. Currently continuous insulin infusion protocols have become part of the standard care of severely burned patients and have proven to significantly reduce mortality and morbidity3-5. The major problems associated with continuous insulin infusion protocols are increased risk of hypoglycemia and workload for the bedside caregivers 6-9. GLP-1 is a naturally occurring intestinal peptide hormone that was discovered in the mid 1980s10. Although it has several modes of action, the most intriguing is its insulinomimetic properties that are dependent on serum glucose levels11. Our previous animal experiments showed the efficiency of GLP-1 for reducing glucose intolerance and ameliorating burn induced insulin resistance in a rat burn model, in which the intraperitoneal glucose tolerance test (IPGTT) was used14. The present study was designed to compare the results of IPGTT and IGGTT which mimics the oral glucose tolerance test conducted in human subjects. We compare these results under two burn injury insulin resistance conditions: burn injury versus sham burn and burn injury with and without GLP-1 treatment.
MATERIALS AND METHODS
Animal model
A total of 21 male CD rats (Charles River Breeding Lab, Wilmington, MA) weighing ~400 grams (416.6±14.3g, Mean ± SD) were divided into three groups: burn injury with saline treatment (B), burn injury with GLP-1 treatment (B+GLP) and sham burn (SB). Animals were housed in the Center for Comparative Medicine (CCM) of the Massachusetts General Hospital. The animals were acclimatized to the environment for at least 5 days after delivery and were maintained on a regular 12-h light/dark cycle (6:00 PM to 6:00 AM) with free access to food and water.
Placement of Intragastric Catheters for IGGTT
Since gavage cause stress to the animals which affects blood glucose concentrations and hence the accuracy of IGGTT results, gastrostomy was performed for administration of glucose into stomach for IGGTT. The procedures are described as follows. Three days before burn injury, the rats were anesthetized by intraperitoneal injection of Ketamine 100 mg/kg of body weight (Fort Dodge Animal Health, Fort Dodge, Iowa) and Xylazine 10 mg/kg of body weight (Ben Venue Laboratories, Bedford, Ohio). A laparotomy was performed through an upper midline incision measuring 1.5 cm. The stomach wall was punctured using scissors, and a silicone tube (0.64 mm inner diameter and 1.19 mm outer diameter; Dow Coming, Midland, Michigan) was inserted into the stomach through the puncture site. The gastrostomy catheter was secured on the gastric and peritoneal walls. Gastric and peritoneal walls of the puncture sites were adhered together to avoid peritonitis. The distal end of the catheter was tunneled subcutaneously, exteriorized in the interscapular area and capped with stainless steel plugs (0.03 IN, SmallParts, Seattle, Washington). The animals were allowed to recover from the procedure for three days (day -3 to day 0).
Burn Injury and implantation of vascular catheters
On day 0, the animals were anesthetized by intraperitoneal injection of Ketamine 100 mg/kg of body weight (Fort Dodge Animal Health, Fort Dodge, Iowa) and Xylazine 10 mg/kg of body weight (Ben Venue Laboratories, Bedford, Ohio). Polyethylene catheters (Braintree Scientific, Inc, MA) were implanted into the left carotid artery and jugular vein. The latter was connected to a micro-osmotic pump (Alzet model 2001, Cupertino, CA) containing either GLP-1 (GLP-1 7-36 peptide, Sigma-Aldrich Corp, Louis, MO), 1 mg/ml (pumping rate 1μl/h; B+GLP-1 group) or saline (SB and B groups). Thus, GLP-1 was delivered intravenously at a rate of approximately 40 ng/kg /min. All catheters were filled with heparin-saline (100 unit/ml) and capped with stainless steel plugs (LS22, Instech Solomon, Plymouth Meeting, PA). The micro osmotic pumps were embedded under the skin of the neck. After removal of fur from the dorsal surface of each animal, a full-thickness thermal injury of 40% total body surface area (TBSA) was produced by placing the animal in a template exposing 40% TBSA to boiling water for 10 sec. All animals received resuscitation by intra-peritoneal injection of saline (40 ml/kg). They were housed in individual metal cages with free access to food and water; daily food intake was monitored. Sham burned rats were treated in the same manner as the burned animals except being exposed to room temperature water.
Intragastric Glucose Tolerance Test (IGGTT)
Intragastric glucose tolerance tests (IGGTT) were performed on day 6 post-burn injury. Considering the significant first-pass uptake of glucose by the splanchnic region after oral glucose administration19, all animals received 2 g/kg of glucose via the indwelling gastric tube for IGGTT. After an overnight fast (from 5 pm to 8 am), the arterial catheter was connected to a Miniature Tubing Injection Port (SIP22/4, Instech Solomon, Plymouth Meeting, PA) for non-invasive blood sampling. A fasting arterial blood sample (0.4 ml) was collected into a tube containing dipeptidyl peptidase IV inhibitor (DPP4-010, Linco Research, Inc., St. Charles, MA) for the determination of baseline blood glucose and plasma insulin levels. Each animal then received an intragastric injection of 50% glucose solution (2 g/kg body weight) and additional blood samples were drawn at 5, 10, 15, 30, 60 and 120 min after glucose administration. The concentrations of blood glucose were determined with a blood glucose meter (Ascensia, Bayer Corporation, Mishawaka, IN). The plasma was immediately separated by centrifugation (1000 g ×10 min at 4°C) and stored at −80°C for determination of insulin levels. Meso Scale Discovery Kits (A division of Meso Scale Diagnostics, LLC, Gaithersburg, MD) were used to measure plasma levels of insulin. The procedures are similar to those described in our previous publication14. The IPGTT studies were performed by procedures that are in routine use in our laboratory (14).
Statistical Analysis and comparing with IPGTT
All results were expressed as mean ± SEM. Blood glucose / plasma insulin ratio and areas under the curves (AUC) for blood glucose and plasma insulin levels following injection were calculated and compared with the IPGTT results of our previous study.14 The trapezoidal rule was used for calculating AUC. Statistical analysis was performed by one or two-way analysis of variance and individual means were compared by the Student-Neuman-Keul’s test. P values less than 0.05 were considered to be statistically significant.
RESULTS
Intragastric Glucose Tolerance Test (IGGTT): Blood Glucose Levels
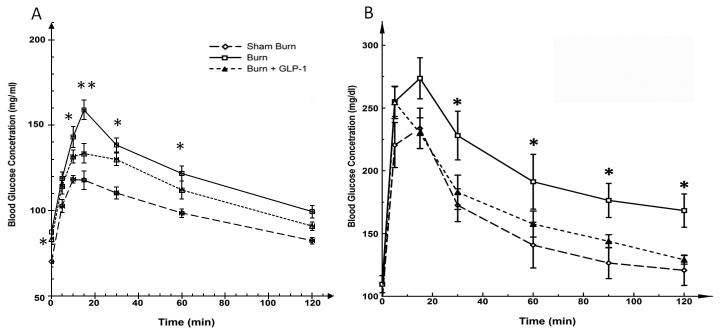
The results of the IGGTTs are shown in Figure 1A. On post-burn day 6, there was a significant difference in fasting glucose levels among these groups (F=9.024, P<0.01), B vs. SB groups (mean ± SEM; 87.4±3.4 vs. 70.0±3.0 mg/dl, P<0.01). Fasting glucose levels in B+GLP-1 animals (83.4±2.5 mg/dl) were significantly lower than in B animals (P<0.05). There was no significant difference in plasma glucose levels at 5 and 120 min post glucose injection among the three groups. However, at all other time points, plasma glucose levels remained significantly higher in the B group, as compared with the SB group (P<0.01) and the B+GLP-1 group (15 min: P<0.01, 10, 30, 60 min: P<0.05). Blood glucose curves showed a similar pattern compared with 1 B, further confirming the efficiency of GLP-1 in reducing burn injury induced hyperglycemia. Furthermore, the IGGTT study demonstrated a significantly lower level of maximal blood glucose compared with the IPGTT study in all groups (B groups: 159.0±5.8 vs. 273.7±16.4 mg/dl; p<0.01, SB groups: 118.3±2.1 vs. 234±16 mg/dl; p<0.01, B+GLP groups: 133.4±5.7 vs. 255±13 mg/dl; p<0.01).
Figure 1.
A; Blood Glucose Levels during IGGTT. Fasting glucose levels were significantly different among the groups. B showed the highest level and it was reduced in B+GLP-1 animals. At time points 10, 15, 30, 60 min, plasma glucose levels were significantly higher in the B group, as compared with the SB and B+GLP-1 groups. 1B: Blood Glucose Levels with IPGTT. The blood glucose curves in Figures 1A and 1B showed a similar pattern, confirming the efficiency of GLP-1 in reducing burn injury induced hyperglycemia. The IGGTT study demonstrated a significantly lower level of maximal blood glucose compared with the IPGTT study in all groups of animals, demonstrating the difference of blood glucose responses to different routes of glucose administration.
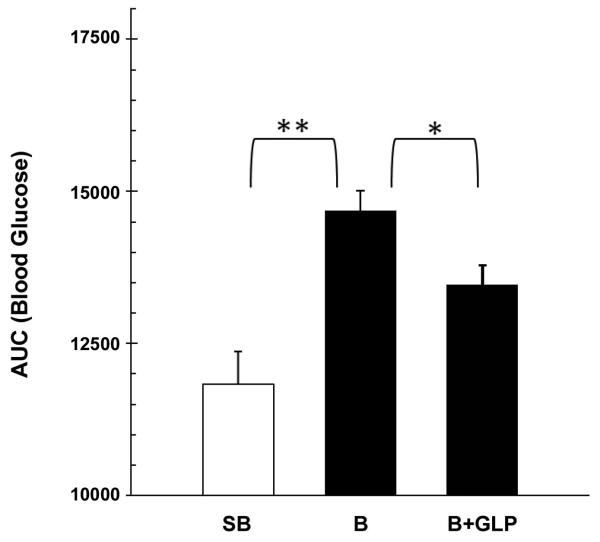
AUCs of the blood glucose response curves (0 min to 120 min.) are shown in Figure 2. One-way ANOVA demonstrated a significant difference among the three groups (F= 17.54, P<0.01). Individual means showed higher AUC in the B group as compared to the SB (P<0.01) and B+GLP-1 group (P<0.05), indicating that GLP-1 treatment improves glucose tolerance in burned animals. The findings were in general agreement with the results of IPGTT.
Figure 2.
AUC’s for the blood glucose response curves during IGGTT. The results demonstrated that GLP-1 treatment improves glucose tolerance in burned animals.
Intragastric Glucose Tolerance Test (IGGTT): Plasma Insulin Levels
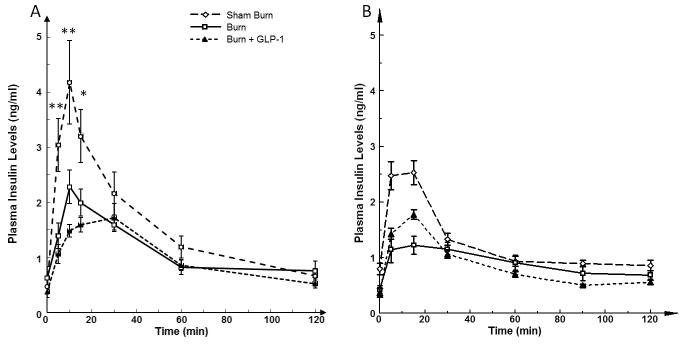
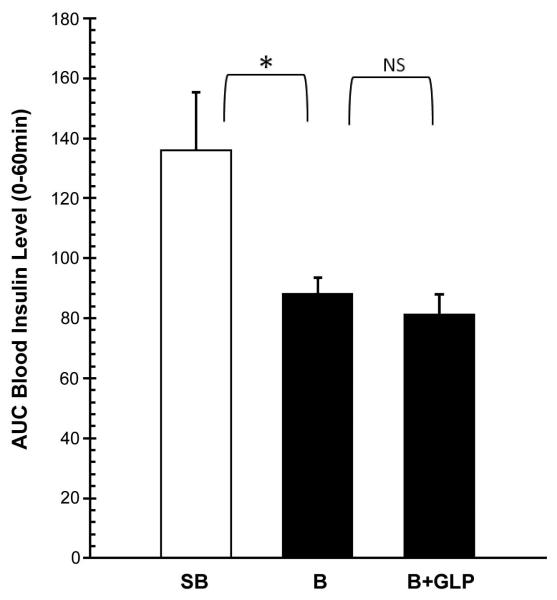
The insulin levels in the 3 groups of animals before and during the IGGTT are shown in Figure 3A. On post-burn day 6, there was no significant difference in fasting insulin levels among these three groups. However, following bolus intragastric injection of glucose during the IGGTT, there was an immediate increase in plasma insulin levels that were significantly different in all 3 groups of animals (5, 10min: P<0.01, 15 min: P<0.05). The peak insulin level was significantly lower in the B group as compared to the SB group (2.28±0.30 vs. 4.18±0.76 ng/ml; P<0.05). Conversely, insulin levels in the B group were significantly higher than in the B+GLP group (2.28±0.30 vs. 1.72±0.26 ng/ml; P<0.05). AUCs of the plasma insulin response curves (0 min to 60 min.) are shown in Figure 4. One-way ANOVA demonstrated a significant difference among the three groups (F= 5.979, P<0.05). Individual means showed significantly lower AUC in the B group as compared to the SB (P<0.05). There was no significant difference in AUC between the B and B+GLP groups.
Figure 3.
A; Plasma levels of Insulin during IGGTT. There was no significant difference in fasting insulin levels among these three groups. IGGTT resulted in immediate increase in plasma insulin levels that were significantly different in all 3 groups of animals. The peak insulin level was significantly lower in the B group as compared to the SB group. Conversely, the peak insulin level in B group was significantly higher than that of the B+GLP group. 3B; Plasma Insulin Levels with IPGTT, Comparing 3A and 3B, the maximal plasma insulin level was much higher in IGGTT versus IPGTT in both SB and B groups. Such difference was not seen in both G+GLP groups.
Figure 4.
AUC’s for the plasma insulin response curves of IGGTT (0-60 min.). The AUC’s were different among the three groups. SB group showed significantly higher AUC than B group. There was no significant difference in AUC between B and B+GLP.
Comparison between IGGTT and IPGTT
Blood glucose curves for IGGTT and IPGTT showed a similar pattern, further confirming the efficiency of GLP-1 in reducing burn injury induced hyperglycemia (Figure 1AB). Furthermore, the IGGTT study demonstrated a significantly lower level of maximal blood glucose compared with the IPGTT study in all groups (B groups: 159.0±5.8 vs. 273.7±16.4 mg/dl; p<0.01, SB groups: 118.3±2.1 vs. 234±16 mg/dl; p<0.01, B+GLP groups: 133.4±5.7 vs. 255±13 mg/dl; p<0.01). This was accompanied by a much higher peak insulin level in both SB (4.18±0.76 vs. 2.53 ±0.21 ng/ml; p<0.01) and B (2.28±0.30 vs. 1.23±0.16 ng/ml; p<0.01) groups (Figure 3AB). Hence, intragastric glucose more efficiently stimulated insulin production compared to intraperitoneal glucose. On the other hand, peak insulin levels of each B-GLP group showed similar levels (1.72±0.26 vs.1.78±0.09 ng/ml; NS).
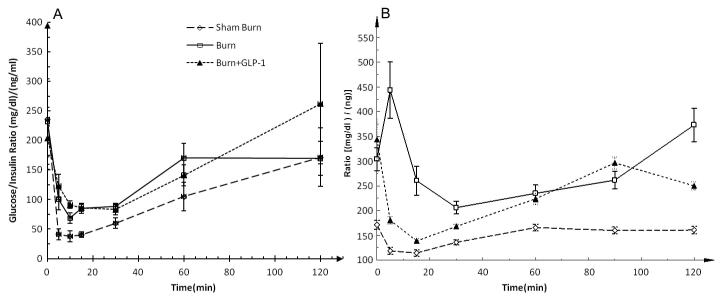
Blood glucose / plasma insulin ratios during IGGTT (Figure 5A) decreased immediately to the lowest levels after glucose load and then gradually reverted to initial concentrations in all three groups. These curves exhibited a pattern similar to the blood glucose / plasma insulin ratio of the SB and B+GLP groups measured by IPGTT (Figure 5B). However, there was an immediate increase after glucose load in only the B group of IPGTT. The IGGTT study alternately demonstrated a significantly lower level of minimum ratio compared with the IPGTT study in all groups (SB: 37.73±9.07 vs. 114.46±6.37 ng/ml; p<0.01, B: 68.67±8.71 vs. 206.16 ±12.9 ng/ml; p<0.01, B+GLP 83.04±24.28 vs. 138.76±4.90 ng/ml; p<0.01), even in the condition that the glucose load was twice in the IGGTT than in the IPGTT. It appears that injecting glucose into the gut more efficiently reduced plasma glucose concentration, most probably due to greater insulin secretion and/ or increased insulin sensitivity.
Figure 5.
A; Blood glucose / plasma insulin ratio during IGGTT. The ratios decreased immediately to the lowest levels after glucose load and then gradually reverted to initial concentrations in all three groups. B; Blood glucose / plasma insulin ratio during IPGTT. There was an immediate increase after glucose load in only the B group of IPGTT. Comparison between figures 5A and 5B demonstrated a similar pattern in the SB and B+GLP groups between IGGTT and IGPTT measurements. In all groups, the IGGTT showed a significantly lower level of minimum ratio compared with the IPGTT, indicating a higher efficiency of insulin effect following intragastric glucose administration.
DISCUSSION
A major metabolic response to injury is the presence of hyperglycemia and glucose intolerance as the consequence of insulin resistance1, 2, 20-23. Multiple studies have demonstrated that tight euglycemic control protocols within the ICU significantly reduce mortality and morbidity3-5 and this treatment has become part of the standard care of the severely burned patients. The major problems associated with continuous insulin infusion protocols are the increased workload for the bedside caregivers and the risk of the potentially life-threatening hypoglycemia6-9.
GLP-1 has been reported to be the most potent insulinotropic agent, accounting for at least 50% of total insulin secretion after an oral glucose challenge24, 25. Additionally, GLP-1 stimulates insulin secretion in a dose- and glucose-dependent manner in diabetics bases on OGTTs 26, 27. Exogeneous GLP-1 has been shown to reduce glucose concentration in hospitalized patients28, 29. In our previous study in rodent model, IPGTT was used to measure the efficacy of continuous GLP-1 infusion. The present study demonstrated that continuous infusion of GLP-1 reduced the extent of insulin resistance and normalized glucose homeostasis after thermal injury. Since most severely burned patients receive enteral nutrition, OGTT for evaluating glucose tolerance should be more physiological. The secretion of insulin from pancreatic beta cells involves a very complex cellular process. Studies in diabetic and non-diabetic human subjects and animal models showed difference in the results of IVGTT and oral glucose tolerance test (OGTT), reflecting the difference in the process of insulin release from pancreatic beta cells and the sensitivity of beta cell function to blood glucose level after oral and intravenous glucose challenge17, 30. Furthermore, burn injury per se also affects beta cell functions31, 32, and it remains to be determined if these changes have differential effects on the results of OGTT and/or IVGTT, since one of the major differences between OGTT and IVGTT is the presence of substrates in gut which trigger the release of incretin. The effects of incretin GLP-1 administration on the results of IPGTT have been demonstrated before14. Therefore, in this study, IGGTT was performed to compare the differences of the hormonal responses between IGGTT and IPGTT, and to verify our findings with IPGTT.
The results of the present study demonstrated a similar pattern of blood glucose response curve for IGGTT and IPGTT (Figure 1). Results of IGGTT confirmed our previous findings using IPGTT tests: 1) burn injury caused insulin resistance 2) GLP-1 treatment to burned animals significantly improves glucose tolerance, hence the insulin resistance status. This finding is further supported by the observation that the lowest blood glucose / plasma insulin (G/I) ratio was seen in the sham burn group and burn injury was associated with an increase in the G/I ratio, indicating reduced efficacy of insulin in controlling blood glucose level. GLP-1 treatment to burned animals lowered the G/I ratio, which suggests an improved insulin function in burned animals receiving GLP-1 treatment.
The present study also demonstrated certain differences in the response of plasma glucose levels between IPGTT and IGGTT in burned animals. The study demonstrated that the peak blood glucose level in all groups of animals following bolus glucose challenge was higher in IPGTT than IGGTT; despite the fact that the amount of glucose load in IGGTT was even twice that in IPGTT. This implies that a substantial amount of intragastrically administered glucose is taken up by the splanchnic bed during its first pass through the organs. This has been proven by the studies by Dardevet et al19. An additional explanation is that intragastrically administered glucose may be more efficient in stimulating insulin release from pancreatic beta cells for lowering blood sugar levels (Figure 3). Previous studies have reported that glucose ingestion during oral glucose tolerance tests (OGTT) stimulated more GLP-1 production than during intravenous glucose tolerance test (IVGTT) in patients with type 2 diabetes33. This effect reflects differences in the intracellular events that occur in response to GLP-1 after intragastric and intravenous administered glucose18 under the condition of insulin resistance in diabetes patients. The results of the present investigation suggest that similar effects are observed in the burn induced insulin resistance state.
In conclusion, the present study demonstrated that either IGGTT or IPGTT, namely, when glucose is administered orally or bypassing the GI tract, provided similar results of glucose tolerance test. Therefore, the study confirmed: 1) burn injury induced insulin resistance status and 2) GLP-1 treatment improved burn injury induced insulin resistance. The observed differences in plasma glucose and insulin levels between the two routes of glucose tolerance test imply that endogenously produced GLP-1 during the IGGTT may also play a role in ameliorating insulin resistance after burn injury.
ACKNOWLEDGEMENTS
This study was supported in part by grants from the National Institutes of Health (P 50 DK-21700, P30 DK040561) and Shriners Hospitals for Children (Grant #85700; #84070). None of the authors received financial support from industry and the study was not supported by industry. The authors would like to thank Ms. Whitney Michalek and Ms. Florence Lin for their excellent technical support in conducting the animal studies.
Financial Disclosure: This study was supported by grants from the National Institutes of Health (5P50GM021700, P30DK040561-13) and Shriners Hospitals for Children (Grant 84080, 85700). None of the authors received financial support from industry and the study was not supported by industry.
REFERENCES
- 1.Mizock BA. Alterations in fuel metabolism in critical illness: hyperglycaemia. Best Pract Res Clin Endocrinol Metab. 2001 Dec;15(4):533–51. doi: 10.1053/beem.2001.0168. [DOI] [PubMed] [Google Scholar]
- 2.Tredget EE, Yu YM. The metabolic effects of thermal injury. World J Surg. 1992 Jan-Feb;16(1):68–79. doi: 10.1007/BF02067117. [DOI] [PubMed] [Google Scholar]
- 3.van den Berghe G, Wouters P, Weekers F, Verwaest C, Bruyninckx F, Schetz M, et al. Intensive insulin therapy in critically ill patients. N Engl J Med. 2001 Nov 8;345(19):1359–67. doi: 10.1056/NEJMoa011300. [DOI] [PubMed] [Google Scholar]
- 4.Van den Berghe G, Wilmer A, Hermans G, Meersseman W, Wouters PJ, Milants I, et al. Intensive insulin therapy in the medical ICU. N Engl J Med. 2006 Feb 2;354(5):449–61. doi: 10.1056/NEJMoa052521. [DOI] [PubMed] [Google Scholar]
- 5.Finney SJ, Zekveld C, Elia A, Evans TW. Glucose control and mortality in critically ill patients. JAMA. 2003 Oct 15;290(15):2041–7. doi: 10.1001/jama.290.15.2041. [DOI] [PubMed] [Google Scholar]
- 6.Egi M, Bellomo R, Stachowski E, French CJ, Hart GK, Taori G, et al. Hypoglycemia and outcome in critically ill patients. Mayo Clin Proc. 2010 Mar;85(3):217–24. doi: 10.4065/mcp.2009.0394. [DOI] [PMC free article] [PubMed] [Google Scholar]
- 7.Krinsley JS, Grover A. Severe hypoglycemia in critically ill patients: risk factors and outcomes. Crit Care Med. 2007 Oct;35(10):2262–7. doi: 10.1097/01.CCM.0000282073.98414.4B. [DOI] [PubMed] [Google Scholar]
- 8.Bhatia A, Cadman B, Mackenzie I. Hypoglycemia and cardiac arrest in a critically ill patient on strict glycemic control. Anesth Analg. 2006 Feb;102(2):549–51. doi: 10.1213/01.ane.0000195236.73494.bf. [DOI] [PubMed] [Google Scholar]
- 9.Brunkhorst FM, Engel C, Bloos F, Meier-Hellmann A, Ragaller M, Weiler N, et al. Intensive insulin therapy and pentastarch resuscitation in severe sepsis. N Engl J Med. 2008 Jan 10;358(2):125–39. doi: 10.1056/NEJMoa070716. [DOI] [PubMed] [Google Scholar]
- 10.Holst JJ. Glucagon-like peptide-1: from extract to agent. The Claude Bernard Lecture, 2005. Diabetologia. 2006 Feb;49(2):253–60. doi: 10.1007/s00125-005-0107-1. [DOI] [PubMed] [Google Scholar]
- 11.Mojsov S, Weir GC, Habener JF. Insulinotropin: glucagon-like peptide I (7-37) co-encoded in the glucagon gene is a potent stimulator of insulin release in the perfused rat pancreas. J Clin Invest. 1987 Feb;79(2):616–9. doi: 10.1172/JCI112855. [DOI] [PMC free article] [PubMed] [Google Scholar]
- 12.Nikolaidis LA, Mankad S, Sokos GG, Miske G, Shah A, Elahi D, et al. Effects of glucagon-like peptide-1 in patients with acute myocardial infarction and left ventricular dysfunction after successful reperfusion. Circulation. 2004 Mar 2;109(8):962–5. doi: 10.1161/01.CIR.0000120505.91348.58. [DOI] [PubMed] [Google Scholar]
- 13.Al-Dorzi HM, Tamim HM, Arabi YM. Glycaemic fluctuation predicts mortality in critically ill patients. Anaesth Intensive Care. 2010 Jul;38(4):695–702. doi: 10.1177/0310057X1003800413. [DOI] [PubMed] [Google Scholar]
- 14.Shen CA, Fagan S, Fischman AJ, Carter EE, Chai JK, Lu XM, et al. Effects of glucagon-like peptide 1 on glycemia control and its metabolic consequence after severe thermal injury--studies in an animal model. Surgery. 2011 May;149(5):635–44. doi: 10.1016/j.surg.2010.11.017. [DOI] [PMC free article] [PubMed] [Google Scholar]
- 15.Tura A, Mari A, Prikoszovich T, Pacini G, Kautzky-Willer A. Value of the intravenous and oral glucose tolerance tests for detecting subtle impairments in insulin sensitivity and beta-cell function in former gestational diabetes. Clin Endocrinol (Oxf) 2008 Aug;69(2):237–43. doi: 10.1111/j.1365-2265.2008.03178.x. [DOI] [PubMed] [Google Scholar]
- 16.Overgaard RV, Jelic K, Karlsson M, Henriksen JE, Madsen H. Mathematical beta cell model for insulin secretion following IVGTT and OGTT. Ann Biomed Eng. 2006 Aug;34(8):1343–54. doi: 10.1007/s10439-006-9154-0. [DOI] [PubMed] [Google Scholar]
- 17.Cobelli C, Toffolo GM, Dalla Man C, Campioni M, Denti P, Caumo A, et al. Assessment of beta-cell function in humans, simultaneously with insulin sensitivity and hepatic extraction, from intravenous and oral glucose tests. Am J Physiol Endocrinol Metab. 2007 Jul;293(1):E1–E15. doi: 10.1152/ajpendo.00421.2006. [DOI] [PubMed] [Google Scholar]
- 18.Chan HM, Jain R, Ahren B, Pacini G, D’Argenio DZ. Effects of increasing doses of glucagon-like peptide-1 on insulin-releasing phases during intravenous glucose administration in mice. Am J Physiol Regul Integr Comp Physiol. 2011 May;300(5):R1126–33. doi: 10.1152/ajpregu.00687.2010. [DOI] [PMC free article] [PubMed] [Google Scholar]
- 19.Dardevet D, Moore MC, Remond D, Everett-Grueter CA, Cherrington AD. Regulation of hepatic metabolism by enteral delivery of nutrients. Nutr Res Rev. 2006 Dec;19(2):161–73. doi: 10.1017/S0954422407315175. [DOI] [PubMed] [Google Scholar]
- 20.Jeschke MG, Chinkes DL, Finnerty CC, Kulp G, Suman OE, Norbury WB, et al. Pathophysiologic response to severe burn injury. Ann Surg. 2008 Sep;248(3):387–401. doi: 10.1097/SLA.0b013e3181856241. [DOI] [PMC free article] [PubMed] [Google Scholar]
- 21.Turinsky J, Saba TM, Scovill WA, Chesnut T. Dynamics of insulin secretion and resistance after burns. J Trauma. 1977 May;17(5):344–50. doi: 10.1097/00005373-197705000-00002. [DOI] [PubMed] [Google Scholar]
- 22.Hinton P, Allison SP, Littlejohn S, Lloyd J. Insulin and glucose to reduce catabolic response to injury in burned patients. Lancet. 1971 Apr 17;1(7703):767–9. doi: 10.1016/s0140-6736(71)91213-x. [DOI] [PubMed] [Google Scholar]
- 23.Thomas R, Aikawa N, Burke JF. Insulin resistance in peripheral tissues after a burn injury. Surgery. 1979 Nov;86(5):742–7. [PubMed] [Google Scholar]
- 24.Holst JJ. The physiology of glucagon-like peptide 1. Physiol Rev. 2007 Oct;87(4):1409–39. doi: 10.1152/physrev.00034.2006. [DOI] [PubMed] [Google Scholar]
- 25.Otonkoski T, Hayek A. Constitution of a biphasic insulin response to glucose in human fetal pancreatic beta-cells with glucagon-like peptide 1. J Clin Endocrinol Metab. 1995 Dec;80(12):3779–83. doi: 10.1210/jcem.80.12.8530635. [DOI] [PubMed] [Google Scholar]
- 26.Schirra J, Goke B. The physiological role of GLP-1 in human: incretin, ileal brake or more? Regul Pept. 2005 Jun 15;128(2):109–15. doi: 10.1016/j.regpep.2004.06.018. [DOI] [PubMed] [Google Scholar]
- 27.Mari A, Gastaldelli A, Natali A, Ostergard T, Schmitz O, Ferrannini E. Characterization of beta-cell function impairment in first-degree relatives of type 2 diabetic subjects: modeling analysis of 24-h triple-meal tests. Am J Physiol Endocrinol Metab. 2005 Mar;288(3):E541–6. doi: 10.1152/ajpendo.00175.2004. [DOI] [PubMed] [Google Scholar]
- 28.Meier JJ, Weyhe D, Michaely M, Senkal M, Zumtobel V, Nauck MA, et al. Intravenous glucagon-like peptide 1 normalizes blood glucose after major surgery in patients with type 2 diabetes. Crit Care Med. 2004 Mar;32(3):848–51. doi: 10.1097/01.ccm.0000114811.60629.b5. [DOI] [PubMed] [Google Scholar]
- 29.Deane AM, Chapman MJ, Fraser RJ, Burgstad CM, Besanko LK, Horowitz M. The effect of exogenous glucagon-like peptide-1 on the glycaemic response to small intestinal nutrient in the critically ill: a randomised double-blind placebo-controlled cross over study. Crit Care. 2009;13(3):R67. doi: 10.1186/cc7874. [DOI] [PMC free article] [PubMed] [Google Scholar]
- 30.Basu R, Dalla Man C, Campioni M, Basu A, Klee G, Toffolo G, et al. Effects of age and sex on postprandial glucose metabolism: differences in glucose turnover, insulin secretion, insulin action, and hepatic insulin extraction. Diabetes. 2006 Jul;55(7):2001–14. doi: 10.2337/db05-1692. [DOI] [PubMed] [Google Scholar]
- 31.Frayn KN. Effects of burn injury on insulin secretion and on sensitivity to insulin in the rat in vivo. Eur J Clin Invest. 1975 Jul 29;5(4):331–7. doi: 10.1111/j.1365-2362.1975.tb00462.x. [DOI] [PubMed] [Google Scholar]
- 32.Pidcoke HF, Wade CE, Wolf SE. Insulin and the burned patient. Crit Care Med. 2007 Sep;35(9 Suppl):S524–30. doi: 10.1097/01.CCM.0000278065.72486.31. [DOI] [PubMed] [Google Scholar]
- 33.Faerch K, Vaag A, Holst JJ, Glumer C, Pedersen O, Borch-Johnsen K. Impaired fasting glycaemia vs impaired glucose tolerance: similar impairment of pancreatic alpha and beta cell function but differential roles of incretin hormones and insulin action. Diabetologia. 2008 May;51(5):853–61. doi: 10.1007/s00125-008-0951-x. [DOI] [PubMed] [Google Scholar]


