Abstract
Objective:
The purpose of this study is to compare the accuracy of the treatment simulation module of Quick Ceph Studio (QCS) program to the actual treatment results in Class II Division 1 patients.
Design:
Retrospective study.
Materials and Methods:
Twenty-six skeletal Class II patients treated with functional appliances were included. T0 and T1 lateral cephalograms were digitized using QCS. Before applying treatment simulation to the digitized cephalograms, the actual T0-T1 difference was calculated for the SNA, SNB, ANB angles, maxillary incisor inclination, and protrusion and mandibular incisor inclination and protrusion values. Next, using the treatment simulation module, the aforementioned values for the T0 cephalograms were manually entered to match the actual T1 values taking into account the T0-T1 differences. Paired sample t-test were applied to determine the difference between actual and treatment simulation measurements.
Results:
No significant differences were found for the anteroposterior location of the landmarks. Upper lip, soft tissue A point, soft tissue pogonion, and soft tissue B point measurements showed statistically significant difference between actual and treatment simulation in the vertical plane.
Conclusion:
Quick Ceph program was reliable in terms of reflecting the sagittal changes that would probably occur with treatment and growth. However, vertical positions of the upper lip, soft tissue pogonion, soft tissue A point, and soft tissue B point were statistically different from actual results.
Keywords: Computerized cephalometry, treatment simulation, soft tissue changes
INTRODUCTION
Class II malocclusion is the most frequent sagittal anomaly in orthodontic practice.[1,2] In growing individuals, the prevalence of orthodontic treatments needs is greater than adults[3] and skeletal malocclusion can be treated with growth modification techniques.[4] Because mandibular retrusion is a common characteristic of Class II division 1 malocclusion, functional appliances is frequently used for positioning the retrognathic mandible forward to accelerate mandibular growth and contribute to changes for the patients presenting with convex profile.[5] The prediction of profile changes that are obtainable with treatment helps orthodontists to decide which treatment options are appropriate. Treatment results may be evaluated differently by the orthodontist and patient due to subjective properties of the esthetic changes. Therefore, treatment simulation that is offered by most of the computer-aided cephalometric analysis programs is essential for previewing and interpreting the treatment results.
The use of cephalometric analysis program provides the ability to easily and accurately perform treatment simulations.[6,7] These programs concentrate not just on the teeth and the occlusion, but also on the soft tissue profile.[8] However, due to the difference between the osseous changes and soft tissue translations, the accuracy of profile changes is problematic. Even in nongrowing patients, treatment simulation modules do not reflect the actual soft tissue changes.[9,10] Therefore, treatment simulation becomes more important in growing patients.
Nowadays, many commercial computer-assisted cephalometric prediction programs are used. Quick Ceph Studio (Quick Ceph Systems, San Diego, CA), which is a popular cephalometric analysis program amongst orthodontists, permits the indirect digitization of landmarks of the digital or scanned cephalogram. The aim of this study is to compare the accuracy of the treatment simulation module of the Quick Ceph program's new version which is named with Quick Ceph Studio (QCS) to the actual outcome in growing Class II Division 1 patients treated with functional appliances.
MATERIALS AND METHODS
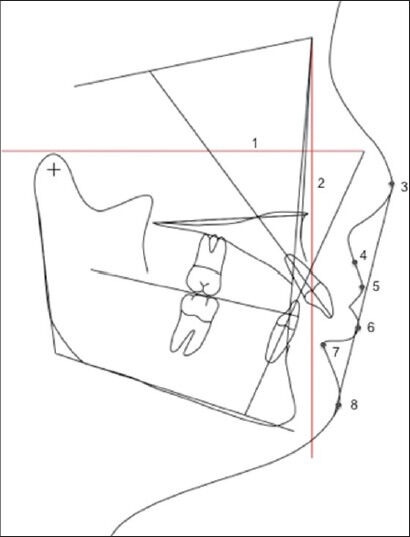
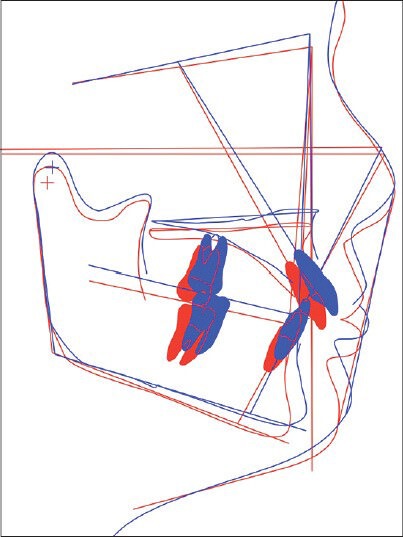
Twenty-six skeletal Class II patients (17 female, 9 male; mean age: 8.7 years) were selected for this retrospective study. The power of the sample size was calculated by using the G*Power 3 program (Institut für Experimentelle Psychologie, Düsseldorf, Germany)[11] and it was determined that 25 subjects would be needed to conduct this study with 80% power (α =0.05). All patients were treated with Frankel-2 appliances (FR2) or preorthodontic trainer (PT) appliance at XXX University Department of Orthodontics. Mean treatment time was 14.4 ± 2.1 months. The lateral cephalometric radiographs were taken at pretreatment (T0) and post-treatment (T1) time intervals. One experienced investigator (XX) using QCS program performed an on-screen digitization for all radiographs. Before applying treatment simulation to the digitized cephalograms, the actual T0-T1 difference was calculated for the SNA, SNB, ANB angles, maxillary incisor inclination (MX 1-NA Angle) and protrusion (MX 1-NA mm.) and mandibular incisor inclination (Md 1-NA Angle) and protrusion (Md 1-NA mm) values. Next, using the treatment simulation module, the aforementioned values for the T0 cephalograms were manually entered to match the actual T1 values taking into account the T0-T1 differences. Thus, the accuracy of the cephalometric soft tissue outlines can be compared and analyzed. To measure the vertical and horizontal distances of anatomic landmarks, the vertical and horizontal reference planes were chosen Nasion perpendicular (NP) line and Frankfort Horizontal (FH) plane, respectively [Figure 1]. Figure 2 shows the comparison of actual results and treatment simulation of one patient.
Figure 1.

Reference lines and anatomic landmark used in the study. 1-Horizontal reference line (Frankfort horizontal plane) 2-Vertical reference line (Nasion perpendicular) 3-Nose tip 4-Soft tissue A point 5-Upper lip 6-Lower lip 7-Soft tissue B point 8-Soft tissue pogonion
Figure 2.

Comparison of actual results and treatment simulation
All statistical analysis was performed with SPSS 17 (SPSS Inc., Chicago, Illinois, USA) program. All measurements were repeated for 15 randomly selected subjects to test for reliability by using the intraclass correlation coefficient (ICC) and Dahlberg's formula  for linear measurements. Shapiro Wilks test was used to check the normality of the data. Due to the homogeneous distribution of the data, parametric tests were performed. Paired sample t-test were applied to determine the difference between actual and treatment simulation measurements. The statistical significance was set at 0.05.
RESULTS
The reliability results showed errors of 0.30 mm and ICC values of 0.96 for linear variables. Descriptive demographics of our sample size can be seen in Table 1.
Table 1.
Descriptive analyses of the sample

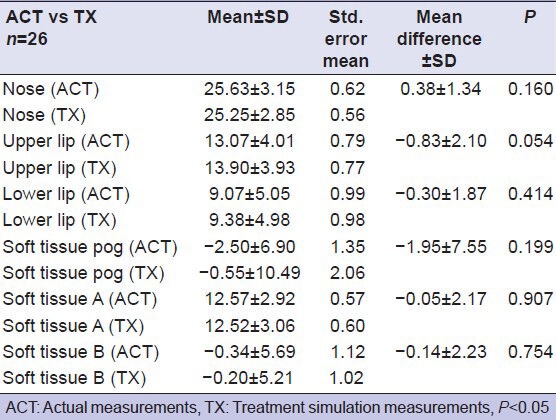
Table 2 shows the differences between actual and treatment simulation with respect to the NP plane. No significant differences were found for the anteroposterior location of the landmarks. The largest mean difference was observed for the soft tissue pogonion landmark (−1.95 ± 7.55 mm) but it was not statistically significant.
Table 2.
Differences between actual and treatment simulation of horizontal measurements

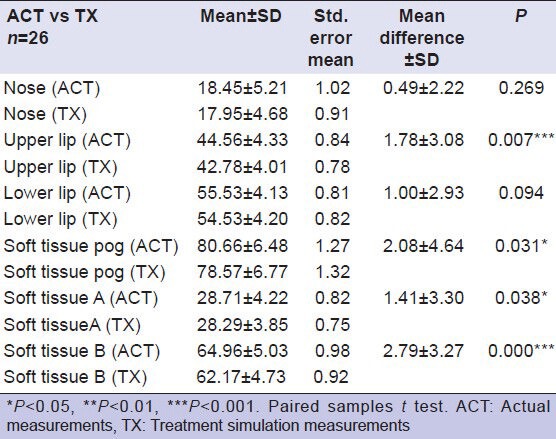
Table 3 shows the difference between actual and treatment simulation measurements with respect to the FH plane. Upper lip, soft tissue A point, soft tissue pogonion, and soft tissue B point measurements showed statistically significant difference between actual and treatment simulation. The largest mean difference was found in soft tissue B point (P < 0.001).
Table 3.
Differences between actual and treatment simulation of vertical measurements

DISCUSSION
The accuracy of prediction is vital for the orthodontists so that better treatment planning and treatment outcome can be achieved. In several studies[7,8,10,12,13] computer-generated prediction were used for evaluating changes of soft tissue profile after orthognathic surgery. However, the aim of this study was to evaluate the accuracy of the treatment simulation module of the QCS program in growing patients. Most of the times the mandibular movement amount that is obtained with functional appliances are less compared to orthognathic surgery.[14] One of the limiting factors of this study is the usage of two different types of appliances that may have led to a variation in soft tissue profile. However, in a previous study using the same sample[15] it was concluded that the effects of the appliances were similar. Furthermore, this study was not designed to evaluate the effects of appliances over the soft tissue but rather to evaluate the actual treatment results to simulation results. We also tried to eliminate this bias by entering the actual values of changes that were obtained by treatment into the simulation module.
To assessment of the accuracy of the treatment simulation module of QCS program to the actual treatment results, two reference lines were used. The FH line was used to compare the changes in the horizontal plane. Although determining of the Porion point was difficult in some patients, FH plane was a reliable and various number of study used for cephalometric measurements.[16,17] NP line was also used for vertical distance changes. Although there have been some other vertical reference lines, NP was chosen because of the proximity to soft tissue points that used in this study. Some past cephalometric studies were also used the same vertical reference line for vertical assessment.[10,18]
Studies[8,10,19,20] that evaluated the prediction of soft tissue profiles were showed that the more accurate results were observed in the horizontal plane than the vertical plane in concordance with our study. But Lu et al.[21] found that the greatest differences were found in the horizontal plane. This difference arises from the variability of the surgery techniques and cephalometric programs. On the contrary of this difference, most of the studies[8,10,20,22,23] agreed on the less accurate results were observed for the lower lip area. However, our findings demonstrate that the QCS program was successful in predicting the horizontal and vertical position of the lower lip. While the aforementioned studies evaluate orthognathic surgery, our main goal was to detect the soft tissue changes with functional appliances. This may have also contributed to better simulation results due to the fact that the less movement amount may generate less error.
In a vertical plane Hing et al.[24] and Upton et al.[10] defined the less accurate results for the soft tissue pogonion as well as lower lip. Our findings support these studies by detecting the larger difference with the soft tissue pogonion and also with soft tissue B point. These results proved that poor results were seen in the chin area rather than the lower lip with QCS program.
When taking into account the upper lip, Kazandjian et al.[8] showed that upper lip predictions displayed less accurate results in the vertical plane. Also, Lu et al.[21] found the largest difference was seen in the upper lip distance. In agreement with these studies, this study showed that QCS program place the upper lip different from actual results with a distance of approximately 1.78 mm. Although differences between actual results and treatment simulation were statistically significant, 1-2 mm differences are difficult to detect by the orthodontist and patients.[8]
Both of the appliances used in the study show neuromuscular effects by removing lips from dentoalveolar region beside skeletal and dental effects. Perioral muscle adaptation to new dentoskeletal structure may change posture of the soft tissues. Also, the soft tissue thicknesses are different between the patients because of individual differences. Therefore, treatment simulation modules could make mistakes during estimating the treatment results.
Finally, the program developers may have updated the soft tissue algorithms in order to produce more reliable results in this newer version. However, further studies are needed with different mandibular or maxillary movement amounts and directions in order to draw better conclusions for the efficacy and reliability of treatment simulation modules of such programs.
CONCLUSIONS
In the horizontal plane, our results indicate that the T0–T1 distances between measured parameters were consistent for actual results and treatment simulation. In other words, Quick Ceph program was reliable in terms of reflecting the sagittal changes that would probably occur with treatment and growth. On the other hand, the program tended to place the predicted vertical positions of upper lip, soft tissue pogonion, soft tissue A point, and soft tissue B point different from their actual positions.
Footnotes
Source of Support: Nil.
Conflict of Interest: None declared
REFERENCES
- 1.McNamara JA., Jr Components of class II malocclusion in children 8-10 years of age. Angle Orthod. 1981;51:177–202. doi: 10.1043/0003-3219(1981)051<0177:COCIMI>2.0.CO;2. [DOI] [PubMed] [Google Scholar]
- 2.McNamara JA, Jr, Peterson JE, Jr, Alexander RG. Three-dimensional diagnosis and management of Class II malocclusion in the mixed dentition. Semin Orthod. 1996;2:114–37. doi: 10.1016/s1073-8746(96)80048-x. [DOI] [PubMed] [Google Scholar]
- 3.Tak M, Nagarajappa R, Sharda AJ, Asawa K, Tak A, Jalihal S, et al. Prevalence of malocclusion and orthodontic treatment needs among 12-15 years old school children of Udaipur, India. Eur J Dent. 2013;7:45–53. doi: 10.4103/1305-7456.119071. [DOI] [PMC free article] [PubMed] [Google Scholar]
- 4.McNamara JA, Jr, Brudon WL. Treatment of class II malocclusion. In: Spivey KB, Skidmore LM, editors. Orthodontic and Orthopedic Treatment in the Mixed Dentition. Ann Arbor, Mich: Needham Press; 1993. pp. 95–116. [Google Scholar]
- 5.Graber TM. Functional appliances. In: Graber TM, Vanarsdall RL, editors. Orthodontics: Current Principles and Techniques. St. Louis: Mosby; 2005. pp. 473–520. [Google Scholar]
- 6.Donatsky O, Hillerup S, Bjørn-Jørgensen J, Jacobsen PU. Computerized cephalometric orthognathic surgical simulation, prediction and postoperative evaluation of precision. Int J Oral Maxillofac Surg. 1992;21:199–203. doi: 10.1016/s0901-5027(05)80218-8. [DOI] [PubMed] [Google Scholar]
- 7.Loh S, Heng JK, Ward-Booth P, Winchester L, McDonald F. A radiographic analysis of computer prediction in conjunction with orthognathic surgery. Int J Oral Maxillofac Surg. 2001;30:259–63. doi: 10.1054/ijom.2001.0089. [DOI] [PubMed] [Google Scholar]
- 8.Kazandjian S, Sameshima GT, Champlin T, Sinclair PM. Accuracy of video imaging for predicting the soft tissue profile after mandibular set-back surgery. Am J Orthod Dentofacial Orthop. 1999;115:382–9. doi: 10.1016/s0889-5406(99)70256-8. [DOI] [PubMed] [Google Scholar]
- 9.Schultes G, Gaggl A, Kärcher H. Accuracy of cephalometric and video imaging program dentofacial planner plus in orthognathic surgical planning. Comput Aided Surg. 1998;3:108–14. doi: 10.1002/(SICI)1097-0150(1998)3:3<108::AID-IGS2>3.0.CO;2-T. [DOI] [PubMed] [Google Scholar]
- 10.Upton PM, Sadowsky PL, Sarver DM, Heaven TJ. Evaluation of video imaging prediction in combined maxillary and mandibular orthognathic surgery. Am J Orthod Dentofacial Orthop. 1997;112:656–65. doi: 10.1016/s0889-5406(97)70231-2. [DOI] [PubMed] [Google Scholar]
- 11.Faul F, Erdfelder E, Buchner A, Lang AG. Statistical power analyses using G*Power 3.1: Tests for correlation and regression analyses. Behav Res Methods. 2009;41:1149–60. doi: 10.3758/BRM.41.4.1149. [DOI] [PubMed] [Google Scholar]
- 12.Semaan S, Goonewardene MS. Accuracy of a LeFort I maxillary osteotomy. Angle Orthod. 2005;75:964–73. doi: 10.1043/0003-3219(2005)75[964:AOALIM]2.0.CO;2. [DOI] [PubMed] [Google Scholar]
- 13.Smith JD, Thomas PM, Proffit WR. A comparison of current prediction imaging programs. Am J Orthod Dentofacial Orthop. 2004;125:527–36. doi: 10.1016/S0889540604001210. [DOI] [PMC free article] [PubMed] [Google Scholar]
- 14.Sarver DM, Proffit WR, Ackerman JL. Diagnosis and treatment planning in orthodontics. In: Graber TM, Vanarsdall RL, editors. Orthodontics: Current Principles and Techniques. St. Louis: Mosby; 2000. pp. 3–115. [Google Scholar]
- 15.Sahin-Veske P. Ph.D. Thesis in Orthodontics. Ankara: Hacettepe University, Institute of Health Sciences; 2010. Evaluation of the effects of Frankel-II and preorthodontic trainer appliances on skeletal, dental structures and masticatory muscles in patients with class II division 1 malocclusion. [Google Scholar]
- 16.Lundström A, Lundström F. The Frankfort horizontal as a basis for cephalometric analysis. Am J Orthod Dentofacial Orthop. 1995;107:537–40. doi: 10.1016/s0889-5406(95)70121-4. [DOI] [PubMed] [Google Scholar]
- 17.Ricketts RM, Schulhof RJ, Bagha L. Orientation-sella-nasion or Frankfort horizontal. Am J Orthod. 1976;69:648–54. doi: 10.1016/0002-9416(76)90147-0. [DOI] [PubMed] [Google Scholar]
- 18.Koh CH, Chew MT. Predictability of soft tissue profile changes following bimaxillary surgery in skeletal class III Chinese patients. J Oral Maxillofac Surg. 2004;62:1505–9. doi: 10.1016/j.joms.2004.04.022. [DOI] [PubMed] [Google Scholar]
- 19.Pektas ZO, Kircelli BH, Cilasun U, Uckan S. The accuracy of computer-assisted surgical planning in soft tissue prediction following orthognathic surgery. Int J Med Robot. 2007;3:64–71. doi: 10.1002/rcs.127. [DOI] [PubMed] [Google Scholar]
- 20.Sinclair PM, Kilpelainen P, Phillips C, White RP, Jr, Rogers L, Sarver DM. The accuracy of video imaging in orthognathic surgery. Am J Orthod Dentofacial Orthop. 1995;107:177–85. doi: 10.1016/s0889-5406(95)70134-6. [DOI] [PubMed] [Google Scholar]
- 21.Lu CH, Ko EW, Huang CS. The accuracy of video imaging prediction in soft tissue outcome after bimaxillary orthognathic surgery. J Oral Maxillofac Surg. 2003;61:333–42. doi: 10.1053/joms.2003.50058. [DOI] [PubMed] [Google Scholar]
- 22.Carter AC, Larson BE, Guenthner TA. Accuracy of video imaging in mandibular surgery. Int J Adult Orthodon Orthognath Surg. 1996;11:289–300. [PubMed] [Google Scholar]
- 23.Gerbo LR, Poulton DR, Covell DA, Russell CA. A comparison of a computer-based orthognathic surgery prediction system to postsurgical results. Int J Adult Orthodon Orthognath Surg. 1997;12:55–63. [PubMed] [Google Scholar]
- 24.Hing NR. The accuracy of computer generated prediction tracings. Int J Oral Maxillofac Surg. 1989;18:148–51. doi: 10.1016/s0901-5027(89)80113-4. [DOI] [PubMed] [Google Scholar]


