

Abstract
Biocatalyst robustness toward stresses imposed during fermentation is important for efficient bio-based production. Osmotic stress, imposed by high osmolyte concentrations or dense populations, can significantly impact growth and productivity. In order to better understand the osmotic stress tolerance phenotype, we evolved sexual (capable of in situ DNA exchange) and asexual Escherichia coli strains under sodium chloride (NaCl) stress. All isolates had significantly improved growth under selection and could grow in up to 0.80 M (47 g/liter) NaCl, a concentration that completely inhibits the growth of the unevolved parental strains. Whole genome resequencing revealed frequent mutations in genes controlling N-acetylglucosamine catabolism (nagC, nagA), cell shape (mrdA, mreB), osmoprotectant uptake (proV), and motility (fimA). Possible epistatic interactions between nagC, nagA, fimA, and proV deletions were also detected when reconstructed as defined mutations. Biofilm formation under osmotic stress was found to be decreased in most mutant isolates, coupled with perturbations in indole secretion. Transcriptional analysis also revealed significant changes in ompACGL porin expression and increased transcription of sulfonate uptake systems in the evolved mutants. These findings expand our current knowledge of the osmotic stress phenotype and will be useful for the rational engineering of osmotic tolerance into industrial strains in the future.
INTRODUCTION
Escherichia coli, an important industrial microorganism for the production of a wide variety of fine chemicals, fuels, and proteins, has been extensively targeted to improve its suitability as a biofactory. Strain development efforts have focused on improving tolerance of feedstocks containing toxic compounds (1, 2) or products (3, 4). Many environmental variables, including osmotic pressure, can negatively impact biocatalyst performance (5). Use of nonconventional waste streams, such as waste glycerol or brackish water sources, to support microbial growth can also reduce process costs (6, 7) while reducing pressure on fresh water resources; however, these carbon and water sources generally contain high concentrations of salt that may be inhibitory to microbial growth. In addition to osmotic stresses, excess Na+ can disrupt the ion homeostasis in E. coli as well (8). Previous studies have attempted to engineer improved osmotic tolerance in E. coli (9, 10), but overall, knowledge of the genetic mechanisms that confer tolerance of osmotic stress in general or to specific osmolytes remains limited. A detailed analysis of E. coli osmotolerance to osmolytes would therefore provide new insight into the molecular mechanisms underlying this complex phenotype.
Adaptive laboratory evolution (11) is a promising approach to identify potentially novel osmotic tolerance mechanisms, as this technique requires no assumptions about the underlying genotype-phenotype relationship. Complex phenotypes, such as enhanced resistance to biofuels (3, 4, 12), lignocellulosic hydrolysates (2, 13), antibiotics (14, 15), and environmental conditions (16), have all been successfully characterized using this approach. In this study, sodium chloride (NaCl) was selected as the osmotic inhibitor. A recent evolutionary study aimed at characterizing cross-adaptation between several different stressors detected several potential mechanisms in a single evolved NaCl-tolerant isolate (17), but due to the possible existence of multiple adaptation mechanisms, additional information is needed to better understand the genetic bases of osmotolerance.
In order to identify novel genetic mechanisms for osmotic (NaCl) tolerance, we have utilized adaptive laboratory evolution to generate osmotic-tolerant mutants of two distinct E. coli strains: one capable of in situ recombination to reduce clonal interference between osmotolerant mutants and another, completely asexual strain (15). These strains will enable a comparison between the sexual evolution system and typical evolutionary engineering approaches for an industrially relevant phenotype. After being propagated for approximately 150 generations in the presence of increasing concentrations of NaCl, osmotolerant mutants were isolated, characterized, and sequenced to identify any genetic changes that occurred during evolution. The elucidated resistance mechanisms were then explored phenotypically to better understand their potential impact on E. coli physiology. Transcriptomic analyses of several mutants were subsequently conducted to better characterize the genotype-phenotype connection that resulted in enhanced osmotolerance.
MATERIALS AND METHODS
Bacterial strains and growth media.
All strains used for evolution in this study were previously developed BW25113 derivatives (15). Briefly, Hfr-2xSFX− is a conjugation-proficient, surface exclusion-deficient Hfr strain with an operon of F transfer proteins integrated at the trp locus (18). Recombination is therefore more frequent for the Hfr-2xSFX− strain than for an Hfr strain with intact surface exclusion, which acts to prevent redundant transfer between Hfr and F+ strains (19). 2xOriT, an F− strain, was used as an asexual control. Knockout strains were obtained from the Keio collection (20), while ASKA overexpression plasmids were transformed into BW25113 from the original AG1 host (21) for both overexpression and compensatory assays. The kanamycin resistance marker in the Keio strains was also removed by transformation with pCP20 as needed for strain construction and screening (22). The full list of strains and plasmids used in this study is given in Table S1 in the supplemental material. Minimal M9 medium supplemented with 0.5% (wt/vol) glucose and 50 μg/ml tryptophan (15, 18) was used for routine cultivation and growth assays, while Luria-Bertani (LB) broth and agar plates were used for strain isolation, transformation, and other analyses where indicated. Sodium chloride (JT Baker) was utilized to adjust the osmotic strength of the medium during the evolution and for subsequent growth assays.
Evolution experiment.
Adaptive laboratory evolution was conducted via serial batch transfer experiments to improve the osmotic stress tolerance of Hfr-2xSFX− and 2xOriT in parallel. Six replicate populations for each strain were inoculated from independent colonies to initiate the evolution experiment in 0.55 M (32 g/liter) NaCl and increased to 0.6 M (35 g/liter) NaCl after one serial transfer. Approximately every 24 h, a proportion (typically 1 to 3%, based on cell density) of each replicate population was diluted into fresh medium to ensure that each population underwent approximately 6 or 7 generations per transfer for a total of 150 generations. Sodium chloride concentrations were periodically increased from 0.6 M to 0.75 M (32 to 35 to 44 g/liter), as fitness increases were observed in population level data every 24 generations (Fig. 1); the daily concentration of NaCl in each replicate set is shown in Fig. S1 in the supplemental material. The initial NaCl concentration was chosen to reduce the growth rates of the ancestral strains by approximately 50%. The fitness (S; equation 1) of the evolving populations relative to their ancestral parents was determined every 24 generations using growth assays in microtiter plates to track their rates of adaptation; 0.6 M (35 g/liter) NaCl was used for the initial fitness measurement at generation zero to account for the lower initial tolerance of the Hfr strains, and 0.65 M (38 g/liter) NaCl was used thereafter. The specific growth rate (μ) was calculated by linearizing the measured growth curves and calculating the slope in exponential growth phase using standard regression procedures. The subscript i refers to the measured growth rate for the ith population or mutant under investigation.
FIG 1.
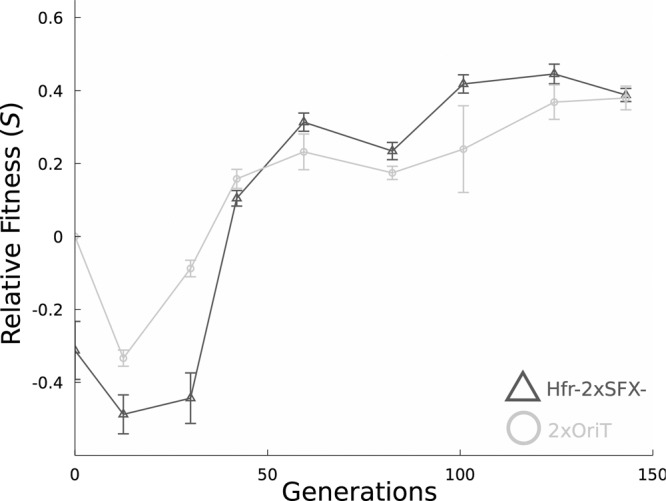
Average fitness improvements for the Hfr-2xSFX− and 2xOriT populations, relative to the 2xOriT parent strain during evolution in the presence of high sodium chloride concentrations. NaCl concentrations used during fitness assays were 0.6 M (35 g/liter) for the first measurement and 0.65 M (38 g/liter) for all subsequent measurements. Fitness is defined as S = μpop/μ2xOriT − 1 in this case, where pop refers to the population average growth rate for each evolving population under NaCl challenge. Error bars are 95% confidence intervals using the Student t distribution.
A logarithmic model (equation 2) was then fitted to the fitness measurements (S; see below) for each population and used to calculate their overall rate of improvement throughout the evolution experiment based on the expected shape of the improvement curve (16), where the constant α is a shape parameter for the logarithmic curve. The variable t refers to the number of generations that have occurred since the initial inoculation of the experiment. Potential external contamination and cross-contamination of the experiment were monitored as described by Winkler and Kao (15).
| (1) |
| (2) |
Mutant isolation and screening.
One clonal isolate was randomly obtained from each evolved population (to ensure mutational independence) at the end of the evolution experiment after streaking the evolved populations onto LB agar for single colonies. Isolates from the Hfr-2xSFX− and 2xOriT populations are prefaced with G and A, respectively. All isolates were propagated in M9 minimal medium without excess NaCl for at least 10 generations prior to any phenotypic analysis. All cultures were grown in glucose minimal medium with tryptophan overnight and diluted 100-fold (optical density at 600 nm [OD600] ≈ 0.04) into medium containing various stressors for growth over 24 to 36 h. Cross-adaptation was analyzed using several general stress conditions (excess glucose [54 g/liter], n-butanol [0.8% vol/vol], mild acid stress pH [pH = 6.0], or elevated temperature [42°C]) with two biological and 4 technical replicates per strain per condition. While these stressors would be more severe in an industrial fermenter, the purpose of this assay is to analyze incidental phenotypic changes associated with osmotic tolerance. All growth assays were performed in 96-well microtiter plates using a plate shaker and incubator (TECAN Infinite M200) at 37°C (except for thermal stress assays). Relative fitness (S) and improvement (RI) of the ith mutant were, respectively, calculated for each condition using equations 1 and 3. Subscripts C and U refer to challenged and unchallenged maximum growth rates, respectively, where C can be any of the stress conditions listed above and sodium chloride stress.
Fitness assays for knockout, overexpression, and compensatory assays were conducted in screw-cap tubes with 5 ml of M9 minimal medium, supplemented with glucose, tryptophan, and 0.55 M (32 g/liter) NaCl. A lower concentration of NaCl was used for these assays to permit gathering of a full growth curve within 24 h. OD600 readings were taken every 2 h until exponential growth had been sustained for at least 3 doublings. Fitness of the overexpression and knockout strains relative to the appropriate references (empty vector controls for the overexpression strains, BW25113 for knockout strains) was then calculated using equation 1. Three biological replicates per strain were analyzed.
| (3) |
Fitness distribution analysis.
Six randomly isolated clones were obtained by streaking from each of the evolved Hfr-2xSFX− and 2xOriT replicate populations (for a total of 36 random isolates per strain). Each colony was inoculated into 2 ml glucose minimal medium supplemented with tryptophan and allowed to grow for 24 h. The fitness of each isolate (relative to 2xOriT) was then determined using growth in a microtiter plate under 0.65 M (38 g/liter) NaCl challenge, as described previously. Four technical replicates were used per screened isolate.
Mutation rate under osmotic stress.
The mutation rates of Hfr-2xSFX− and 2xOriT were measured using a standard fluctuation test (23) under 0.55 M (32 g/liter) NaCl stress to determine if the strains have unequal mutation rates under osmotic stress, which would influence their relative adaptation rates. For 2xOriT, the mutation rate is 1.43 mutants per 109 cells (95% confidence interval of 0.72 to 2.31); for Hfr-2xSFX−, the mutation rate is 1.52 mutants per 109 cells (95% confidence interval of 0.71 to 2.54). The difference in mutation rate between the strains is not statistically significant.
Hyperosmotic shock tests.
Single colonies of each isolate (G1 to G6 and A1 to A6) and the parental controls were inoculated into glucose minimal medium and allowed to grow overnight. The stationary-phase cultures were then diluted in fresh medium and propagated until mid-exponential phase (OD600 ≈ 0.3 to 0.6). The cultures were then normalized to equivalent optical densities, pelleted, and resuspended in glucose minimal medium supplemented with 5.45 M (319 g/liter) NaCl and incubated at 37°C for 2 h. Each sample was then serially diluted up to 10,000-fold in minimal medium, spotted on LB plates, and incubated overnight at 37°C. The numbers of colonies in each 1,000× to 10,000× dilution were then counted. Each assay was performed in duplicate with independent biological replicates.
Genome sequencing and verification.
The evolved Hfr-2xSFX− (G1 to G6) and 2xOriT (A1 to A6) isolates, along with the unevolved parental strains, were sequenced to discover the genotype underlying the observed sodium chloride tolerance. Genomic library preparation and sequencing were performed by The Texas A&M Genomics Center for sequencing on the Illumina HiSeq 2500 platform using 100-bp single-end reads. An average of 286-fold coverage was obtained for each isolate. Reads were assembled against the MG1655 reference genome, and each mutant genome was compared to the parental sequences to identify any de novo mutations. The approach to mutation verification depended on the type of mutation; 11 single nucleotide polymorphisms (SNPs) and deletions were verified with Sanger sequencing, and other large deletions were verified with junction-specific PCR (see Table S2 in the supplemental material).
Transcriptional analysis.
Two biological replicates of A2, A4, G2, G3, G5, and G6 were used for microarray analysis. Two colonies of each strain along with the 2xOriT (A parent) and Hfr-2xSFX− (G parent) were inoculated into glucose minimal medium supplemented with tryptophan and grown overnight at 37°C with shaking. A total of 500 μl of each overnight culture was diluted 50-fold (OD600 ≈ 0.02) into 250-ml baffled flasks containing 25 ml of glucose minimal medium, supplemented with tryptophan and 0.55 M (32 g/liter) NaCl. Samples were grown until reaching an OD600 of approximately 0.5 and were then harvested by rapid filtration (Nalgene) followed by immediate resuspension in 5 ml of RNAlater (Sigma). RNA processing was done as described previously (24).
Indole and biofilm measurements.
The G2, G3, G5, G6, A2, and A4 mutants, along with the Hfr-2xSFX− and 2xOriT parental strains, were grown in M9 medium supplemented with 0.55 M (32 g/liter) NaCl, 0.5% (wt/vol) glucose, and 50 μg/ml tryptophan until reaching stationary phase. Extracellular indole concentrations were measured using standard procedures with Kovac's reagent (25). Biofilm formation was measured in 96-well plates with 2 biological and 8 technical replicates per strain in either LB or glucose minimal medium supplemented with NaCl (0.55 M, 32 g/liter) and tryptophan using a previously established protocol (26). Biofilm data are normalized by final biomass density (OD600) and by specific biomass formation of the parental strains.
Microarray data accession number.
Microarray data were deposited in the Gene Expression Omnibus (GEO) database under accession number GSE51611.
RESULTS AND DISCUSSION
Evolution under NaCl challenge.
Six replicate populations of 2xOriT and Hfr-2xSFX− were subjected to gradually increasing NaCl concentration (0.55 to 0.75 M, 32 to 44 g/liter) over the course of approximately 150 generations. Over this time course, significant fitness improvements were observed in all evolving populations (Fig. 1), indicating the successful selection for osmotolerant mutants in each population. Compared to the observed rates of fitness improvement in the 2xOriT populations (4.54 × 10⁻³/generation), the rates of fitness improvement in Hfr-2xSFX− populations are significantly larger (6.70 × 10⁻³/generation, P < 0.003, Student's t test). However, it is possible that due to the initial higher sensitivity of Hfr-2xSFX− to NaCl, mutants with larger fitness improvements tended to arise in the sexual populations as a result of stronger selection, leading to an apparent increase in the adaptation rate independent of recombination. Interestingly, mutant isolates from the Hfr-2xSFX− populations tended to have higher relative fitness values than those from the 2xOriT populations, as discussed below. All populations reached similar phenotypic endpoints by the conclusion of the experiment. No loss of mating competence was observed in the Hfr-2xSFX− populations over the course of the experiment.
Mutant characterization.
A single randomly isolated clone from each Hfr-2xSFX− (G1 to G6) and 2xOriT (A1 to A6) population was subjected to detailed analyses to identify any novel phenotypes that arose during evolution alongside osmotolerance. All mutants had significant improvements in relative fitness under NaCl challenge (Fig. 2A), though is it possible that mutations that enhance growth in minimal medium (27) are responsible for the apparent tolerance increase. However, only G3 and G4 had significantly improved growth rates in the absence of stress (Fig. 2F). When the observed general fitness benefits in the absence of abiotic stressors were accounted for by calculating mutant relative improvements under NaCl stress (see Fig. S2 in the supplemental material; see also equation 3), all mutants remained significantly more tolerant than the unevolved 2xOriT strain; these strains likely have acquired mutations beneficial to both growth in minimum medium and in NaCl-challenged conditions. Furthermore, all isolated mutants were capable of growth at 0.80 M (47 g/liter) NaCl, a concentration that completely inhibits growth of the 2xOriT and Hfr-2xSFX− parent strains (see Fig. S3 in the supplemental material). In light of the improved NaCl tolerance of the mutants, we also examined their ability to withstand prolonged shocks under hyperosmotic conditions (5.45 M, 319 g/liter NaCl). While most mutants had no improvements in survival relative to 2xOriT under these conditions (data not shown), G3 and G6 rapidly lost viability, exhibiting a 10-fold or more decrease in shock tolerance. It is possible that survival under extreme NaCl concentrations versus growth at lower concentrations requires divergent tolerance mechanisms.
FIG 2.

Relative fitness of Hfr-2xSFX− and 2xOriT isolates under several abiotic stressors, including 0.65 M (38 g/liter) NaCl (A), 0.3 M glucose (B), 0.8% n-butanol (C), growth at 42°C (D), pH 6 (E), and without abiotic stressors (F). Error bars are 95% confidence intervals using the Student t distribution.
Osmotic tolerance and other complex phenotypes.
Resistance to osmotic stress is known to affect other phenotypes of industrial interest, such as n-butanol or low pH tolerance (17, 28) and growth at elevated temperatures (29). Growth assays of the mutants in the presence of inhibitory levels of glucose, 0.8% n-butanol, mild acidic pH, and thermal stress (Fig. 2B to E) revealed that the observed tolerance phenotypes are mostly specific to NaCl resistance alone. The G3 and G4 isolates exhibited increased tolerance of stress-inducing glucose concentrations (10). Glucose and thermal tolerance levels of the other isolates were generally similar to or slightly below that of the wild-type reference, so it is unlikely that there is a fundamental incompatibility between osmotic tolerance and these phenotypes in general. The acid tolerance of the mutants varied widely for the Hfr mutants, with G5 and G6 exhibiting large (25 to 37%) declines in fitness even under mildly acidic pH. Significant but small decreases in relative fitness under acid stress were also observed in all A mutants. These results imply that there is some degree of antagonistic pleiotropy between tolerance of high osmotic pressures and acid stress, but additional investigation is needed to confirm this hypothesis.
Interestingly, no isolate had improved n-butanol tolerance in this case, contrary to previous examples of n-butanol-osmotic stress cross-adaptation (4, 17). The reasons for this apparent incompatibility are unclear, especially given that Dragosits et al. observed a slightly increased level of n-butanol tolerance in an isolate evolved under continuous 0.3 M NaCl stress (17). Stronger NaCl selection could disfavor mutations that also improve n-butanol resistance, as it is reasonable to expect that different levels of osmotic stress select for distinct tolerance mechanisms. n-Butanol tolerance is also not always associated with improved osmotic stress resistance in evolved mutants (28), so there are at least some evolutionary paths on both the NaCl and n-butanol landscapes that lead to divergent tolerance phenotypes. The overall lack of significant cross-adaptation for the isolates in this case does indicate that specialist mutants with adaptations specific only to NaCl tolerance are favored under these evolutionary conditions.
Genetic patterns of adaptation.
In order to better understand the genetic bases for the observed osmotolerance phenotypes and to compare tolerance mechanisms between the sexual and asexual populations, we sequenced the genomes of A1 to A6 (2xOriT parent) and G1 to G6 (Hfr-2xSFX− parent) isolates. A complete list of mutated genes, their putative functions, and the structure of each mutation in the isolates is given in Table 1; a full description of each mutation is given in Table S2 in the supplemental material. Many isolates (8/12) harbor likely inactivating frameshift mutations or large deletions within the N-acetylglucosamine (NAG) catabolic operon (nag), either in the gene encoding the transcriptional repressor nagC or the deacetylase nagA. Amino sugar catabolism (see Fig. S4 in the supplemental material) may therefore have been altered in these strains. Although this adaptation has not been previously observed in strains evolved under continual osmotic stress, NAG forms a crucial component of peptidoglycan (30), and it is readily conceivable that adaptation to high osmotic stress would involve alterations to cell wall biosynthesis or peptidoglycan recycling. Mutations affecting glucosamine-6-phosphate biosynthesis have also been identified in evolved isobutanol-tolerant E. coli (12), so this may be a common mechanism of adaptation to certain membrane-disrupting environmental conditions. Mutants A1, A2, and A3, all containing mutations in nagA, were unable to metabolize NAG as a sole carbon source as expected (see Fig. S5 in the supplemental material) (31). G4 unexpectedly failed to grow as well, despite the fact that the strain harbors no mutations affecting NAG genes; it is possible that this strain has a large genomic rearrangement affecting nagA expression that was not detected in our analysis.
TABLE 1.
Mutations identified with genome sequencinga
| Strain | Gene(s) | Function | Type | Location (no. of bpc) |
|---|---|---|---|---|
| G1 | nmpC, essD | Outer membrane protein, holin | SNP | Intergenic |
| cadB | Lysine, cadaverine transporter | SNP | A171A | |
| G2 | nagCD | NAG metabolism | Deletion | Coding (−715) |
| yhdP | Unknown | SNP | L318R | |
| G3 | rpoCb | β′ subunit of RNAP | Duplication | Coding (2 × 84) |
| treR | Trehalose regulator | SNP | S61S | |
| G4 | rpoCb | β′ subunit of RNAP | Duplication | Coding (2 × 84) |
| hisCb | Histidine biosynthesis | SNP | T170P | |
| G5 | nagC | NAG metabolism | Deletion | Coding (−1) |
| G6 | mrdAb | Penicillin binding protein 2 | SNP | Q51L |
| rpsAb | 30S protein S1 | SNP | Q421K | |
| ydjK | Predicted transporter | SNP | P17S | |
| A1 | nagA | NAG-6P deacetylase | Deletion | Coding (−1) |
| bcr | Multidrug efflux transporter | SNP | S8A | |
| A2 | mreBb | Actin homolog | SNP | I336L |
| nagA | NAG-6P deacetylase | Deletion | Coding (−1) | |
| A3 | mreBb | Actin homolog | SNP | T171S |
| nagA | NAG-6P deacetylase | SNP | A203E | |
| proV | Glycine betaine transporter | IS1 | Coding (+9) | |
| msrB | Methionine sulfoxide repair | SNP | C118F | |
| fimA | Fimbriae A | IS186 | Coding (+6) | |
| A4 | nagCD | NAG metabolism | Deletion | Coding (−1,570) |
| proV | Glycine betaine transporter | IS1 | Coding (+4) | |
| A5 | yejMb | Predicted hydrolyase | Duplication | Coding (2 × 9) |
| nagC | NAG metabolism | Deletion | Coding (−2) | |
| mreBb | Actin homolog | SNP | S185F | |
| fimA | Fimbriae A | IS186 | Coding (+6) | |
| A6 | nagC | NAG metabolism | Insertion | Coding (+1) |
| mreBb | Actin homolog | SNP | K96Q | |
| bglB | Phospho-β-glucosidase | Deletion | Coding (−1) | |
| yobF, yebO | Stress, predicted protein | SNP | Intergenic |
List of mutations found in each strain (G1 to G6, A1 to A6) relative to their respective parental genotypes. NAG, n-acetylglucosamine.
Known essential genes (in general and in glucose minimal medium supplemented with tryptophan specifically). The rpoC duplication in G3 and G4 duplicates amino acids 370 to 396 (KKMALELFKPFIYGKLELRGLATTIKA) in domain 2 of the protein (38).
The number of base pairs corresponding to the mutation (e.g., +9 indicates 9 bp added, −1 indicates 1 bp deleted, and 2 × 84 indicates a duplication of 84 bp).
Besides alterations in NAG metabolism, genes encoding cell shape regulators are frequently mutated in the evolved strains. Nonsynonymous SNPs in the cell shape-regulating actin homolog mreB (32) and the peptidoglycan transpeptidase mrdA genes (33) were identified in five different mutants, suggesting that changes in cell morphology might also reduce osmotic stress on the cell. Microscope examination of the affected strains showed neither a gross difference in cell shape compared to parental controls (data not shown) nor abnormal filamentation, so the precise effect of these mutations remains unclear. Coincidentally, a previous study examining mreB and mrdA mutations that suppressed an abnormal shape phenotype caused by RodZ deficiency (34) detected an identical SNP in mrdA, implying that RodZ activity may also be deficient under osmotic stress. It is difficult to speculate on how nag and mreB mutations might interact in the A1, A2, A5, and A6 mutants, as they affect related but distinct cellular processes; changes in mreB-chromosomal interactions may result in altered cell division or chromosomal segregation, which may in turn affect the amount of NAG precursor generated from peptidoglycan recycling. Given the seeming ubiquity of mutations affecting both pathways, it is clear that perturbation of cell shape proteins or peptidoglycan metabolism is important for osmotic tolerance.
While both groups of mutants had similar mutation rates (see Materials and Methods), transposon insertions in fimA (type I fimbriae) and proV (the ATP binding cassette for the proVXW glycine betaine transporter) were observed only in the A strains. Fimbrial components, including fimA, are highly upregulated under osmotic stress (35), and a mutation that inactivates fimA presumably results in conservation of carbon and energy. The relationship between nagA, nagC, and surface fiber expression may also play a role in the fitness benefit of fimA inactivation, as the fimA insertions in A3 and A5 are associated with nag mutations as well. The inactivation of proV is more peculiar, given its extensively studied role in importing osmoprotectants into the cell (36). Nonsense mutations affecting proV have been previously observed in osmotolerant mutants (17), providing additional evidence that proV is under negative selection in hyperosmotic glucose minimal medium.
Mutations in several other genes, while not specifically known to affect osmotic tolerance, were also detected. G1 exhibited both a synonymous mutation in the cadB lysine transporter and an intergenic SNP between nmpC (an outer membrane protein associated with peptidoglycan) and essD, a holin for the integrated prophage DLP12. The latter gene has been shown to be important for cell wall maintenance and biofilm formation (37), which may explain the distinct mechanism behind G1's osmotic tolerance. G3 and G4 were found to have an 84-bp in-frame duplication (amino acids 370 to 396) within the rpoC subunit of RNA polymerase. The duplications occur in region 2 of the protein, which is responsible for RNA polymerization (38). Due to the role of rpoC in promoter recognition and sigma factor binding (39), this mutation should result in significant transcriptional and ultimately phenotypic alterations. Mutations in rpoC (along with rpoB) have been observed previously in other long-term evolution studies (27) as well, indicating that a wide range of phenotypes can be improved via alteration of RNA polymerase components. A small in-frame duplication was also observed in the essential but uncharacterized hydrolase gene yejM, but the effect of this mutation is unclear. A range of SNPs in intergenic regions and the coding sequences of various other genes were also detected, including a synonymous substitution in treR, a negative regulator of trehalose biosynthesis, in G3 and the S6 ribosomal protein rpsA in G6. Other mutations of ribosomal proteins have been found to confer salt tolerance as well (40) by impairing ribosome maturation, but further investigation is needed to understand the functional consequences of this particular point mutation.
In order to better understand the effect of these mutations on osmotolerance, we performed three tests to quantify the fitness effect of gene overexpression, compensation, and knockout on an unaltered host strain (BW25113) and the isolated evolved mutants. Eleven genes (nmpC, yobF, ydjK, mreB, fimA, nagC, nagA, proV, treR, ydhP, and cadB) were selected for overexpression studies due to their frequency of mutation or nearby intergenic or synonymous SNPs (results shown in Fig. 3A). Of all genes tested, only ydjK overexpression conferred a statistically significant improvement in osmotolerance. YdjK is annotated as a putative metabolite transporter, and due to the inclusion of tryptophan in the evolution medium, we reasoned that it might be an uncharacterized tryptophan transporter. However, YdjK did not confer a benefit in the absence of stress (P = 0.25, Student's t test), so its true function remains unclear. Overexpression of proV, nagC, or nagA is also somewhat deleterious under these growth conditions, though fimA, which underwent transposon insertions in several independent mutants, did not have a significant effect on host fitness under these conditions.
FIG 3.

Batch growth screening of overexpression, knockout, and compensatory strains to identify their osmotolerance phenotypes in glucose minimal medium supplemented with 0.55 M NaCl. (A) Fitness of overexpression strains relative to the empty vector pCA24N control. Only ydjK expression results in a significant tolerance improvement. (B) Fitness of knockout strains relative to BW25113; strain genotypes are denoted as follows: C, ΔNagC; A, ΔNagA; F, ΔFimA; and P, ΔProV. (C) Overexpression of NagC and NagA in mutants with possibly inactivating mutations in these genes; fitness is relative to the corresponding mutant with pCA24N. (D) Overexpression of FimA and ProV in mutants with possibly inactivating mutations in these genes, with the empty vector as a reference. All error bars are 95% confidence intervals based on the Student distribution.
Likely inactivating mutations in a small set of genes, including nagC, nagA, fimA, and proV, were identified in several of the G and A mutants. Various combinations of these mutations were found in the evolved mutants, suggesting the presence of potential epistatic interactions that affect osmotic tolerance. We tested this hypothesis by systematically reconstructing double and triple mutants containing defined nagA or nagC disruptions, along with knockouts in fimA and proV. Figure 3B shows the relative fitness of these knockout mutants versus an unmodified BW25113 strain. Of the single mutants, only the ΔproV strain is fitter than the reference. Interestingly, the nagA knockout has a large negative impact on strain fitness, suggesting that the insertion and deletion mutations identified in the sequenced mutants were not completely inactivating or the inactivation of nagA has a positive synergistic effect with other mutations in these mutants. As potential evidence for the presence of synergistic interactions between mutations, double knockouts of ΔnagC and ΔproV or ΔnagA and ΔfimA were found to be beneficial in the presence of NaCl challenge. Only the ΔnagC ΔfimA ΔproV triple mutant showed improved osmotolerance relative to BW25113. These combinations did not occur in any mutant, and it is possible structural differences between the defined knockouts and mutations in the osmotolerant isolates could also influence these results. Overall, as was the case with overexpression analysis, these results indicate that these four genes affect the E. coli osmotolerance phenotype.
An additional way of confirming that the mutations in nagA, nagC, proV, and fimA play a role in modulating osmotolerance is to complement the mutations in trans with an expression plasmid and then reassay their fitness under osmotic stress. The results of this test are shown in Fig. 3C and D and indicate that the effect of compensation depends heavily on the genetic background of the particular mutant. Relative fitness of only two nagC mutants (G5 and A4) out of five is decreased by nagC overexpression, while nagA complementation decreased osmotic tolerance of A1 to A3. The structure of the nagC mutations does vary significantly between the mutants, which may explain the lack of concordance in complementation results. Complementing the proV mutations in A3 and A4 had no significant fitness effect. While fimA overexpression decreased the fitness of A3, it also improved the fitness of A5 slightly, despite their identical IS186 insertions into the gene. It is likely that genetic differences between the various mutants and interactions between other mutations not screened in this assay also play a significant role in determining the fitness impact of gene complementation.
Though genome sequencing has revealed several novel loci involved with osmotolerance, the genotype-phenotype relationship remains unclear. To gain a more complete understanding of how these mutations translate into improved osmotic stress tolerance, we applied microarray technology to several A and G mutants with distinct underlying mutations to identify transcriptional perturbations that may result from their underlying mutations or altered stress responses.
Mutation-induced transcriptional perturbations.
Six sequenced mutants, G2, G3, G5, G6, A2, and A4, were selected for transcriptomic analysis based on their distinct underlying genotypes and varied levels of osmotolerance and therefore are likely to have diverse tolerance mechanisms. Genes commonly upregulated in these mutants, along with those representing possibly novel mechanisms, are listed in Table 2. The gene encoding AcrZ, a small protein associated with the AcrAB-TolC efflux pump complex known to affect AcrB substrate recognition (41), is upregulated in all mutants except A4, suggesting that it may be an important transcriptional adaptation. Sulfonate transport and metabolism genes (tauABC, ssuEADC) are also frequently upregulated in the mutants. Ordinarily, these proteins are intended to scavenge sulfur from the environment, but under osmotic stress, they can also import osmoprotectants such as taurine (42). This upregulation cannot be explained as simple sulfur starvation, as the mutants and references were in exponential growth before RNA harvesting. The proVXW operon, positively regulated by hyperosmotic conditions (43), is also overexpressed by G3 and G5, though proX and proW are also overexpressed in A4, G3, G5, and G6. This expression pattern may explain the fitness benefit of proV deletion found in A3 and A4 in terms of energy conservation, as discussed previously.
TABLE 2.
Overexpressed genes of interesta
| Gene | COGb | Function | Strain(s) |
|---|---|---|---|
| acrZ | Cell envelope stress response | A4, G2, G3, G5, G6 | |
| ssuD | C | Alkanesulfonate monooxygenase | G2, G3, G5, G6 |
| proV | E | Glycine betaine transporter subunit | G3, G5 |
| proW | E | Glycine betaine transporter subunit | A4, G6 |
| proX | E | Glycine betaine transporter subunit | A4, G3, G5, G6 |
| tnaA | E | Tryptophanase/l-cysteine desulfhydrase | G2, G3, G5, G6 |
| tnaB | E | Tryptophan transporter of low affinity | G2, G3, G6 |
| entC | HQ | Isochorismate synthase 1 | G3 |
| acs | I | Acetyl-CoA synthetase | G5, G6 |
| ymdC | I | Cardiolipin synthase 3 | G2 |
| fabF | IQ | 3-Oxoacyl-[acyl carrier protein] synthase II | G6 |
| nagC | KG | Repressor of NAG operon | A4, G2 |
| arnC | M | Undecaprenyl phosphate-l-Ara4FN transferase | A2, A4 |
| lpp | M | Murein lipoprotein | A2, A4, G2, G3 |
| ompA | M | Outer membrane porin A | G2 |
| ompC | M | Outer membrane porin C | G2, G3, G5, G6 |
| ompG | M | Outer membrane porin G | A2, A4 |
| ompL | M | Outer membrane porin L | A2, A4 |
| ompX | M | Outer membrane protein X | A2, A4, G3, G5 |
| feoB | P | Fused ferrous iron transporter | G5 |
| fepG | P | Iron-enterobactin transporter subunit | G5 |
| fiu | P | Catecholate siderophore receptor Fiu | G3 |
| ssuA | P | Putative aliphatic sulfonate binding protein | G2, G3, G5 |
| ssuC | P | Putative alkanesulfonate transporter subunit | A2, A4, G2, G3, G6 |
| tauA | P | Taurine transporter subunit | G3, G6 |
| tauB | P | Taurine transporter subunit | G2, G3, G6 |
| tauC | P | Taurine transporter subunit | A4, G2, G3, G5, G6 |
| entE | Q | Enterobactin synthase complex component | G3 |
| entF | Q | Enterobactin synthase complex component | G3, G5 |
| entH | Q | Thioesterase for efficient enterobactin production | G3 |
| tauD | Q | Taurine dioxygenase, 2-oxoglutarate dependent | G3, G6 |
| fadM | R | Long-chain acyl-CoA thioesterase III | G2, G3, G6 |
| ssuE | R | NAD(P)H-dependent FMN reductase | G2, G3, G5, G6 |
| ydcH | S | Predicted protein | G2, G3, G5, G6 |
| yodC | S | Predicted protein | G2, G3, G5, G6 |
| csrA | T | Carbon source metabolism regulator | G2, G3, G5 |
Overexpressed genes of interest for A2, A4, G2, G3, G5, and G6 as identified with microarray analysis. The overexpression of all genes listed here is statistically significant at a P value of ≤0.01. A complete list of overexpressed genes for all strains and their expression ratios is given in Table S3 in the supplemental material. CoA, coenzyme A.
COG, cluster of orthologous groups.
Though the 2xOriT and Hfr-2xSFX− parental strains are for the most part isogenic, the latter is a tryptophan auxotroph due to insertion of the tra operon into the trp locus (18). These four G strains all exhibited overexpression of the genes encoding the tryptophan transporter tnaB and tryptophanase tnaA, which converts tryptophan into indole and pyruvate, as has been previously observed in medium containing tryptophan (44). Indole is a potent signaling molecule involved with various aspects of biofilm and cell cycle regulation (45), so the physiological effect of excess indole is likely to be complex. G2, G5, and G6 exhibit statistically significant increases (P < 0.05, Student's t test) in indole accumulation compared to the Hfr-2xSFX− parent (Fig. 4) under osmotic stress. A4 produces significantly less indole (P < 0.045, Student's t test) than its 2xOriT ancestor as well. Despite the fact that G3 has roughly equivalent upregulation of tnaA transcription to these strains, indole production is similar to that of the wild type; it could be that the unusual in-frame duplication in rpoC in this strain results in increased tnaA transcription, but the resulting mRNA is poorly translated into protein or degraded rapidly due to posttranscriptional regulation.
FIG 4.
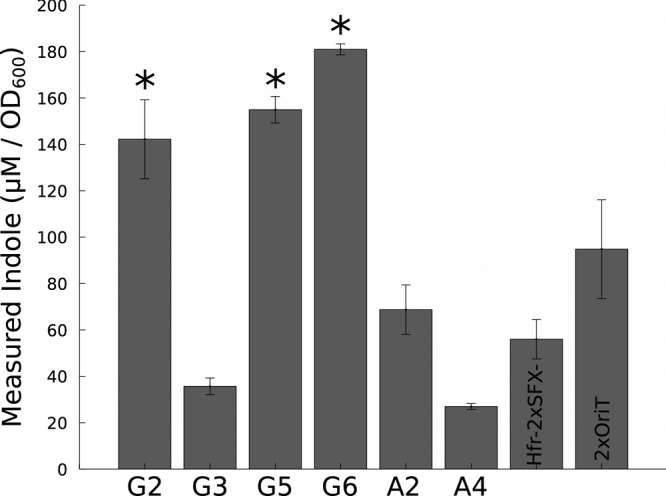
Levels of indole, normalized by biomass density, for G2, G3, G5, G6, A2, and A4 mutants, along with the G parent Hfr-2xSFX− and A parent 2xOriT. Error bars are standard deviations. G2, G5, and G6 (with asterisks) have statistically significant increases in indole accumulation compared to Hfr-2xSFX− (P < 0.05, Student's t test).
Due to the intertwined nature of indole and biofilm regulation, we also examined the biofilm formation propensity of the evolved mutants. Most G and A mutants under osmotic stress form significantly less biofilm than their ancestral parents (Fig. 5), though G mutants typically had larger decreases than the A strains. Perturbations in the nag pathway may play a role in modulating biofilm formation, as both nagA and nagC deletions have been shown to affect surface fiber synthesis, including curli (46) and fimbriae (47), due to the accumulation of intracellular NAG-6-phosphate. Given the large number of detected mutations that may affect biofilm formation or cell wall properties, this evolutionary route for tolerance improvement clearly warrants further research to better understand selection pressures on biofilm synthesis.
FIG 5.
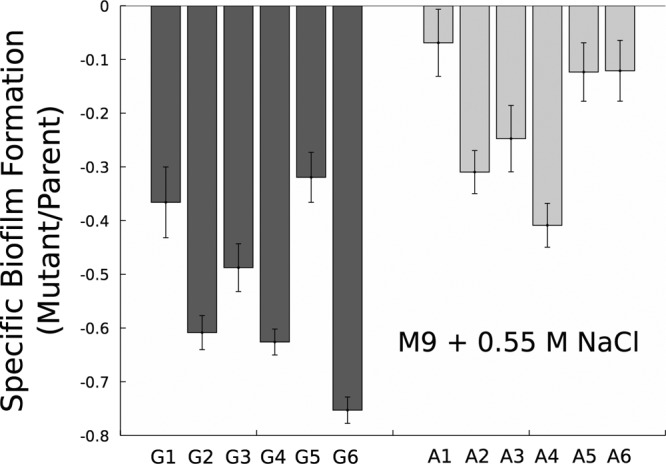
Relative biofilm formation by G1 to G6 and A1 to A6 mutants in glucose minimal medium with 0.55 M (32 g/liter) NaCl. Data are ratios of mutant-specific biofilm formation to parental formation (G, Hfr-2xSFX−; A, 2xOriT) under these conditions. Data are normalized by biomass yield (OD600). Error bars are 95% confidence intervals.
Beyond metabolite transporters, several genes involved with iron uptake (entCEFH, feoB, fepG, fiu) were overexpressed in G3 and G5 as well. Increased expression of iron transport and metabolism genes has been found in evolved mutants with improved osmotic or n-butanol tolerance (4, 17). Perturbation of iron metabolism may therefore be a contributor to osmotic tolerance, though the gene encoding the siderophore receptor fiu is also downregulated in G2 and G6. Genes involved in membrane composition were also upregulated in many mutants, particularly certain outer membrane porins (ompACGL) along with the ompX gene. These transcriptional disturbances may represent an attempt by the mutants to change membrane-sieving properties in order to reduce osmotic pressure on the cell. The peptidoglycan-outer membrane tether gene, lpp (murein lipoprotein), was also overexpressed in four different mutants (A2, A4, G2, G3), which may indicate that the peptidoglycan wall is more strongly attached to the outer membrane in these mutants to protect the cell against high external osmotic pressure. Several genes that encode hypothetical or predicted proteins (ydcH, yodC) are consistently overexpressed in the G mutants, but no information about their biochemical roles or relationship with osmotolerance is known.
In contrast to the relative similarities in gene overexpression under osmotic stress between these six mutants, less similarity is observed for genes repressed relative to the parental references (Table 3). The few commonly repressed genes include those coding for several hypothetical or conserved proteins (yegR, ydeMN, rtcB) and the transcriptional activator ydeO, known to regulate acid resistance in concert with EvgA (48). Their repression may be associated with the reduced osmotic stress experienced by the mutants compared to that of their parents under these conditions, as these genes are not known to be directly regulated by osmotic stress. Downregulation of several siderophores and enterobactin transporters was observed in G2, G5, and G6, including fepA, which was found to be strongly overexpressed in a previously evolved osmotolerant E. coli strain (17).
TABLE 3.
Repressed genes of interesta
| Gene | COGb | Function | Strain(s) |
|---|---|---|---|
| yegR | Predicted protein | A4, G2, G, G5, G6 | |
| rfaZ | Lipopolysaccharide core biosynthesis protein | A2, A4 | |
| nagB | G | Glucosamine-6-phosphate deaminase | A4, G2, G3, G5 |
| nagE | G | NAG PTS enzyme: IIC, IIB, IIA components | G2, G3, G5 |
| nagA | G | N-Acetylglucosamine-6-phosphate deacetylase | G2, G3 |
| fabD | I | Malonyl-CoA-[acyl carrier protein] transacylase | G6 |
| ydeO | K | Transcriptional activator for mdtEF | G2, G3, G5, G6 |
| rpoB | K | RNA polymerase, β subunit | A2, A4 |
| rpoC | K | RNA polymerase, β′ subunit | A2, A4 |
| rpoE | K | RNA polymerase, σE factor | A2, A4 |
| fimB | L | FimA promoter invertase | G6 |
| bamC | M | Lipoprotein required for OM biogenesis | A2, A4 |
| kdsB | M | 3-Deoxy-manno-octulosonate cytidylyltransferase | A2, A4 |
| mltD | M | Predicted lytic murein transglycosylase D | A2, A4 |
| murC | M | UDP-N-acetylmuramate:l-alanine ligase | A2, A4 |
| murI | M | Glutamate racemase | A2, A4 |
| ompF | M | Outer membrane porin 1a (Ia;b;F) | G3, G6 |
| wbbK | M | Lipopolysaccharide biosynthesis protein | A2, A4 |
| acrA | M | Multidrug efflux system | G6 |
| acrE | M | Cytoplasmic membrane lipoprotein | G5 |
| amiB | M | N-Acetylmuramoyl-l-alanine amidase II | A4 |
| flgJ | MNO | Muramidase | G5 |
| fimC | NU | Chaperone, periplasmic | G5, G6 |
| fimA | NU | Major type 1 subunit fimbrin (pilin) | G6 |
| fimD | NU | Puter membrane usher protein | G5 |
| fimG | NU | Minor component of type 1 fimbriae | G5 |
| fimI | NU | Type 1 pilus biosynthesis protein | G6 |
| ydeN | P | Conserved protein | A2, A4, G3, G5 |
| fiu | P | Catecholate siderophore receptor Fiu | G2, G6 |
| cirA | P | Catecholate siderophore receptor CirA | G6 |
| efeO | P | Inactive ferrous ion transporter EfeUOB | G6 |
| fecD | P | Iron-dicitrate transporter subunit | G5 |
| fepA | P | Iron-enterobactin outer membrane transporter | G6 |
| ydeM | R | Conserved protein | G2, G3, G5 |
| rtcB | S | Conserved protein | G3, G5, G6 |
Repressed genes of interest for A2, A4, G2, G3, G5, and G6. The repression of all genes is statistically significant at a P value of ≤0.01. A complete list of repressed genes for all strains and their expression ratios is given in Table S3 in the supplemental material. CoA, coenzyme A.
COG, cluster of orthologous groups.
As was the case for upregulated genes, repression of genes involved with peptidoglycan and membrane biosynthesis was significantly enriched in the mutant transcriptomes according to gene ontology analysis. NAG catabolism genes, nagA, nagB, and nagE, were repressed in A4 and several G mutants. Repression of many other peptidoglycan or outer membrane-related genes was observed in A2 and A4, particularly those genes involved with cell wall maturation (mltD, murC) or lipopolysaccharide synthesis (rfaZ, kdsB, wbbK). Membrane remodeling therefore appears to be a significant adaptive response in these mutants. Fimbriae synthesis and assembly genes were also repressed in G5 and G6, lending credence to the hypothesis that fimA inactivation may be part of an energy conservation response during laboratory evolution. Porin synthesis also is perturbed in G3 and G6 by simultaneous repression of ompF and overexpression of ompC, as is typically observed under high osmotic pressure (49). The totality of these transcriptional responses point to wide-ranging changes in gene expression affecting membrane composition, transport activity, iron metabolism, and other systems stemming from various underlying genetic changes, to alleviate osmotic stress in these mutants.
Comparison of sexual, asexual adaptation.
Evolving populations are generally genetically heterogeneous and therefore contain competing mutant lineages that have arisen independently. Clonal interference will generally reduce this diversity, possibly resulting in a more narrow distribution of mutant fitnesses within asexual populations. To test this hypothesis, we isolated random clones from the Hfr-2xSFX− and 2xOriT populations to evaluate the degree of fitness heterogeneity within each population and to determine whether horizontal gene transfer had a detectable effect on the population structure. The fitness distributions for these populations, shown in Fig. 6, show that Hfr-2xSFX− lines tended to have a slightly higher mean relative fitness but with significantly more variance than the 2xOriT replicates at a high level of significance (P = 1.81 × 10⁻⁴, Kolmogorov-Smirnov test). Genetic diversity within Hfr-2xSFX− lines may therefore be greater than that of the 2xOriT populations; a likely explanation is that horizontal gene transfer reduces the extinction of beneficial clones due to clonal interference and drift, resulting in a maintenance of heterogeneity that is less likely to occur in an asexual population (50, 51). However, as all populations reached similar fitness endpoints during the experiment, further adaptation beyond that observed here could be mutation limited.
FIG 6.

Histogram of relative fitness (to 2xOriT) in randomly screened isolates from six Hfr-2xSFX− (A) and 2xOriT (B) populations. All isolates were challenged with 0.65 M (38 g/liter) NaCl. Differences in the underlying fitness distributions in the Hfr-2xSFX− and 2xOriT populations are highly significant (P = 1.81 × 10⁻⁴, Kolmogorov-Smirnov test).
In an attempt to further improve the observed NaCl tolerance levels of the mutants, we performed a short-term mating experiment where the G1 to G6 isolates were mixed together to facilitate genetic transfer and then propagated under NaCl selection for 5 days. Surprisingly, analysis of clonal isolates from the mixed G population revealed that the fittest clones were no better than the original fittest Hfr-2xSFX− mutant G6 (data not shown). Genome sequencing revealed that many of the G mutants have mutations in close proximity or actually overlapping in the case of the independent nagC mutations. Recombination events capable of combining these genotypes may therefore be rare. Negative epistasis between other mutations may have also prevented successful generation of recombinants.
Conclusions.
These results provide new insight into the E. coli osmotolerance phenotype. All isolates exhibited high levels of osmotolerance as expected, and a surprising lack of cross-adaptation to other stressors, such as excess glucose, n-butanol, low pH, and thermal stress. Genomic sequencing revealed novel mutations in genes related to n-acetylglucosamine catabolism, cell shape regulation, uptake of osmoprotectants, and global regulators such as rpoC. Many of the mutations occurred in genes known to affect cell wall or peptidoglycan maintenance. On a transcriptional level, membrane and peptidoglycan synthesis, porin expression, sulfonate uptake, and iron metabolism are all significantly perturbed in various evolved mutants relative to their parental references and might be targets of interest for future studies of this phenotype. Future work will continue to explore the transcriptomic data in hopes of identifying additional loci influencing osmotic tolerance, in addition to reconstructing the observed mutations in the A and G isolates in industrial E. coli strains to improve their osmotolerance under industrial conditions.
Supplementary Material
ACKNOWLEDGMENTS
This work was financially supported by the National Science Foundation graduate research fellowship program, NSF MCB-1054276, and the Norman Hackerman Foundation (project no. 000512-0004-2011).
We specifically thank A. Typas and C. Gross for providing the strains used to construct Hfr-2xSFX−, A. Jayaraman for providing materials and guidance for indole and biofilm assays, and D. Siegele for providing P1vir lysate.
Footnotes
Published ahead of print 11 April 2014
Supplemental material for this article may be found at http://dx.doi.org/10.1128/AEM.00499-14.
REFERENCES
- 1.Sandoval NR, Mills TY, Zhang M, Gill RT. 2011. Elucidating acetate tolerance in E. coli using a genome-wide approach. Metab. Eng. 13:214–224. 10.1016/j.ymben.2010.12.001 [DOI] [PubMed] [Google Scholar]
- 2.Almario MP, Reyes LH, Kao KC. 2013. Evolutionary engineering of Saccharomyces cerevisiae for enhanced tolerance to hydrolysates of lignocellulosic biomass. Biotechnol. Bioeng. 110:2616–2623. 10.1002/bit.24938 [DOI] [PubMed] [Google Scholar]
- 3.Minty JJ, Lesnefsky AA, Lin F, Chen Y, Zaroff TA, Veloso AB, Xie B, McConnell CA, Ward RJ, Schwartz DR, Rouillard JM, Gao Y, Gulari E, Lin XN. 2011. Evolution combined with genomic study elucidates genetic bases of isobutanol tolerance in Escherichia coli. Microb. Cell Fact. 10:18. 10.1186/1475-2859-10-18 [DOI] [PMC free article] [PubMed] [Google Scholar]
- 4.Reyes LH, Almario MP, Winkler J, Orozco MM, Kao KC. 2012. Visualizing evolution in real time to determine the molecular mechanisms of n-butanol tolerance in Escherichia coli. Metab. Eng. 14:579–590. 10.1016/j.ymben.2012.05.002 [DOI] [PubMed] [Google Scholar]
- 5.Shiloach J, Fass R. 2005. Growing E. coli to high cell density: a historical perspective on method development. Biotechnol. Adv. 23:345–357. 10.1016/j.biotechadv.2005.04.004 [DOI] [PubMed] [Google Scholar]
- 6.Dobson R, Gray V, Rumbold K. 2012. Microbial utilization of crude glycerol for the production of value-added products. J. Ind. Microbiol. Biotechnol. 39:217–226. 10.1007/s10295-011-1038-0 [DOI] [PubMed] [Google Scholar]
- 7.Rumbold K, van Buijsen HJ, Overkamp KM, van Groenestijn JW, Punt PJ, Van Der Werf MJ. 2009. Microbial production host selection for converting second-generation feedstocks into bioproducts. Microb. Cell Fact. 8:64. 10.1186/1475-2859-8-64 [DOI] [PMC free article] [PubMed] [Google Scholar]
- 8.Padan E, Maisler N, Taglicht D, Karpel R, Schuldiner S. 1989. Deletion of ant in Escherichia coli reveals its function in adaptation to high salinity and an alternative Na+/H+ antiporter system(s). J. Biol. Chem. 264:20297–20302 [PubMed] [Google Scholar]
- 9.Rozwadowski KL, Khachatourians GG, Selvaraj G. 1991. Choline oxidase, a catabolic enzyme in Arthrobacter pascens, facilitates adaptation to osmotic stress in Escherichia coli. J. Bacteriol. 173:472–478 [DOI] [PMC free article] [PubMed] [Google Scholar]
- 10.Purvis JE, Yomano L, Ingram L. 2005. Enhanced trehalose production improves growth of Escherichia coli under osmotic stress. Appl. Environ. Microbiol. 71:3761–3769. 10.1128/AEM.71.7.3761-3769.2005 [DOI] [PMC free article] [PubMed] [Google Scholar]
- 11.Dragosits M, Mattanovich D. 2013. Adaptive laboratory evolution—principles and applications for biotechnology. Microb. Cell Fact. 12:64. 10.1186/1475-2859-12-64 [DOI] [PMC free article] [PubMed] [Google Scholar]
- 12.Atsumi S, Wu TY, Machado IM, Huang WC, Chen PY, Pellegrini M, Liao JC. 2010. Evolution, genomic analysis, and reconstruction of isobutanol tolerance in Escherichia coli. Mol. Syst. Biol. 6:449. 10.1038/msb.2010.98 [DOI] [PMC free article] [PubMed] [Google Scholar]
- 13.Wright J, Bellissimi E, de Hulster E, Wagner A, Pronk JT, van Maris AJ. 2011. Batch and continuous culture-based selection strategies for acetic acid tolerance in xylose-fermenting Saccharomyces cerevisiae. FEMS Yeast Res. 11:299–306. 10.1111/j.1567-1364.2011.00719.x [DOI] [PubMed] [Google Scholar]
- 14.Toprak E, Veres A, Michel JB, Chait R, Hartl DL, Kishony R. 2011. Evolutionary paths to antibiotic resistance under dynamically sustained drug selection. Nat. Genet. 44:101–105. 10.1038/ng.1034 [DOI] [PMC free article] [PubMed] [Google Scholar]
- 15.Winkler J, Kao K. 2012. Harnessing recombination to speed adaptive evolution in Escherichia coli. Metab. Eng. 14:487–495. 10.1016/j.ymben.2012.07.004 [DOI] [PubMed] [Google Scholar]
- 16.Barrick JE, Yu DS, Yoon SH, Jeong H, Oh TK, Schneider D, Lenski RE, Kim JF. 2009. Genome evolution and adaptation in a long-term experiment with Escherichia coli. Nature 461:1243–1247. 10.1038/nature08480 [DOI] [PubMed] [Google Scholar]
- 17.Dragosits M, Mozhayskiy V, Quinones-Soto S, Park J, Tagkopoulos I. 2013. Evolutionary potential, cross-stress behavior and the genetic basis of acquired stress resistance in Escherichia coli. Mol. Syst. Biol. 9:643. 10.1038/msb.2012.76 [DOI] [PMC free article] [PubMed] [Google Scholar]
- 18.Typas A, Nichols RJ, Siegele DA, Shales M, Collins SR, Lim B, Braberg H, Yamamoto N, Takeuchi R, Wanner BL, Hirotada M, Weissman JS, Krogan NJ, Gross CA. 2008. High-throughput, quantitative analyses of genetic interactions in E. coli. Nat. Methods 5:781–787. 10.1038/nmeth.1240 [DOI] [PMC free article] [PubMed] [Google Scholar]
- 19.Achtman M, Kennedy N, Skurray R. 1977. Cell-cell interactions in conjugating Escherichia coli: role of TraT protein in surface exclusion. Proc. Natl. Acad. Sci. 74:5104–5108. 10.1073/pnas.74.11.5104 [DOI] [PMC free article] [PubMed] [Google Scholar]
- 20.Baba T, Ara T, Hasegawa M, Takai Y, Okumura Y, Baba M, Datsenko KA, Tomita M, Wanner BL, Mori H. 2006. Construction of Escherichia coli K-12 in-frame, single-gene knockout mutants: the Keio collection. Mol. Syst. Biol 2:2006.0008. 10.1038/msb4100050 [DOI] [PMC free article] [PubMed] [Google Scholar]
- 21.Kitagawa M, Ara T, Arifuzzaman M, Ioka-Nakamichi T, Inamoto E, Toyonaga H, Mori H. 2006. Complete set of ORF clones of Escherichia coli ASKA library (a complete set of E. coli K-12 ORF archive): unique resources for biological research. DNA Res. 12:291–299. 10.1093/dnares/dsi012 [DOI] [PubMed] [Google Scholar]
- 22.Datsenko KA, Wanner BL. 2000. One-step inactivation of chromosomal genes in Escherichia coli K-12 using PCR products. Proc. Natl. Acad. Sci. 97:6640–6645. 10.1073/pnas.120163297 [DOI] [PMC free article] [PubMed] [Google Scholar]
- 23.Young K. 2006. In vitro antibacterial resistance selection and quantitation. Curr. Protoc. Pharmacol. Chapter 13:Unit 13A.6. 10.1002/0471141755.ph13a06s34 [DOI] [PubMed] [Google Scholar]
- 24.Winkler J, Kao KC. 2011. Transcriptional analysis of Lactobacillus brevis to N-butanol and ferulic acid stress responses. PLoS One 6(8):e21438. 10.1371/journal.pone.0021438 [DOI] [PMC free article] [PubMed] [Google Scholar]
- 25.Domka J, Lee J, Wood TK. 2006. YliH (BssR) and YceP (BssS) regulate Escherichia coli K-12 biofilm formation by influencing cell signaling. Appl. Environ. Microbiol. 72:2449–2459. 10.1128/AEM.72.4.2449-2459.2006 [DOI] [PMC free article] [PubMed] [Google Scholar]
- 26.Genevaux P, Muller S, Bauda P. 1996. A rapid screening procedure to identify mini-Tn10 insertion mutants of Escherichia coli K-12 with altered adhesion properties. FEMS Microbiol. Lett. 142:27–30. 10.1111/j.1574-6968.1996.tb08402.x [DOI] [PubMed] [Google Scholar]
- 27.Conrad TM, Frazier M, Joyce AR, Cho BK, Knight EM, Lewis NE, Landick R, Palsson BØ 2010. RNA polymerase mutants found through adaptive evolution reprogram Escherichia coli for optimal growth in minimal media. Proc. Natl. Acad. Sci. 107:20500–20505. 10.1073/pnas.0911253107 [DOI] [PMC free article] [PubMed] [Google Scholar]
- 28.Reyes LH, Abdelaal AS, Kao KC. 2013. Genetic determinants for n-butanol tolerance in evolved E. coli mutants: cross adaptation and antagonistic pleiotropy between n-butanol and other stressors. Appl. Environ. Microbiol. 79. 17:5313–5320. 10.1128/AEM.01703-13 [DOI] [PMC free article] [PubMed] [Google Scholar]
- 29.Cullum AJ, Bennett AF, Lenski RE. 2001. Evolutionary adaptation to temperature. IX. Preadaptation to novel stressful environments of Escherichia coli adapted to high temperature. Evolution 55:2194–2202. 10.1111/j.0014-3820.2001.tb00735.x [DOI] [PubMed] [Google Scholar]
- 30.Vollmer W, Blanot D, De Pedro MA. 2008. Peptidoglycan structure and architecture. FEMS Microbiol. Rev. 32:149–167. 10.1111/j.1574-6976.2007.00094.x [DOI] [PubMed] [Google Scholar]
- 31.Holmes R, Russell R. 1972. Mutations affecting amino sugar metabolism in Escherichia coli K-12. J. Bacteriol. 111:290. [DOI] [PMC free article] [PubMed] [Google Scholar]
- 32.Vats P, Shih YL, Rothfield L. 2009. Assembly of the MreB-associated cytoskeletal ring of Escherichia coli. Mol. Microbiol. 72:170–182. 10.1111/j.1365-2958.2009.06632.x [DOI] [PubMed] [Google Scholar]
- 33.Ishino F, Park W, Tomioka S, Tamaki S, Takase I, Kunugita K, Matsuzawa H, Asoh S, Ohta T, Spratt B. 1986. Peptidoglycan synthetic activities in membranes of Escherichia coli caused by overproduction of penicillin-binding protein 2 and RodA protein. J. Biol. Chem. 261:7024–7031 [PubMed] [Google Scholar]
- 34.Shiomi D, Toyoda A, Aizu T, Ejima F, Fujiyama A, Shini T, Kohara Y, Niki H. 2013. Mutations in cell elongation genes mreB, mrdA and mrdB suppress the shape defect of RodZ-deficient cells. Mol. Microbiol. 87:1029–1044. 10.1111/mmi.12148 [DOI] [PMC free article] [PubMed] [Google Scholar]
- 35.Snyder JA, Haugen BJ, Buckles EL, Lockatell CV, Johnson DE, Donnenberg MS, Welch RA, Mobley HL. 2004. Transcriptome of uropathogenic Escherichia coli during urinary tract infection. Infect. Immun. 72:6373–6381. 10.1128/IAI.72.11.6373-6381.2004 [DOI] [PMC free article] [PubMed] [Google Scholar]
- 36.Kempf B, Bremer E. 1998. Uptake and synthesis of compatible solutes as microbial stress responses to high-osmolality environments. Arch. Microbiol. 170:319–330. 10.1007/s002030050649 [DOI] [PubMed] [Google Scholar]
- 37.Toba FA, Thompson MG, Campbell BR, Junker LM, Rueggeberg KG, Hay AG. 2011. Role of DLP12 lysis genes in Escherichia coli biofilm formation. Microbiology 157:1640–1650. 10.1099/mic.0.045161-0 [DOI] [PMC free article] [PubMed] [Google Scholar]
- 38.Punta M, Coggill PC, Eberhardt RY, Mistry J, Tate J, Boursnell C, Pang N, Forslund K, Ceric G, Clements J, Heger A, Holm L, Sonnhammer E, Eddy S, Bateman A, Finn R. 2012. The Pfam protein families database. Nucleic Acids Res. 40:D290–D301. 10.1093/nar/gkr1065 [DOI] [PMC free article] [PubMed] [Google Scholar]
- 39.Keseler IM, Mackie A, Peralta-Gil M, Santos-Zavaleta A, Gama-Castro S, Bonavides-Martinez C, Fulcher C, Huerta AM, Kothari A, Krummenacker M, Latendresse M, Mufffdiz-Rascado L, Ong Q, Paley S, Schroder I, Shearer AG, Subhraveti P, Travers M, Weerasinghe D, Weiss V, Collado-Vides J, Gunsalus RP, Paulsen I, Karp PD. 2013. EcoCyc: fusing model organism databases with systems biology. Nucleic Acids Res. 41:D605–D612. 10.1093/nar/gks1027 [DOI] [PMC free article] [PubMed] [Google Scholar]
- 40.Hase Y, Tarusawa T, Muto A, Himeno H. 2013. Impairment of ribosome maturation or function confers salt resistance on Escherichia coli cells. PLoS One 8(5):e65747. 10.1371/journal.pone.0065747 [DOI] [PMC free article] [PubMed] [Google Scholar]
- 41.Hobbs EC, Yin X, Paul BJ, Astarita JL, Storz G. 2012. Conserved small protein associates with the multidrug efflux pump AcrB and differentially affects antibiotic resistance. Proc. Natl. Acad. Sci. 109:16696–16701. 10.1073/pnas.1210093109 [DOI] [PMC free article] [PubMed] [Google Scholar]
- 42.Verheul A, Wouters J, Rombouts F, Abee T. 1998. A possible role of ProP, ProU and CaiT in osmoprotection of Escherichia coli by carnitine. J. Appl. Microbiol. 85:1036–1046. 10.1111/j.1365-2672.1998.tb05269.x [DOI] [PubMed] [Google Scholar]
- 43.Lucht JM, Bremer E. 1994. Adaptation of Escherichia coli to high osmolarity environments: osmoregulation of the high-affinity glycine betaine transport system ProU. FEMS Microbiol. Rev. 14:3–20. 10.1111/j.1574-6976.1994.tb00067.x [DOI] [PubMed] [Google Scholar]
- 44.Khodursky AB, Peter BJ, Cozzarelli NR, Botstein D, Brown PO, Yanofsky C. 2000. DNA microarray analysis of gene expression in response to physiological and genetic changes that affect tryptophan metabolism in Escherichia coli. Proc. Natl. Acad. Sci. 97:12170–12175. 10.1073/pnas.220414297 [DOI] [PMC free article] [PubMed] [Google Scholar]
- 45.Lee JH, Lee J. 2010. Indole as an intercellular signal in microbial communities. FEMS Microbiol. Rev. 34:426–444. 10.1111/j.1574-6976.2009.00204.x [DOI] [PubMed] [Google Scholar]
- 46.Barnhart MM, Lynem J, Chapman MR. 2006. GlcNAc-6P levels modulate the expression of curli fibers by Escherichia coli. J. Bacteriol. 188:5212–5219. 10.1128/JB.00234-06 [DOI] [PMC free article] [PubMed] [Google Scholar]
- 47.Sohanpal BK, El-Labany S, Lahooti M, Plumbridge JA, Blomfield IC. 2004. Integrated regulatory responses of fimB to N-acetylneuraminic (sialic) acid and GlcNAc in Escherichia coli K-12. Proc. Natl. Acad. Sci. 101:16322–16327. 10.1073/pnas.0405821101 [DOI] [PMC free article] [PubMed] [Google Scholar]
- 48.Ma Z, Masuda N, Foster JW. 2004. Characterization of EvgAS-YdeO-GadE branched regulatory circuit governing glutamate-dependent acid resistance in Escherichia coli. J. Bacteriol. 186:7378–7389. 10.1128/JB.186.21.7378-7389.2004 [DOI] [PMC free article] [PubMed] [Google Scholar]
- 49.Russo FD, Slauch JM, Silhavy TJ. 1993. Mutations that affect separate functions of OmpR the phosphorylated regulator of porin transcription in Escherichia coli. J. Mol. Biol. 231:261–273. 10.1006/jmbi.1993.1281 [DOI] [PubMed] [Google Scholar]
- 50.Fogle CA, Nagle JL, Desai MM. 2008. Clonal interference, multiple mutations and adaptation in large asexual populations. Genetics 180:2163–2173. 10.1534/genetics.108.090019 [DOI] [PMC free article] [PubMed] [Google Scholar]
- 51.Sniegowski PD, Gerrish PJ. 2010. Beneficial mutations and the dynamics of adaptation in asexual populations. Philos. Trans. R. Soc. B Biol. Sci. 365:1255–1263. 10.1098/rstb.2009.0290 [DOI] [PMC free article] [PubMed] [Google Scholar]
Associated Data
This section collects any data citations, data availability statements, or supplementary materials included in this article.