

Abstract
Wastewater discharges may increase the populations of pathogens, including Escherichia coli, and of antimicrobial-resistant strains in receiving waters. This study investigated the impact of UV and peracetic acid (PAA) disinfection on the prevalence of virulence and antimicrobial resistance genes in uropathogenic Escherichia coli (UPEC), the most abundant E. coli pathotype in municipal wastewaters. Laboratory disinfection experiments were conducted on wastewater treated by physicochemical, activated sludge, or biofiltration processes; 1,766 E. coli isolates were obtained for the evaluation. The target disinfection level was 200 CFU/100 ml, resulting in UV and PAA doses of 7 to 30 mJ/cm2 and 0.9 to 2.0 mg/liter, respectively. The proportions of UPECs were reduced in all samples after disinfection, with an average reduction by UV of 55% (range, 22% to 80%) and by PAA of 52% (range, 11% to 100%). Analysis of urovirulence genes revealed that the decline in the UPEC populations was not associated with any particular virulence factor. A positive association was found between the occurrence of urovirulence and antimicrobial resistance genes (ARGs). However, the changes in the prevalence of ARGs in potential UPECs were different following disinfection, i.e., UV appears to have had no effect, while PAA significantly reduced the ARG levels. Thus, this study showed that both UV and PAA disinfections reduced the proportion of UPECs and that PAA disinfection also reduced the proportion of antimicrobial resistance gene-carrying UPEC pathotypes in municipal wastewaters.
INTRODUCTION
UV radiation and peracetic acid (PAA) have been used for disinfection in municipal wastewater treatment plants due to their strong biocidal effects at low doses on a wide range of microbes, including Escherichia coli, and the low levels of disinfection by-products produced (1, 2). Wastewater disinfection is carried out to meet indicator microorganism discharge limits set by local authorities, e.g., in Canada, the limit is <200 CFU per 100 ml (CFU/100 ml) for recreational waters (3). Disinfection may have an impact on the composition of the surviving E. coli population with respect to the proportions of pathogenic and antimicrobial-resistant strains and with respect to the co-occurrence of virulence and antimicrobial resistance genes. These are the main questions of this study.
E. coli is normally considered nonpathogenic; however, some specific strains are pathogenic and can cause disease outbreaks associated with recreational waters (4) or with contaminated food (5) and drinking waters (6). Based on their distinct virulence properties and clinical symptoms of the host, E. coli strains are classified into three main categories: commensal (nonpathogenic), intestinal pathogenic E. coli (IPEC), and extraintestinal pathogenic E. coli (ExPEC). IPECs are further grouped into seven pathotypes, while ExPECs comprise three (7). Although the importance of the fecal-oral transmission route is obvious for IPEC pathotypes, it has been suggested that this route may also play a role in the dissemination of ExPEC pathotypes. Indeed, a number of studies have reported epidemiologically unrelated individuals in a community that were infected with clonally related strains (8, 9). Therefore, E. coli is a good model species to study the dynamics between pathogenic and nonpathogenic strains during wastewater treatment processes, and these questions are important for public health in relation to both IPEC and ExPEC pathotypes.
Beyond their importance as infectious agents, E. coli strains may serve as vectors for the dissemination of antimicrobial resistance genes due to their ability to colonize human and animal intestines and their capacity to live outside animal hosts. In this respect, ExPEC strains are of particular interest because several studies have suggested that ExPEC virulence factors provide competitive advantages for intestinal colonization (10–12), and a positive co-occurrence of virulence and antimicrobial resistance genes has been observed in our previous studies in ExPEC pathotypes (mainly in uropathogenic E. coli [UPEC], a subcategory of ExPECs) from municipal wastewaters (13) as well as in earlier studies of clinical ExPEC isolates (14). Furthermore, clinically important ExPEC clonal groups of isolates (e.g., groups CGA and ST131) have been identified as multidrug resistant and were detected in significant numbers in municipal wastewaters (15, 16), which reinforces the idea that ExPECs are potentially good antimicrobial resistance gene vectors.
E. coli pathogenesis is based on the assembly of a suitable number and combination of virulence genes that encode one or multiple virulence factors (17). Detection of these genes can be used to recognize pathotypes. For the current study, it was decided to focus on extraintestinal UPECs because of their predominance among the E. coli population in wastewaters (see below) and their potential role for the dissemination of antimicrobial resistance genes described above. According to the recent virulence factor database report (18), UPECs may contain up to 88 virulence genes encoding the following virulence factors: adherence, invasion/immunoevasion (including capsule), iron uptake, and hemolysins or other toxins (including proteases). A majority of the UPEC virulence genes were clustered on pathogenicity islands (PAIs), with a total of 12 pathogenicity islands sequenced and described to date (19–25).
Previous studies have used genotyping methods for detecting virulence genes using PCR (26, 27), colony hybridization (28), and genomic DNA microarray hybridization in order to identify pathogenic E. coli (17, 29–31). All have found ExPECs and often specifically UPECs to be the predominant pathotypes in both natural waters and municipal wastewaters, while IPECs were present either sporadically or most often at low levels.
Disinfection can first influence the dynamics between pathogenic and nonpathogenic strains due to differential reactions with various biomolecules such as amino acids, lipids, and nucleic acids, which result in the arrest of various cellular or molecular functions (32). From this perspective, the two selected disinfectants in the current study may differ in their inactivation mechanisms. PAA is a chemical-oxidizing agent, interacting mostly with sulfhydryl and sulfur bonds in proteins and enzymes (1), whereas UV is a nonionizing radiation agent, damaging DNA mostly by pyrimidine dimerization (32). As the two disinfectants interact differently with cellular components, specific virulence factors may enhance or reduce mortality due to UV or PAA, hence affecting strain selection and survival. This mechanism should lead to a change in the relative proportion of virulence factors, and hence genes.
Beyond affecting strain selection, disinfection can affect gene mobility. Damage to DNA caused by the disinfectant (e.g., thymine dimers for UV and single-strand breaks for PAA) induces both the expression of DNA repair systems (33) and the integrase/recombination genes associated with pathogenicity islands (34, 35). Inducing these two gene classes can lead to the excision of certain unstable pathogenicity islands in various species (34–36). Consequently, the “neutralization” of a pathogenic strain is not necessarily the result of complete inactivation of this strain but can also be due to the deletion of certain virulence genes by pathogenicity island excision, thus rendering the strain nonpathogenic (29). This mechanism has been demonstrated specifically for unstable UPEC pathogenicity islands that were lost upon exposure to quinolones (causing DNA strand breaks by inhibiting gyrase activity) or other environmental stresses (36, 37). Similar effects may influence the prevalence of antimicrobial resistance genes because they are often clustered in integrons containing integrase recombination genes.
The goal of the current study is to go beyond the well-demonstrated effectiveness of UV and PAA disinfection for municipal wastewaters (38–40) and to determine the dynamics of pathogenic (UPEC) and nonpathogenic E. coli strains following disinfection. At the same time, the load of antimicrobial resistance genes in potential UPEC isolates was evaluated. To the best of our knowledge, this is the first study of the impact of UV or PAA disinfection on changes in the subpopulation of UPEC pathotypes and on the occurrence of virulence genes and antimicrobial resistance genes in these E. coli populations in wastewaters.
A low-cost, high-throughput PCR/Bioplex screening procedure was developed to identify potential UPECs. Microarray hybridization was then used to detect the virulence genes to confirm the UPEC pathotyping and to measure the number of antimicrobial resistance genes carried by the isolates.
It is well known that inactivation of E. coli by UV or PAA is affected by wastewater quality, including the presence of suspended solids, which cause shielding of E. coli from disinfectants (41). At this point, it is hypothesized that the impact of the disinfectants on the proportion of UPEC isolates in the planktonic versus particle-associated E. coli populations would be different. Hence, a comparative assessment of filtered and unfiltered samples was also conducted.
MATERIALS AND METHODS
Wastewater effluent sampling and wastewater characterization.
Four municipal wastewater treatment plants located near Montréal, Québec, Canada, were studied: a conventional biological activated sludge (AS) plant, a biological filtration (BF1/BF2) plant, and two physicochemical treatment plants (PC1 and PC2). Effluent grab samples were collected prior to disinfection from the center of the clarifier effluent channel using two 1-liter sterile plastic bottles; samples were immediately placed in a cooler containing ice and transported to the laboratory, where they were stored at 4°C and analyzed within 24 h. For the UV study, AS, BF1, and PC1 plants were sampled between May and August 2012, and PC2 was sampled between July and August 2008. For the PAA study, AS, BF1, BF2, and PC1 were sampled between August and October 2011. After collection, key physicochemical parameters, including pH (method 4500-H+ B), percentage of UV transmittance (253.7 nm; method 5910 B), suspended solids (method 2540 D), and chemical oxygen demand (COD; method 5220 D), were determined following standard methods (42).
Disinfection experiments.
The UV dose-response curves were obtained according to the procedures published previously (39). Briefly, UV disinfection was carried out using nonfiltered effluent samples (AS, BF1, PC1, and PC2), as well as centrifuged/filtered effluent samples (PC2) to determine the effects of particles. In parallel with the nonfiltered portion, a portion of the PC2 sample was centrifuged at 1,233 × g for 5 min and then filtered using a 20-μm-pore-size filter paper to collect only the planktonic part of the E. coli population in the filtrate, which was used for the disinfection experiments. For UV irradiation, 50-ml subsamples were placed in a 75-ml crystallization dish; they were constantly mixed with a magnetic stirrer and exposed to a collimated UV beam from a low-pressure mercury lamp (single-wavelength germicidal; Trojan Technologies Inc., Canada) emitting light at 253.7 nm. Exposure time was varied to establish the inactivation curve. The incident UV intensity was measured at the surface of the sample using a radiometer (International Light, Newburyport, MA), and the transmittance was measured using a spectrophotometer (Thermo Scientific, Canada) at 254 nm, after which these values were used to calculate the average UV intensity throughout the sample using the Morowitz equation (43). The UV dose was calculated by multiplying the average intensity by the irradiation time. Immediately after UV exposure, the crystallization dishes were covered with aluminum foil to avoid photoreactivation, and filtration for E. coli enumeration was performed within 1 min.
PAA disinfection was performed on nonfiltered samples from the AS, BF1, and PC1 plants and on the 20-μm-filtered BF2 sample. The PAA solution (12% [wt/wt]; Solvay Interox Inc., Houston, TX) was added to a 100-ml subsample according to the methods described by Wagner et al. (44). The volume of PAA solution was varied to obtain a dose-response curve for a contact time of 30 min (or 60 min for nonfiltered versus filtered BF2 samples). The BF2 sample was filtered using a 20-μm-pore-size filter paper, and the filtrate of the sample was taken for PAA disinfection and enumeration of E. coli. After each experiment, the PAA residual was measured using the DPD (N,N-diethyl-p-phenylenediamine) colorimetric method. The PAA residual in the samples was quenched using 2 ml of 0.1 N sodium thiosulfate (500 mg/liter) as well as 1 ml of 5 mg/ml catalase solutions (final concentration, 50 mg/liter). For UV and PAA disinfection, a target E. coli level close to 200 CFU/100 ml was taken as the endpoint for strain isolation.
Enumeration and isolation of E. coli.
E. coli levels were enumerated using 0.45-μm membrane filters and incubation at 44.5°C on mFC (modified fecal coliform) agar plates with 5-bromo-6-chloro-3-indolyl glucuronide (BCIG) (CM1111; Oxoid Ltd., England) for 18 to 24 h (method 9221 F) (42). Blue E. coli colonies were picked at random (60 to 150 colonies/plate) and streaked for isolation onto Luria-Bertani (LB) plates to ensure pure isolates. Confirmation of E. coli identification was performed by observing dark-blue/violet colonies on Chromocult agar plates (EMD Chemicals Inc., Germany), which developed a pink color upon testing with Kovac's reagent (EMD Chemicals, Germany) for indole production (45). A total of 1,766 confirmed E. coli isolates were further analyzed by molecular techniques.
Molecular techniques.
DNA extraction was carried out as described by Hamelin et al. (30, 31). Briefly, E. coli isolates were grown in LB broth overnight. One ml of the culture was harvested by centrifugation, washed with distilled deionized (ddH2O) water, resuspended in 175 μl ddH2O, and heated to 95°C for 10 min. Cell debris were removed by centrifugation, and 150 μl of the DNA-containing supernatant was frozen at −80°C to be used as the template DNA for genotyping.
Isolates from the PC2 samples (effect of UV on nonfiltered versus filtered samples) were analyzed directly by microarray. The remaining isolates were initially screened for likely UPEC pathotypes using a quadruplex PCR amplification of three UPEC virulence genes, papC (P fimbriae), cnf1 (cytotoxic necrotizing factor 1), and hlyA (α-hemolysin) (46, 47), and a positive-control gene, uidA (β-glucuronidase). PCR amplifications were performed in a 25-μl reaction mixture containing multiplex master mix (Qiagen, Canada), primers (Table 1), and 1 μl of template DNA. Primers for the four genes were designed with the help of CLC DNA Workbench 3.5.1 software (CLC bio, Canada). The reverse primer of each gene was biotinylated at the 5′ end to facilitate binding of the amplicon to the SA-PE (streptavidin-conjugated R-phycoerythrin) dye for detection in the Bioplex (Bio-Rad, Canada) assay. PCR amplification was carried out in a thermal cycler (Mastercycler ep gradient; Eppendorf AG, Hamburg, Germany): 15 min predenaturation at 95°C, 35 cycles consisting of 30 s at 94°C (denaturation), 60 s at 61°C (annealing), and 2 min at 72°C (extension), with a 10-min final extension at 72°C. The PCR amplified products were detected using a Bioplex hybridization assay. Multiplex detection consisted of hybridizing the biotinylated amplicons to magnetically coated beads (Bio-Rad, Canada) emitting a distinct fluorescent spectrum. Specific DNA probes were covalently coupled to each bead type prior to proportional mixing and subsequent hybridization. Beads were stored in the dark at 4°C at all times, and their concentrations were determined using a TC10 automated cell counter (Bio-Rad, Canada). Validation for successful coupling was performed with biotinylated reverse complement oligonucleotides (IDT, Canada). Hybridization assays were performed in 96-well PCR plates containing 50-μl volumes of reaction mixtures: 33 μl of equal concentrations of each bead specific for a PCR amplicon (target, 2,000 beads per mixture), 7.0 μl of TMAC hybridization solution (4.5 M tetramethylammonium chloride [TMAC], 75 mM Tris-HCl [pH 8.0], 6.0 mM EDTA, and 20% [wt/vol] Sarkosyl), 5 μl of ddH2O, and 5 μl of biotinylated target DNA amplicon. Target DNA samples were denatured at 95°C for 5 min and quickly dispensed to appropriate bead wells followed by 30 min of incubation at 37°C with vigorous shaking. Two posthybridization washes were performed at 37°C: 10 s with 0.1× SSC (1× SSC is 0.15 M NaCl plus 0.015 M sodium citrate) and 0.1% SDS, and 10 s with 0.1× SSC only. Beads were recovered by magnetic separation. Hybridization was finalized by incubating the beads at room temperature for 10 min in TMAC solution with SA-PE (2.0 μg/ml). After hybridization, beads were resuspended in Tris-EDTA (TE; pH 8.0) and immediately analyzed on a Bioplex 200 system (Bio-Rad, Canada). Fluorescence signals were expressed as MFI (mean fluorescence intensity) units and converted to ratios over background for interpretation purposes: a bead intensity above 3 times the background intensity was considered positive. E. coli isolates that showed the presence of one or more virulence genes (i.e., screen-positive isolates) were further genotyped by DNA microarrays.
TABLE 1.
Oligonucleotide sequences designed for this study used in the PCR/Bioplex UPEC screening assay
| Target gene | Primer designation and sequence (5′–3′) | Concn of primer (pmol/μl) | Amplicon size (bp) |
|---|---|---|---|
| hlyA | Forward, ACGAGTTGGTTGATTAGC | 0.6 | 575 |
| Reverse, ATGCCAACAATAACCACTGCAC | 0.6 | ||
| papC | Forward, ATCAGAATACTCAAGCCAG | 0.6 | 423 |
| Reverse, TTGTTGTCTCTGTTTTGTAACGC | 0.6 | ||
| cnf1 | Forward, CACATCTGCACTCTTTGTT | 2.4 | 287 |
| Reverse, CAAATTTCCCTTCACCTG | 2.4 | ||
| uidA | Forward, TGCCGGAATCCATCGCAGCGTAAT | 1.2 | 126 |
| Reverse, ATT GGCCACCACCTGCCAGTC | 1.2 |
The screen-positive isolates for the AS, BF1, BF2, and PC1 samples and all the isolates from the PC2 samples were genotyped by microarray. DNA microarrays used in this study contained 306 probes (70-mers) targeting different versions of 195 virulence and virulence-related genes, 70 antimicrobial resistance genes of 11 classes including genes encoding aminoglycoside, beta-lactam, macrolide, olaquindox, phenicol, quaternary ammonium compounds, quinolone, rifampin, sulfonamides, tetracyclines, trimethoprim, and 8 genes encoding mobile genetic elements (13, 17, 29, 48). The full list of virulence genes with their probes and pathotype classification rules was presented previously (29, 48). The description of antimicrobial resistance genes and mobile genetic element markers is reported by Biswal et al. (13); however, their probes are published elsewhere (48). The microarrays were hybridized with the extracted DNA labeled with Cy5 dye using the BioPrime DNA labeling kit (Invitrogen Life Technologies, Burlington, Ontario, Canada) using a modified protocol previously described (30, 31) and the Pure Link PCR purification kits (Invitrogen Life Technologies) according to the manufacturer's instructions. The amount of incorporated dye was quantified by scanning with a Nanodrop spectrophotometer (Thermo Fisher Scientific, USA) and the Pangloss “% Incorporation Calculator.”
Hybridization was conducted according to a protocol described previously (29). Briefly, following a prehybridization at 50°C for 1 h, the hybridization process was performed overnight at 50°C in a SlideBooster using 1,000 ng of Cy5-labeled denatured DNA (5 min at 95°C) in digoxigenin (DIG) Easy Hyb buffer supplemented with 0.1 μg/μl single-stranded salmon sperm DNA (Sigma-Aldrich, Ontario, Canada). After hybridization, slides were washed four times at 37°C, i.e., three times with 0.1× SSC and 0.1% SDS for 5 min. and once with 0.1× SSC for 5 min. Air-dried microarray slides were scanned with a ScanArray Lite fluorescent microarray analysis system (Perkin-Elmer, Mississauga, Ontario, Canada) equipped with the ScanArray Express software (Perkin-Elmer), and fluorescent spot intensities were quantified using ImaGene v8.0 (BioDiscovery, Inc., El Segundo, CA). Sample-to-background intensity ratios greater than 3 were considered positive.
Evaluation of the performance of the PCR/Bioplex UPEC screening method.
As the screening and microarray data are interpreted to give the proportion of UPECs in the sample, it was important to evaluate the screening procedure statistically, assuming that the microarray was the “gold standard.” We used a literature review (46, 47) and the microarray data of 719 E. coli isolates that were analyzed for pathotyping (29) to select the three most common virulence genes (papC, cnf1, and hlyA) that were used to determine a potential UPEC (screening criterion, carrying at least one virulence gene). The same data were used to determine the rates of nominal false-negative UPECs (i.e., screen-negative UPECs) and false-positive UPECs (i.e., screen-positive non-UPECs). Beyond the nominal false-negative and false-positive rates, the PCR/Bioplex procedure can also contribute errors by not detecting genes that would be detected by microarray (underdetection rate) or by detecting genes that would not be detected by microarray (overdetection rate). To evaluate the underdetection rate, 79 UPEC E. coli isolates previously analyzed by microarray (29) and carrying at least 1 of the screening virulence genes were randomly selected. Underdetection was analyzed for each gene, and the overall underdetection rate was evaluated using the population structure observed before by considering independently the Bioplex/PCR detection of each virulence gene. The overall false-positive rate (probability of screen-positive given a UPEC-negative isolate: P[B+|UPEC−]overall) was evaluated using the new screen-positive isolates obtained in the current study that were subsequently analyzed by microarray. From the conditional probability definitions, the following equations were used for the evaluation by fitting the most likely true proportion of UPECs in the samples (P[UPEC+]):
| (1) |
| (2) |
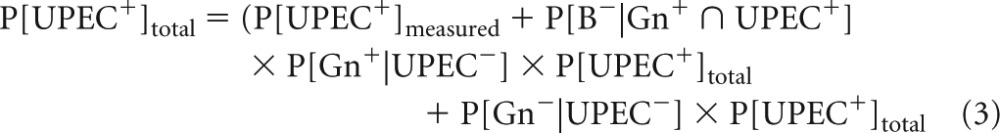 |
where Gn+ represents the population carrying at least one of the screening virulence genes, B+ represents the population with a positive signal with PCR/Bioplex for one of the screening virulence genes, and UPEC+ represents the population classified into the UPEC pathotype.
Phylotyping, pathotyping, pathogenicity islands, and antimicrobial resistance determination.
Phylotyping and pathotyping of E. coli isolates and determination of pathogenicity islands were done exclusively using the microarray results. Assignment into four phylogroups (A, B1, B2, and D) was done using the Clermont three-markers approach (49). Pathotype assignation was based on the number and combination of virulence genes/virulence factors that they carried as described before (29). Specifically, to be a UPEC pathotype, the minimum number of required virulence genes was 5 (2 adherence, 1 capsule, 1 iron acquisition, and 1 hemolysin or other toxin genes). Isolates that did not correspond to any virulence gene combination for defined pathotypes were deemed nonpathogenic E. coli. In this study, the isolates that carried one or more uropathogenic virulence genes in the PCR/Bioplex screening assay are called potential UPECs. UPEC pathogenicity islands were presumed to be present if the combination of virulence genes reported for each pathogenicity island in our previous study (13) was detected in an isolate. The number of antimicrobial resistance genes present in E. coli isolates was also determined by the microarray hybridization assay.
Statistical analysis.
Statistical analyses of the variation of the frequencies of UPEC isolates or of specific virulence genes due to disinfection were performed using the log-linear model (50) calculated with the CATMOD procedure of the SAS/STAT statistical software v.9.2 (SAS Institute, Inc., Cary, NC). For the statistical tests, each plant was considered an independent sample, all tests were considered two-tailed, and the statistical significance was set at a P value of <0.05. Associations between virulence genes were quantified by the phi coefficient (51), and their significance was tested using the log-odds (base e) ratio test (50). Whenever the significance of differences is mentioned below, it will be with reference to a P level of 0.05.
RESULTS
Disinfection experiments.
Average operational conditions and effluent qualities at the wastewater treatment plants at the time of sampling are summarized in Table 2. Dose-response curves for UV (Fig. 1a) and PAA (Fig. 1b) disinfection were determined by varying the irradiation times and the initial concentrations, respectively. The target E. coli level after disinfection was set to ∼200 CFU/100 ml (2.3 log CFU/100 ml), corresponding to CFU reductions of 1.6 to 3.7 log. Before tailing, the inactivation rates were similar in all samples, but tailing started to occur at approximately 103 CFU/100 ml (∼3 log) with UV for the BF1, PC1, and nonfiltered PC2 samples (Fig. 1a) and at approximately 5 × 10² CFU/100 ml (∼2.7 log) with PAA for all samples (Fig. 1b). The UV dose needed to reach the target E. coli counts for the AS sample was 7 mJ/cm2, but it was much higher (15 to 30 mJ/cm2) for the nonfiltered BF1, PC1, and PC2 samples, mainly because of the tailing effect. The higher UV doses required for the physicochemical effluents (Fig. 1a) correspond to higher concentrations of suspended solids (Table 2). Analogously, filtration of the PC2 sample removed the tailing effect (Fig. 1a), but the high initial E. coli counts still required a UV dose of 15 mJ/cm2 to reach the target disinfection level.
TABLE 2.
Treatment processes and effluent qualities of the four municipal treatment plantsa
| Description/parameter (unit) | Value for wastewater treatment plant (process): |
||||
|---|---|---|---|---|---|
| AS (conventional activated sludge) | BF1 (biological filtration) | BF2 (biological filtration) | PC1 (physicochemical process using alum and organic polymer as coagulants) | PC2 (physicochemical process using ferric chloride or alum and organic polymer as coagulants) | |
| Population (no. of persons) served (103) | 64. 4 | 40.0 | 59.0 | 1,862 | |
| Mean flow (103 m3/day) | 65.3 | 38.3 | 44.0 | 7,600 | |
| HRT (h) | 20 | 2.1 | 3.0 | 3 (est.) | |
| SRT (day) | 7 | NA | NA | NA | |
| pH | 7.1 | 7.7 | 7.2 | 7.1 | |
| UV transmittance (%) | 67.2 | 63.6 | 54.5 | 42.6 | |
| SS (mg/liter) | 10 | 5.0 | 14 | 15 | 18 |
| COD (mg/liter) | 37.6 | 46 | 62 | 45.1 | 92.2 |
| E. coli (CFU/100 ml) | 7.8 × 10³ | 1.1 × 10⁵ | 3.0 × 10⁵ | 1.6 × 10⁵ | 9.9 × 10⁵ |
HRT, hydraulic retention time; SRT, solids retention time; SS, suspended solids; NA, not applicable; est., estimated.
FIG 1.
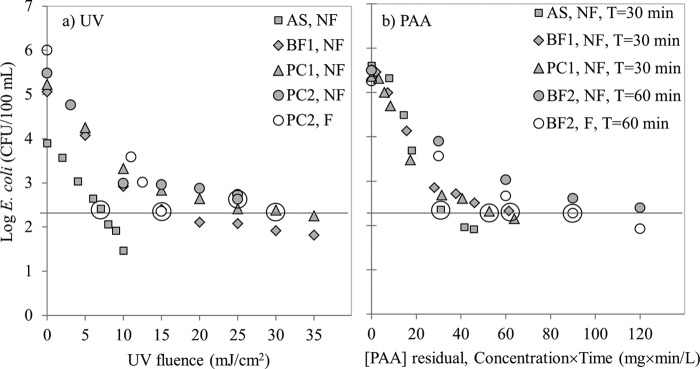
Effects of UV(a) and PAA (b). E. coli inactivation curves for nonfiltered (NF) samples from activated sludge (AS), biofiltration (BF1), and physicochemical (PC1) treatment plants. PAA contact time (T) was 30 min except for BF2 samples. The effect of particles on the inactivation kinetics was tested for UV on the PC2 plant samples (a) and for PAA on the BF2 plant samples (b); in both cases, nonfiltered (NF) can be compared to filtered (F) samples. The PAA contact time for BF2 was increased to 60 min for these experiments because of high consumption of PAA. Data points circled are those conditions for which E. coli isolation was done.
The PAA doses to achieve the E. coli target level with a 30-min contact time increased in order from AS to PC1 and BF1 samples (Fig. 1b). These doses were similar to the range of doses obtained by other researchers for indicator bacteria in municipal secondary wastewater effluents (52). Filtration did not remove the tailing effect observed with the BF2 samples for contact times of 60 min (Fig. 1b). The chemical oxygen demand (COD) level in the filtered BF2 sample (62 mg/liter) was higher than in the nonfiltered BF1 sample (46 mg/liter) (Table 2) because although both samples were taken from the same treatment plant, they were taken on different days. In the filtered BF2 sample, although particles were removed, a fraction of the added PAA was nevertheless used to oxidize the organics (expressed as COD) in the sample, causing an increase in the PAA demand as well as the resultant tailing.
Evaluation of the efficiency of the PCR/Bioplex UPEC-screening tool.
The principal goal of the screening technique was to develop a low-cost, high-throughput method to detect potential UPECs (isolates that carry one or more uropathogenic virulence genes in the PCR/Bioplex screening assay are called potential UPECs), the predominant pathotypes (8 to 28%) in municipal wastewater samples (29). From previous work, the nominal false-negative and false-positive rates were estimated to be 17% and 3.9%, respectively (29) (Table 3). However, beyond these nominal performance statistics, the PCR/Bioplex procedure may also contribute a certain detection bias. Underdetection of virulence gene by screening was evaluated by randomly reanalyzing 79 UPEC isolates by PCR/Bioplex. The underdetection rates of the virulence genes were found to be 8%, 16%, and 20% for papC, hlyA, and cnf1 genes, respectively. Recombining these individual rates and considering the proportion of isolates with single and multiple genes gave a PCR/Bioplex UPEC underdetection rate of 3.2% and an overall false-negative UPEC screening rate of 19.7% (Table 3).
TABLE 3.
Performance of PCR/Bioplex technique to screen likely UPEC isolates
| Description | Primary analysis | No. of isolates | Isolation study | Measured rate (%) |
|---|---|---|---|---|
| False-negative analysis | ||||
| Nominal false negative | Microarray | 135 | Frigon et al. (29) | 17.0 |
| Bioplex underdetection | Microarray (UPEC) | 79 | Frigon et al. (29) | 3.2 |
| Overall false negative | Calculation: 17.0% + (100% − 17.0%) × 3.2% | 19.7 | ||
| False-positive analysis | ||||
| Nominal false positive | Microarray | 584 | Frigon et al. (29) | 3.9 |
| Bioplex overdetection | Calculation: (15.2% − 3.9%)/(100% − 3.9%) | 11.7 | ||
| Overall false positive | PCR/Bioplex positive | 323 | This study | 15.2a |
| PCR/Bioplex negative | 1,274 |
Calculated using equations 1, 2, and 3 by fitting the most likely proportion of UPECs in each sample.
To evaluate the overdetection rate, new isolates from the current study were used. PCR/Bioplex screening found 16% of 1,597 isolates to be positive with 7% confirmed as UPECs by DNA microarray (i.e., screen-positive UPECs). Although the proportion of non-UPECs among the screen-positive isolates seems high (∼65%), this is due to the relatively low overall proportion of UPECs (below 20%). Considering the overall false-negative rate determined above (19.7%), the true proportion of UPECs was between 2 and 22% (considering the 95% binomial confidence interval). Consequently, the probabilistic model estimates of overall false-positive rates ranged between 9 and 25% with an average of only 15.2%.
Prevalence of UPECs in nondisinfected and disinfected effluents.
A total of 1,597 E. coli isolates were collected and screened by PCR/Bioplex to evaluate the primary impact of disinfection on the prevalence of UPECs. The screening procedure found 323 positive isolates, with 114 of them confirmed as UPECs. In the nondisinfected samples, the proportion of UPECs ranged between 6 and 18% (Fig. 2). Disinfection by UV of nonfiltered samples caused a significant average reduction of the UPEC pathotypes of 55% (range of reductions between samples, 22 to 80%; Fig. 2a). Similarly, PAA disinfection of nonfiltered samples significantly reduced the UPEC proportions by an average of 52% (range of reductions between samples, 12 to 100%; Fig. 2b). The large variations among the samples may be due to differences in wastewater qualities on different days or differences in the original populations of UPECs in the nondisinfected effluent samples. It is well known that the inactivation rate of E. coli by PAA disinfection depends on wastewater characteristics, which further adds to the variability.
FIG 2.
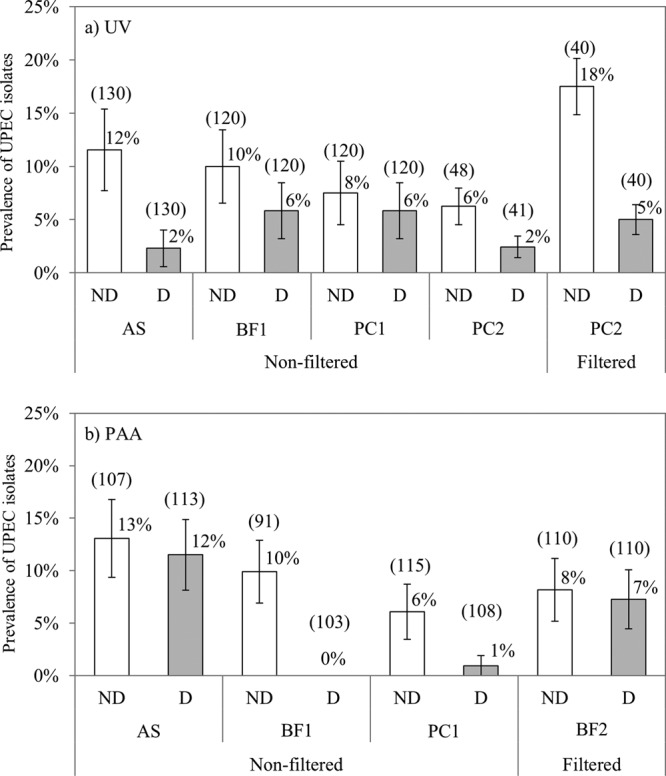
Prevalence of uropathogenic E. coli (UPEC) in nondisinfected (ND; open bars) and disinfected (D; gray bars) effluent samples of activated sludge (AS), biofiltration (BF1 and BF2), and physicochemical (PC1 and PC2) plants by UV (a) and PAA (b). Error bars are the standard errors as calculated using the log-linear model. The number in parentheses above each bar represents the total number of isolates screened by PCR/Bioplex.
Impact of particles.
An additional 169 isolates were directly analyzed (i.e., not previously screened) using our DNA pathotyping microarray to evaluate the influence of particles on the reduction of UPEC prevalence by UV, as it is known that bacteria can be shielded from UV radiation by particles (41). E. coli strains from nonfiltered and filtered samples (20-μm-filtered samples) were compared for the PC2 plant samples. The reduction in UPEC pathotypes was 61% for the nonfiltered sample and 71% for the filtered sample, a difference that was not statistically significant. Because the isolates were not screened for this experiment, it is possible to compare directly the number of UPEC genes within the non-UPEC portion of the E. coli population for the two cases. The average number of UPEC genes within the non-UPEC isolates increased from 1.7 to 2.3 (of 26 possible genes) upon UV irradiation for the nonfiltered sample, while it decreased from 2.3 to 2.0 for the filtered sample, trends that were significantly different. Noting that a UPEC strain can be transformed into a non-UPEC by losing only one gene, the combined higher reduction of UPEC isolates and of UPEC genes frequency in non-UPEC isolates for the strictly planktonic population (from filtered samples) suggests that the impact of UV on gene loss is more pronounced for this population than for the mixed planktonic and particulate-associated population (from nonfiltered samples). Since filtration also removed the tailing effect observed with UV (Fig. 1), these observations are likely related to the shielding from UV radiation by particles as reported previously in the literature (41).
Phylogenetic classification of E. coli.
The phylogenetic affiliation is seen in the literature as indicative of underlying unknown ecogenomic factors. Thus, determining the classification among the four main phylogroups (A, B1, B2, and D) remains important to develop the overall picture of the effects of disinfectants. In agreement with other studies (29–31), the UPECs in our study belonged predominantly to the B2 and to a lesser extent to the D phylogroups, irrespectively of whether they were screened or not (Fig. 3). The number of UPECs belonging to the B2 phylogroup was significantly higher than those in the other groups. The nonpathogens were significantly more prevalent in the A (55%) and B1 (37%) groups than in the other two. When comparing the change of phylogenetic distribution by UV/PAA, it was found that UV and PAA reduced the population of B2 phylotype isolates by 45% and 15%, respectively; this decrease was statistically significant for UV disinfection. Furthermore, the change in the proportion of isolates of other phylotypes (A, B1, and D) was not statistically significant following UV treatment. However, with PAA treatment, the proportion of phylotype A isolates significantly increased, but that of phylotype B1 isolates significantly decreased; changes in the proportion of phylotype D isolates were not statistically significant.
FIG 3.
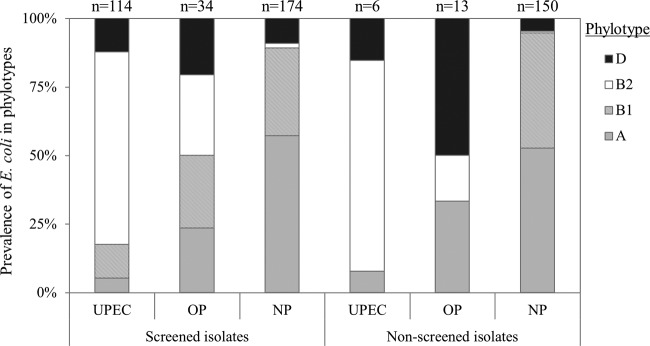
Pathotype (UPEC, uropathogens; OP, other pathotypes; NP, nonpathogenic) and phylotype (A, gray bars; B1, hatched bars; B2, open bars; D, black bars) distribution of the 323 screen-positive E. coli isolates and 169 nonscreened (i.e., directly pathotyped by microarrays) E. coli isolates. n, number of isolates in each category.
Determination of the frequency of UPEC pathogenicity islands.
To complete the description of UPEC-related genomic elements present in the E. coli isolates that were studied, the probable frequency of pathogenicity islands in both UPECs (114 isolates) and non-UPECs (209 isolates) was indirectly quantified from the microarray data. Similar to what was done in previous works (13, 53, 54), if an isolate contained the required combination of virulence genes, we presumed that the pathogenicity island was present in the isolate. Typically, the microarray did not include all the genes associated with a pathogenicity island. However, only pathogenicity islands that had more than 3 virulence genes included in the microarray were considered for this analysis to reduce the chance of false positives (13).
A total of 7 pathogenicity islands (PAIs) were presumed present in the UPEC isolates at a frequency varying from 7% to 60% (Fig. 4). PAI IV536, also called the “high pathogenicity island (HPI)” (24), was the predominant island. It was found in 60% of UPECs, and it was also found in 22% of the non-UPECs that were tested on microarrays (Fig. 4). Co-occurrence analysis revealed that the highest association (phi coefficient [φ] > 0.50) was found between the virulence genes present on PAI IV536 and two P-fimbria virulence genes (papC and papG) that are present on several UPEC pathogenicity islands (see Table S1 in the supplemental material). Finally, UPEC isolates carried 1 to 6 different pathogenicity islands (average frequency, 1.95), while the non-UPEC isolates carried 0 or 1 pathogenicity island (average frequency, 0.24). Previous studies of environmental and clinical isolates have found similar frequencies of pathogenicity islands within UPEC isolates, and they have established the predominance of PAI IV536 among UPECs as well as non-UPECs (54, 55). It has been suggested that PAI IV536 is more stable than the other UPEC pathogenicity islands, which may explain this predominance (37).
FIG 4.
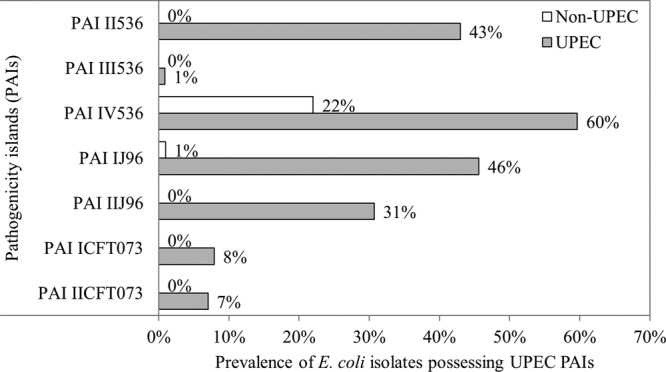
Prevalence of uropathogenic E. coli (UPEC) pathogenicity islands (PAIs) in a total of 323 screen-positive E. coli isolates (non-UPEC, 209 isolates, open bars; UPEC, 114 isolates, gray bars).
Change in the frequency of UPEC virulence genes by UV or PAA.
To test the possibility that UV and PAA affect the frequencies of specific virulence genes (or virulence factors) differently, a total of 26 UPEC virulence genes (19 used for pathotyping and 7 commonly associated with UPECs) were examined (see Table S2 in the supplemental material). The average UPEC virulence gene frequency in non-UPEC isolates decreased from 5.1 to 3.6 by UV irradiation and from 3.8 to 3.3 by PAA, a statistically significant reduction for UV. Given the reduction in the proportion of UPECs and the reduction in UPEC virulence genes within non-UPEC isolates, the average overall reduction in the UPEC virulence gene frequency within the screen-positive isolates was significantly lowered, by 25.8% and 8.3% for UV and PAA treatments, respectively; these reduction levels were also significantly different from each other (i.e., UV compared to PAA). The change in the frequencies of each virulence genes group within virulence factors was analyzed to determine if their variations upon disinfection were different from the average. Only fyuA, irp1, and irp2 genes (for PAA only), behaved statistically differently from the other virulence genes as they increased in proportion (see Table S2 in the supplemental material). These genes all code for parts of an iron acquisition system but are also carried on the more abundant and more stable PAI IV536 (37) (Fig. 5). Thus, when the effect of function grouping on the change in virulence gene frequency was tested, the iron acquisition function was split in two: PAI IV536-associated genes and the other iron acquisition virulence genes. Only the PAI IV536-associated, iron acquisition function behaved significantly differently from the others by increasing instead of decreasing (Fig. 5). This suggests that the function is not the selection factor but rather the association with the pathogenicity island.
FIG 5.
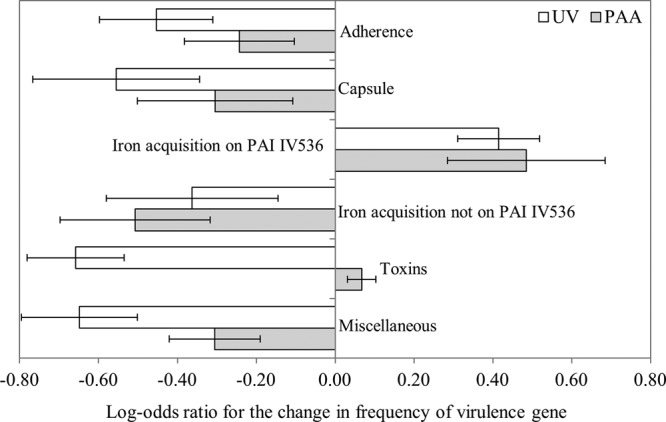
Changes of the prevalence of uropathogenic E. coli (UPEC) virulence genes in each virulence factor by UV (open bars) and PAA (gray bars). A positive log-odds ratio means an increase in the relative frequency of a group of virulence genes upon disinfection. Error bars are the standard errors calculated using the log-linear model.
Prevalence of antimicrobial resistance genes and their co-occurrence with virulence genes.
The prevalence of antimicrobial resistance genes was determined using the microarray data. Of the 1,766 E. coli isolates collected, 492 isolates were potentially uropathogenic E. coli (UPEC) according to the PCR/Bioplex screening and were analyzed by DNA microarrays. Of these, 127 isolates were confirmed as UPEC and 365 isolates were nonuropathogenic E. coli (non-UPEC). Finally, of the 492 potential UPECs, 39.4% (consisting of 13.6% UPEC and 25.8% non-UPEC) isolates carried at least one antimicrobial resistance gene (ARG).
Instead of enumerating each ARG, we report here the number of ARG classes that were detected. The prevalence of ARG classes did not significantly change upon UV disinfection. However, they generally decreased when the samples were disinfected with PAA (Table 4). In fact, the mean number of antimicrobial resistance classes carried by resistant strains decreased by an average of 47% upon exposure to PAA.
TABLE 4.
Distribution of antimicrobial resistance genes (ARGs) in various antimicrobial classes
| ARG class | No. of E. coli isolates carrying at least one ARG in each antimicrobial class |
|||||
|---|---|---|---|---|---|---|
| With UV treatmenta |
With PAA treatmentb |
|||||
| NDc | Dd | % changee | ND | D | % changee | |
| Total | 171 | 147 | NAg | 99 | 75 | NA |
| Mean ARG class | 2.8 | 2.8 | −2.3 | 4.4 | 2.3 | −46.9 |
| Aminoglycoside | 20 | 25 | 45.4 | 29 | 19 | −13.5 |
| Macrolides | 9 | 15 | 93.9 | 28 | 8 | −62.3 |
| Beta-lactams | 37 | 30 | −5.7 | 36 | 16 | −41.3 |
| Quinolone | 10 | 9 | 4.7 | 3 | 1 | −56 |
| Phenicols | 15 | 14 | 8.6 | 22 | 6 | −64 |
| Olaquindox | 3 | 1 | −61.2 | 7 | 1 | −81.1 |
| QACf | 5 | 4 | −6.9 | 4 | 2 | −34 |
| Sulfonamides | 5 | 4 | −6.9 | 6 | 1 | −78 |
| Tetracyclines | 23 | 26 | 31.5 | 27 | 21 | 2.7 |
| Trimethoprim | 13 | 15 | 34.2 | 29 | 11 | −49.9 |
UV treatment isolates were from activated sludge (AS), biofiltration (BF1), and physicochemical (PC1 and PC2) plants.
PAA treatment isolates were from activated sludge (AS), biofiltration (BF1 and BF2), and physicochemical (PC1) plants.
ND, nondisinfected effluent samples.
D, UV/PAA-disinfected effluent samples.
% change: −, decrease; +, increase. Significant differences are bolded (P < 0.05).
QAC, quaternary ammonium compound.
NA, not applicable.
A significant positive co-occurrence of ARGs and UPEC genotypes was observed, as the average ARG classes (Fig. 6a) and the prevalence of ARG-carrying isolates (Fig. 6b) were higher among confirmed UPEC isolates than among non-UPECs. The co-occurrence of ARGs within UPEC pathotypes generally increased after UV disinfection, but it decreased after PAA disinfection (Fig. 6).
FIG 6.

Co-occurrence of virulence and antimicrobial resistance genotypes. (a) Average antimicrobial resistance gene classes in nonuropathogenic E. coli (non-UPECs) and uropathogenic E. coli (UPECs). (b) Prevalence of antimicrobial resistance gene-carrying E. coli in non-UPECs and UPECs. Significant occurrences are indicated by an asterisk.
DISCUSSION
The frequency of UPEC isolates varied between 6 and 18% in the nondisinfected effluents of the treatment plants sampled (Fig. 2). Although in the current study the isolates had been prescreened for the likelihood of being UPECs by a PCR/Bioplex assay prior to microarray analysis, this range is similar to the one observed in our previous study of wastewater treatment plant effluents (8 to 28%), in which all isolates were directly analyzed by microarray (29). It was shown that both activated sludge and physicochemical treatment processes reduced the proportion of UPECs, and there was no evidence that the kind of treatment process affected the reduction differently. The work presented here complements this work and suggests that UV and PAA disinfection further reduces the proportion of UPECs in wastewater treatment plant effluents by approximately 50%.
To generate hypotheses on the likely mechanisms leading to this reduction, it is important to identify the kinds of damage to the cells and their response. For the disinfection work presented here, the time of contact with the disinfectant was less than 2.5 min for UV and 30 to 60 min for PAA. As the relaxation time of gene induction is in the order of a few hours (56), the experiments are not likely to yield cells that have adapted their gene expression to the presence of disinfectants during disinfection. Nonetheless, the cells that survived the disinfectant may have been injured by the disinfectant, and the defense mechanisms triggered may take effect during the growth period on the selective media.
UV and PAA were studied in parallel, which provided an opportunity to test whether cellular functions are the basis for the reduction of UPECs in the E. coli population. As noted earlier, UV is a nonionizing radiation agent acting mainly on pyrimidine bases and subsequently inhibiting DNA synthesis or causing a high mutation rate (32), whereas PAA is a chemical disinfectant that inactivates microorganisms by oxidizing sulfhydryl and sulfur bonds in proteins and enzymes on the cell surface (1). Given that the inactivation modes of UV and PAA are different, they should generate different gene loss profiles if cellular functions formed the basis for UPEC reduction. The analysis above, however, showed that this was not the case for UPEC virulence genes (Fig. 5).
The gene expression response to disinfectants can be used as an indication of the kind of damage suffered by the organism. In previous studies, UV was shown to induce the expression of SOS response genes in E. coli, which is consistent with DNA damage (33, 57). Furthermore, exposure to PAA reduced the expression of membrane proteins but increased the expression of chaperone proteins, of oxidative stress response genes, and of sulfur-containing amino acid metabolism genes in different species (58–61). All these effects are consistent with the oxidative reaction with proteins as the chemical diffuses into the cell.
UV and PAA may, however, also have some commonality in their mode of cellular attack, as revealed by gene expression studies. Demple and Halbrook (62) reported that hydrogen peroxide induced DNA damage repair systems in E. coli. In another study with Bacillus cereus, PAA and hydrogen peroxide have been found to induce DNA damage repair systems and SOS response genes, but quaternary ammonium compounds (QAC) or hypochlorous acid did not provoke the same effects (61). Similarly to hydrogen peroxide or PAA, UV irradiation also induces the DNA repair mechanisms in the E. coli cell (63). The results of these studies suggest that both UV and PAA disinfection may have damaged the E. coli DNA in our study.
A possible mechanism that could lead to the observed loss of virulence genes could be the deletion of UPEC pathogenicity islands following UV or PAA treatment. It has been shown that a number of UPEC pathogenicity islands are unstable and can be lost at a relatively high rate under different environmental conditions (64–66). One of these conditions is the presence of antimicrobial agents of the quinolone class (36), which are inhibitors of DNA gyrase and which induce the SOS DNA repair response due to DNA lesions (36). This effect seems to be similar to that previously reported for UV (33) and PAA (61). Direct evidence of the effect of the disinfectant on the deletion rate of pathogenicity islands has been published for hydrogen peroxide exposure of Salmonella enterica pathogenicity islands (ROD 21) (35) and for the UV irradiation of Vibrio cholerae pathogenicity island 2 (VPI-2) (34). Therefore, it is hypothesized that DNA lesions induced by UV and PAA may promote the loss of UPEC pathogenicity islands, which leads to a reduction in the prevalence of UPECs in the E. coli population.
Our analysis showed that a significant positive co-occurrence was found between the virulence and antimicrobial resistance genotypes, i.e., UPEC isolates carried more antimicrobial resistance gene classes than did non-UPEC isolates (Fig. 6). Researchers have studied mostly the associations between β-lactam or quinolone resistance and the prevalence of virulence factors in clinical strains (14, 67). The presence of extended-spectrum β-lactamases (CTX-M) enhanced the prevalence of virulence factors (14), while the occurrence of quinolone resistance genes (qnrS1 and qnrS2) reduced the number of virulence factors in ExPEC pathotypes (67). Similarly to those results, our data show that the frequency of UPECs increased by 46.4% in E. coli isolates carrying the beta-lactamase resistance gene (blaCTX-M12), while in the quinolone resistance gene-carrying E. coli, the proportion of UPECs decreased by 33%. Thus, yet-to-be-described interactions between virulence factors and antimicrobial resistance may occur.
In summary, the proportion of UPECs in the nondisinfected effluent was reduced by an average of 50% following UV or PAA disinfection, and this reduction could not be associated with a specific virulence function. The UPEC pathotypes and genes among the planktonic E. coli subpopulation were more sensitive than the particle-associated ones to the effects of disinfection by UV. It is plausible that the deletion of pathogenicity islands may be responsible for this decrease in the proportion of UPECs. UV disinfection appears to have had no effect on the prevalence of antimicrobial resistance genes in the UPEC pathotypes, while they were significantly reduced by PAA disinfection. A positive association was found between urovirulence and antimicrobial resistance genes.
Supplementary Material
ACKNOWLEDGMENTS
We thank the operators of the four municipal wastewater treatment plants for assisting with effluent sample collection.
This work was funded by the Natural Sciences and Engineering Research Council of Canada (NSERC) (grant no. STPGP 35117-07) in collaboration with Trojan Technologies Inc.
Footnotes
Published ahead of print 11 April 2014
Supplemental material for this article may be found at http://dx.doi.org/10.1128/AEM.00418-14.
REFERENCES
- 1.Kitis M. 2004. Disinfection of wastewater with peracetic acid: a review. Environ. Int. 30:47–55. 10.1016/S0160-4120(03)00147-8 [DOI] [PubMed] [Google Scholar]
- 2.Oliver BG, Cosgrove EG. 1975. The disinfection of sewage treatment plant effluents using ultraviolet light. Can. J. Chem. Eng. 53:170–174. 10.1002/cjce.5450530203 [DOI] [Google Scholar]
- 3.Health Canada. 2012. Guidelines for Canadian recreational water quality, 3rd ed. Catalogue no. H129–15/2012E. Water, Air and Climate Change Bureau, Healthy Environments and Consumer Safety Branch, Health Canada, Ottawa, Ontario, Canada [Google Scholar]
- 4.Hlavsa MC, Roberts VA, Anderson AR, Hill VR, Kahler AM, Orr M, Garrison LE, Hicks LA, Newton A, Hilborn ED, Wade TJ, Beach MJ, Yoder JS. 2011. Surveillance for waterborne disease outbreaks and other health events associated with recreational water—United States, 2007-2008. MMWR. Surveill. Summ. 60:1–32 http://www.cdc.gov/mmwr/preview/mmwrhtml/ss6012a1.htm [PubMed] [Google Scholar]
- 5.Armstrong GL, Hollingsworth J, Morris JG., Jr 1996. Emerging foodborne pathogens: Escherichia coli O157:H7 as a model of entry of a new pathogen into the food supply of the developed world. Epidemiol. Rev. 18:29–51. 10.1093/oxfordjournals.epirev.a017914 [DOI] [PubMed] [Google Scholar]
- 6.Hilborn ED, Wade TJ, Hicks L, Garrison L, Carpenter J, Adam E, Mull B, Yoder J, Roberts V, Gargano JW. 2013. Surveillance for waterborne disease outbreaks associated with drinking water and other nonrecreational water—United States, 2009-2010. MMWR Morb. Mortal. Wkly. Rep. 62:714–720 http://www.cdc.gov/mmwr/pdf/wk/mm6235.pdf [PMC free article] [PubMed] [Google Scholar]
- 7.Kaper JB, Nataro JP, Mobley HLT. 2004. Pathogenic Escherichia coli. Nat. Rev. Microbiol. 2:123–140. 10.1038/nrmicro818 [DOI] [PubMed] [Google Scholar]
- 8.Prats G, Navarro F, Mirelis B, Dalmau D, Margall N, Coll P, Stell A, Johnson JR. 2000. Escherichia coli serotype O15:K52:H1 as a uropathogenic clone. J. Clin. Microbiol. 38:201–209 [DOI] [PMC free article] [PubMed] [Google Scholar]
- 9.Manges AR, Johnson JR, Foxman B, O'Bryan TT, Fullerton KE, Riley LW. 2001. Widespread distribution of urinary tract infections caused by a multidrug-resistant Escherichia coli clonal group. N. Engl. J. Med. 345:1007–1013. 10.1056/NEJMoa011265 [DOI] [PubMed] [Google Scholar]
- 10.Diard M, Garry L, Selva M, Mosser T, Denamur E, Matic I. 2010. Pathogenicity-associated islands in extraintestinal pathogenic Escherichia coli are fitness elements involved in intestinal colonization. J. Bacteriol. 192:4885–4893. 10.1128/JB.00804-10 [DOI] [PMC free article] [PubMed] [Google Scholar]
- 11.Le Gall T, Clermont O, Gouriou S, Picard B, Nassif X, Denamur E, Tenaillon O. 2007. Extraintestinal virulence is a coincidental by-product of commensalism in B2 phylogenetic group Escherichia coli strains. Mol. Biol. Evol. 24:2373–2384. 10.1093/molbev/msm172 [DOI] [PubMed] [Google Scholar]
- 12.Moreno E, Johnson JR, Pérez T, Prats G, Kuskowski MA, Andreu A. 2009. Structure and urovirulence characteristics of the fecal Escherichia coli population among healthy women. Microbes Infect. 11:274–280. 10.1016/j.micinf.2008.12.002 [DOI] [PubMed] [Google Scholar]
- 13.Biswal BK, Mazza A, Masson L, Gehr R, Frigon D. 2014. Impact of wastewater treatment processes on antimicrobial resistance genes and their co-occurrence with virulence genes in Escherichia coli. Water Res. 50:245–253. 10.1016/j.watres.2013.11.047 [DOI] [PubMed] [Google Scholar]
- 14.Lee S, Yu JK, Park K, Oh EJ, Kim SY, Park YJ. 2010. Phylogenetic groups and virulence factors in pathogenic and commensal strains of Escherichia coli and their association with blaCTX-M. Ann. Clin. Lab. Sci. 40:361–367 http://www.annclinlabsci.org/cgi/reprint/40/4/361 [PubMed] [Google Scholar]
- 15.Boczek LA, Rice EW, Johnston B, Johnson JR. 2007. Occurrence of antibiotic-resistant uropathogenic Escherichia coli clonal group A in wastewater effluents. Appl. Environ. Microbiol. 73:4180–4184. 10.1128/AEM.02225-06 [DOI] [PMC free article] [PubMed] [Google Scholar]
- 16.Colomer-Lluch M, Mora A, López C, Mamani R, Dahbi G, Marzoa J, Herrera A, Viso S, Blanco JE, Blanco M, Alonso MP, Jofre J, Muniesa M, Blanco J. 2013. Detection of quinolone-resistant Escherichia coli isolates belonging to clonal groups O25B:H4-B2-ST131 and O25B:H4-D-ST69 in raw sewage and river water in Barcelona, Spain. J. Antimicrob. Chemother. 68:758–765. 10.1093/jac/dks477 [DOI] [PubMed] [Google Scholar]
- 17.Bruant G, Maynard C, Bekal S, Gaucher I, Masson L, Brousseau R, Harel J. 2006. Development and validation of an oligonucleotide microarray for detection of multiple virulence and antimicrobial resistance genes in Escherichia coli. Appl. Environ. Microbiol. 72:3780–3784. 10.1128/AEM.72.5.3780-3784.2006 [DOI] [PMC free article] [PubMed] [Google Scholar]
- 18.Chen L, Xiong Z, Sun L, Yang J, Jin Q. 2012. VFDB 2012 update: toward the genetic diversity and molecular evolution of bacterial virulence factors. Nucleic Acids Res. 40:D641–D645. 10.1093/nar/gkr989 [DOI] [PMC free article] [PubMed] [Google Scholar]
- 19.Tourret J, Diard M, Garry L, Matic I, Denamur E. 2010. Effects of single and multiple pathogenicity island deletions on uropathogenic Escherichia coli strain 536 intrinsic extra-intestinal virulence. Int. J. Med. Microbiol. 300:435–439. 10.1016/j.ijmm.2010.04.013 [DOI] [PubMed] [Google Scholar]
- 20.Schmidt H, Hensel M. 2004. Pathogenicity islands in bacterial pathogenesis. Clin. Microbiol. Rev. 17:14–56. 10.1128/CMR.17.1.14-56.2004 [DOI] [PMC free article] [PubMed] [Google Scholar]
- 21.Oelschlaeger TA, Dobrindt U, Hacker J. 2002. Pathogenicity islands of uropathogenic E. coli and the evolution of virulence. Int. J. Antimicrob. Agents 19:517–521. 10.1016/S0924-8579(02)00092-4 [DOI] [PubMed] [Google Scholar]
- 22.Dobrindt U, Blum-Oehler G, Nagy G, Schneider G, Johann A, Gottschalk G, Hacker J. 2002. Genetic structure and distribution of four pathogenicity islands (PAI I 536 to PAI IV 536) of uropathogenic Escherichia coli strain 536. Infect. Immun. 70:6365–6372. 10.1128/IAI.70.11.6365-6372.2002 [DOI] [PMC free article] [PubMed] [Google Scholar]
- 23.Hacker J, Kaper JB. 2000. Pathogenicity islands and the evolution of microbes. Annu. Rev. Microbiol. 54:641–679. 10.1146/annurev.micro.54.1.641 [DOI] [PubMed] [Google Scholar]
- 24.Seifert HS, DiRita VJ. 2006. Evolution of microbial pathogens. ASM Press, Washington, DC [Google Scholar]
- 25.Nakano M, Yamamoto S, Terai A, Ogawa O, Makino SI, Hayashi H, Nair GB, Kurazono H. 2001. Structural and sequence diversity of the pathogenicity island of uropathogenic Escherichia coli which encodes the USP protein. FEMS Microbiol. Lett. 205:71–76. 10.1111/j.1574-6968.2001.tb10927.x [DOI] [PubMed] [Google Scholar]
- 26.Anastasi EM, Matthews B, Gundogdu A, Vollmerhausen TL, Ramos NL, Stratton H, Ahmed W, Katouli M. 2010. Prevalence and persistence of Escherichia coli strains with uropathogenic virulence characteristics in sewage treatment plants. Appl. Environ. Microbiol. 76:5882–5886. 10.1128/AEM.00141-10 [DOI] [PMC free article] [PubMed] [Google Scholar]
- 27.Mokracka J, Koczura R, Jabłońska L, Kaznowski A. 2011. Phylogenetic groups, virulence genes and quinolone resistance of integron-bearing Escherichia coli strains isolated from a wastewater treatment plant. Antonie Van Leeuwenhoek 99:817–824. 10.1007/s10482-011-9555-4 [DOI] [PMC free article] [PubMed] [Google Scholar]
- 28.Hamilton MJ, Hadi AZ, Griffith JF, Ishii S, Sadowsky MJ. 2010. Large scale analysis of virulence genes in Escherichia coli strains isolated from Avalon Bay, CA. Water Res. 44:5463–5473. 10.1016/j.watres.2010.06.058 [DOI] [PMC free article] [PubMed] [Google Scholar]
- 29.Frigon D, Biswal BK, Mazza A, Masson L, Gehr R. 2013. Biological and physicochemical wastewater treatment processes reduce the prevalence of virulent Escherichia coli. Appl. Environ. Microbiol. 79:835–844. 10.1128/AEM.02789-12 [DOI] [PMC free article] [PubMed] [Google Scholar]
- 30.Hamelin K, Bruant G, El-Shaarawi A, Hill S, Edge TA, Bekal S, Fairbrother JM, Harel J, Maynard C, Masson L, Brousseau R. 2006. A virulence and antimicrobial resistance DNA microarray detects a high frequency of virulence genes in Escherichia coli isolates from Great Lakes recreational waters. Appl. Environ. Microbiol. 72:4200–4206. 10.1128/AEM.00137-06 [DOI] [PMC free article] [PubMed] [Google Scholar]
- 31.Hamelin K, Bruant G, El-Shaarawi A, Hill S, Edge TA, Fairbrother J, Harel J, Maynard C, Masson L, Brousseau R. 2007. Occurrence of virulence and antimicrobial resistance genes in Escherichia coli isolates from different aquatic ecosystems within the St. Clair River and Detroit River areas. Appl. Environ. Microbiol. 73:477–484. 10.1128/AEM.01445-06 [DOI] [PMC free article] [PubMed] [Google Scholar]
- 32.Dodd MC. 2012. Potential impacts of disinfection processes on elimination and deactivation of antibiotic resistance genes during water and wastewater treatment. J. Environ. Monit. 14:1754–1771. 10.1039/c2em00006g [DOI] [PubMed] [Google Scholar]
- 33.Courcelle J, Khodursky A, Peter B, Brown PO, Hanawalt PC. 2001. Comparative gene expression profiles following UV exposure in wild-type and SOS-deficient Escherichia coli. Genetics 158:41–64 [DOI] [PMC free article] [PubMed] [Google Scholar]
- 34.Almagro-Moreno S, Napolitano MG, Boyd EF. 2010. Excision dynamics of Vibrio pathogenicity island-2 from Vibrio cholerae: role of a recombination directionality factor VefA. BMC Microbiol. 10:306 http://www.biomedcentral.com/1471-2180/10/306 [DOI] [PMC free article] [PubMed] [Google Scholar]
- 35.Quiroz TS, Nieto PA, Tobar HE, Salazar-Echegarai FJ, Lizana RJ, Quezada CP, Santiviago CA, Araya DV, Riedel CA, Kalergis AM, Bueno SM. 2011. Excision of an unstable pathogenicity island in Salmonella enterica serovar Enteritidis is induced during infection of phagocytic cells. PLoS One 6:e26031. 10.1371/journal.pone.0026031 [DOI] [PMC free article] [PubMed] [Google Scholar]
- 36.Soto SM, Jimenez de Anta MT, Vila J. 2006. Quinolones induce partial or total loss of pathogenicity islands in uropathogenic Escherichia coli by SOS-dependent or -independent pathways, respectively. Antimicrob. Agents Chemother. 50:649–653. 10.1128/AAC.50.2.649-653.2006 [DOI] [PMC free article] [PubMed] [Google Scholar]
- 37.Middendorf B, Hochhut B, Leipold K, Dobrindt U, Blum-Oehler G, Hacker J. 2004. Instability of pathogenicity islands in uropathogenic Escherichia coli 536. J. Bacteriol. 186:3086–3096. 10.1128/JB.186.10.3086-3096.2004 [DOI] [PMC free article] [PubMed] [Google Scholar]
- 38.Caretti C, Lubello C. 2003. Wastewater disinfection with PAA and UV combined treatment: a pilot plant study. Water Res. 37:2365–2371. 10.1016/S0043-1354(03)00025-3 [DOI] [PubMed] [Google Scholar]
- 39.Gehr R, Wagner M, Veerasubramanian P, Payment P. 2003. Disinfection efficiency of peracetic acid, UV and ozone after enhanced primary treatment of municipal wastewater. Water Res. 37:4573–4586. 10.1016/S0043-1354(03)00394-4 [DOI] [PubMed] [Google Scholar]
- 40.Koivunen J, Heinonen-Tanski H. 2005. Inactivation of enteric microorganisms with chemical disinfectants, UV irradiation and combined chemical/UV treatments. Water Res. 39:1519–1526. 10.1016/j.watres.2005.01.021 [DOI] [PubMed] [Google Scholar]
- 41.Kollu K, Örmeci B. 2012. Effect of particles and bioflocculation on ultraviolet disinfection of Escherichia coli. Water Res. 46:750–760. 10.1016/j.watres.2011.11.046 [DOI] [PubMed] [Google Scholar]
- 42.APHA, AWWA, WEF. 2005. Standard methods for the examination of water and wastewater, 21st ed. American Public Health Association, Washington, DC [Google Scholar]
- 43.Morowitz HJ. 1950. Absorption effects in volume irradiation of microorganisms. Science 111:229–230. 10.1126/science.111.2879.229 [DOI] [PubMed] [Google Scholar]
- 44.Wagner M, Brumelis D, Gehr R. 2002. Disinfection of wastewater by hydrogen peroxide or peracetic acid: development of procedures for measurement of residual disinfectant and application to a physicochemically treated municipal effluent. Water Environ. Res. 74:33–50. 10.2175/106143002X139730 [DOI] [PubMed] [Google Scholar]
- 45.Kon T, Weir SC, Howell ET, Lee H, Trevors JT. 2007. Genetic relatedness of Escherichia coli isolates in interstitial water from a Lake Huron (Canada) beach. Appl. Environ. Microbiol. 73:1961–1967. 10.1128/AEM.02437-06 [DOI] [PMC free article] [PubMed] [Google Scholar]
- 46.Kuhnert P, Boerlin P, Frey J. 2000. Target genes for virulence assessment of Escherichia coli isolates from water, food and the environment. FEMS Microbiol. Rev. 24:107–117. 10.1111/j.1574-6976.2000.tb00535.x [DOI] [PubMed] [Google Scholar]
- 47.Yamamoto S, Terai A, Yuri K, Kurazono H, Takeda Y, Yoshida O. 1995. Detection of urovirulence factors in Escherichia coli by multiplex polymerase chain reaction. FEMS Immunol. Med. Microbiol. 12:85–90. 10.1111/j.1574-695X.1995.tb00179.x [DOI] [PubMed] [Google Scholar]
- 48.Jakobsen L, Garneau P, Kurbasic A, Bruant G, Stegger M, Harel J, Jensen KS, Brousseau R, Hammerum AM, Frimodt-Møller N. 2011. Microarray-based detection of extended virulence and antimicrobial resistance gene profiles in phylogroup B2 Escherichia coli of human, meat and animal origin. J. Med. Microbiol. 60:1502–1511. 10.1099/jmm.0.033993-0 [DOI] [PubMed] [Google Scholar]
- 49.Clermont O, Bonacorsi S, Bingen E. 2000. Rapid and simple determination of the Escherichia coli phylogenetic group. Appl. Environ. Microbiol. 66:4555–4558. 10.1128/AEM.66.10.4555-4558.2000 [DOI] [PMC free article] [PubMed] [Google Scholar]
- 50.Sokal RR, Rohlf FJ. 1969. Biometry, the principles and practice of statistics in biological research. W. H. Freeman, San Francisco, CA [Google Scholar]
- 51.Jackson DA, Somers KM, Harvey HH. 1989. Similarity coefficients: measures of co-occurrence and association or simply measures of occurrence? Am. Nat. 133:436–453. 10.1086/284927 [DOI] [Google Scholar]
- 52.Koivunen J, Heinonen-Tanski H. 2005. Peracetic acid (PAA) disinfection of primary, secondary and tertiary treated municipal wastewaters. Water Res. 39:4445–4453. 10.1016/j.watres.2005.08.016 [DOI] [PubMed] [Google Scholar]
- 53.Dobrindt U, Blum-Oehler G, Hartsch T, Gottschalk G, Ron EZ, Fünfstück R, Hacker J. 2001. S-fimbria-encoding determinant sfaI is located on pathogenicity island III536 of uropathogenic Escherichia coli strain 536. Infect. Immun. 69:4248–4256. 10.1128/IAI.69.7.4248-4256.2001 [DOI] [PMC free article] [PubMed] [Google Scholar]
- 54.Sabaté M, Moreno E, Pérez T, Andreu A, Prats G. 2006. Pathogenicity island markers in commensal and uropathogenic Escherichia coli isolates. Clin. Microbiol. Infect. 12:880–886. 10.1111/j.1469-0691.2006.01461.x [DOI] [PubMed] [Google Scholar]
- 55.Sabaté M, Prats G, Moreno E, Ballesté E, Blanch AR, Andreu A. 2008. Virulence and antimicrobial resistance profiles among Escherichia coli strains isolated from human and animal wastewater. Res. Microbiol. 159:288–293. 10.1016/j.resmic.2008.02.001 [DOI] [PubMed] [Google Scholar]
- 56.Stephanopoulos G, Aristidou AA, Nielsen JH. 1998. Metabolic engineering: principles and methodologies. Academic Press, San Diego, CA [Google Scholar]
- 57.Wegrzyn G, Wegrzyn A. 2002. Stress responses and replication of plasmids in bacterial cells. Microb. Cell Fact. 1:2. 10.1186/1475-2859-1-2 [DOI] [PMC free article] [PubMed] [Google Scholar]
- 58.Chang W, Small DA, Toghrol F, Bentley WE. 2005. Microarray analysis of toxicogenomic effects of peracetic acid on Pseudomonas aeruginosa. Environ. Sci. Technol. 39:5893–5899. 10.1021/es0503534 [DOI] [PubMed] [Google Scholar]
- 59.Chang W, Toghrol F, Bentley WE. 2006. Toxicogenomic response of Staphylococcus aureus to peracetic acid. Environ. Sci. Technol. 40:5124–5131. 10.1021/es060354b [DOI] [PubMed] [Google Scholar]
- 60.Chowdhury R, Sahu GK, Das J. 1996. Stress response in pathogenic bacteria. J. Biosci. 21:149–160. 10.1007/BF02703105 [DOI] [Google Scholar]
- 61.Ceragioli M, Mols M, Moezelaar R, Ghelardi E, Senesi S, Abee T. 2010. Comparative transcriptomic and phenotypic analysis of the responses of Bacillus cereus to various disinfectant treatments. Appl. Environ. Microbiol. 76:3352–3360. 10.1128/AEM.03003-09 [DOI] [PMC free article] [PubMed] [Google Scholar]
- 62.Demple B, Halbrook J. 1983. Inducible repair of oxidative DNA damage in Escherichia coli. Nature 304:466–468. 10.1038/304466a0 [DOI] [PubMed] [Google Scholar]
- 63.Witkin EM. 1976. Ultraviolet mutagenesis and inducible DNA repair in Escherichia coli. Bacteriol. Rev. 40:869–907 [DOI] [PMC free article] [PubMed] [Google Scholar]
- 64.Blum G, Falbo V, Caprioli A, Hacker J. 1995. Gene clusters encoding the cytotoxic necrotizing factor type 1, Prs-fimbriae and α-hemolysin form the pathogenicity island II of the uropathogenic Escherichia coli strain J96. FEMS Microbiol. Lett. 126:189–195. 10.1111/j.1574-6968.1995.tb07415.x [DOI] [PubMed] [Google Scholar]
- 65.Blum G, Ott M, Lischewski A, Ritter A, Imrich H, Tschape H, Hacker J. 1994. Excision of large DNA regions termed pathogenicity islands from tRNA-specific loci in the chromosome of an Escherichia coli wild-type pathogen. Infect. Immun. 62:606–614 [DOI] [PMC free article] [PubMed] [Google Scholar]
- 66.Middendorf B, Blum-Oehler G, Dobrindt U, Mühldorfer I, Salge S, Hacker J. 2001. The pathogenicity islands (PAIs) of the uropathogenic Escherichia coli strain 536: island probing of PAI II536. J. Infect. Dis. 183:S17–S20. 10.1086/318843 [DOI] [PubMed] [Google Scholar]
- 67.Vila J, Simon K, Ruiz J, Horcajada JP, Velasco M, Barranco M, Moreno A, Mensa J. 2002. Are quinolone-resistant uropathogenic Escherichia coli less virulent? J. Infect. Dis. 186:1039–1042. 10.1086/342955 [DOI] [PubMed] [Google Scholar]
Associated Data
This section collects any data citations, data availability statements, or supplementary materials included in this article.