

Abstract
A common source of disturbance for coastal aquatic habitats is nutrient enrichment through anthropogenic activities. Although the water column bacterioplankton communities in these environments have been characterized in some cases, changes in α-diversity and/or the abundances of specific taxonomic groups across enriched habitats remain unclear. Here, we investigated the bacterial community changes at three different nutrient-enriched and adjacent undisturbed habitats along the north coast of Crete, Greece: a fish farm, a closed bay within a town with low water renewal rates, and a city port where the level of nutrient enrichment and the trophic status of the habitat were different. Even though changes in α-diversity were different at each site, we observed across the sites a common change pattern accounting for most of the community variation for five of the most abundant bacterial groups: a decrease in the abundance of the Pelagibacteraceae and SAR86 and an increase in the abundance of the Alteromonadaceae, Rhodobacteraceae, and Cryomorphaceae in the impacted sites. The abundances of the groups that increased and decreased in the impacted sites were significantly correlated (positively and negatively, respectively) with the total heterotrophic bacterial counts and the concentrations of dissolved organic carbon and/or dissolved nitrogen and chlorophyll α, indicating that the common change pattern was associated with nutrient enrichment. Our results provide an in situ indication concerning the association of specific bacterioplankton groups with nutrient enrichment. These groups could potentially be used as indicators for nutrient enrichment if the pattern is confirmed over a broader spatial and temporal scale by future studies.
INTRODUCTION
Most of the total nitrogen (N) and phosphorus (P) and half of the carbon (C) in the biosphere are stored in bacteria and archaea (1). These communities are extremely diverse assemblages with high metabolic capacities (2, 3). The bacterial communities of the water column, i.e., bacterioplankton communities, have been well characterized in marine habitats (4–7). Many studies have shown that the composition and structure of bacterioplankton communities are highly dynamic and vary depending on several factors, such as season (5, 8–11), latitude (6, 12), and water depth (13–15).
The eastern Mediterranean Sea is an ultraoligotrophic marine habitat, where primary production can be as low as 25 to 30 μmol of C m−3 day−1 (16). Several studies have shown that phosphorus limits bacterioplankton production and growth, while phytoplankton production and growth are colimited by both phosphorus and nitrogen (16–18). While at a large scale this region is ultraoligotrophic, at a fine scale and particularly in coastal areas, anthropogenic activities often locally increase the nutrient input, altering the trophic status of the habitat.
Aquaculture is the fastest-growing food sector in the world and covers a large proportion of the shallow sheltered sites and semienclosed bays in Greece, Croatia, and Turkey, as the coastal landscape of these countries favors aquaculture deployment (19, 20). Aquaculture acts as a source of nutrient input for coastal habitats through the discharge of organic wastes (organic carbon, phosphorus, and nitrogen compounds) from unused fish food and feces (21, 22). In addition, the continuous input of these compounds near fish farms favors local algal blooms and other eutrophication events (23). Data regarding the overall changes in the water column bacterioplankton community in response to fish farming are scarce. However, some studies have reported increased bacterioplankton biomass in organically enriched sediments and water beneath or adjacent to fish farms (24–26), while other studies have focused on the impact of fish farming on sediment biogeochemical processes (27–29).
Ports can also be hot spots for nutrient input. The fuel by-products containing aliphatic hydrocarbons that are present in ports act as a carbon source for certain bacterial species (30). Moreover, ports often receive untreated or partially treated nutrient-rich sewage effluents (Victoria Harbor in Hong Kong is an example [31]). In addition, ship maneuvers shake the sea bottom and increase the nutrient concentration in the water column, particularly in shallow waters (32). Interestingly, studies assessing the structure of the bacterioplankton community within ports are also scarce and often reveal contrasting patterns of change within the communities (33–35).
Other types of habitats commonly affected by nutrient enrichment are coastal bays and lagoons. The level of external nutrient input into these habitats is in the same range as that in deeper estuaries, but their significantly smaller watersheds and lower water renewal rates make these habitats particularly vulnerable to eutrophication because nutrients accumulate faster in the water column and there is minimal mixing with the open sea (36). Nutrient loading in these habitats causes harmful algal blooms, sea grass losses, food web structure changes, increased hypoxia/anoxia events, burial disruption, and organic matter degradation (36–39). Furthermore, in habitats with longer water residence times, phytoplankton chlorophyll and anoxic/hypoxic volumes are further increased in the water column (40, 41). The structure of the bacterioplankton community within coastal bays has been widely studied. Several studies have revealed interesting attributes of the bacterial assemblages in these habitats, such as seasonality (42), occasional blooms of certain phylotypes (43), decreased diversity in heavily polluted sites (44), or increased diversity as a result of mixing of marine and freshwater phylotypes in cases of freshwater input (45, 46).
In this study, we examined the bacterioplankton community composition and structure at three nutrient-enriched habitats along the north coast of Crete, Greece: a fish farm, a closed bay with low rates of water renewal, and a city port. We tested whether or not the trends in the α-diversity parameters and/or in the abundances of specific taxonomic groups in the bacterioplankton communities of these habitats were similar to those of the bacterioplankton communities of adjacent nonenriched sites.
MATERIALS AND METHODS
Sampling sites and experimental setup.
Sampling was performed from 27 to 29 April 2009 at three different sites along the north coast of Crete along the west-to-east axis: (i) Souda (Sd; 35°29′N, 24°4′E), a city port in a sheltered bay; (ii) Agios Nikolaos (Ag; 35°11′N, 25°43′E), a closed bay with low water exchange with the sea where phytoplankton blooms occur periodically; and (iii) Sitia (St; 35°15′N, 26°13′E), a near-shore fish farm (Fig. 1A). The far eastern site, Sitia, is 197.05 km from the far western site, Souda, while the intermediate site, Agios Nikolaos, is 45.95 and 153.54 km from Sitia and Souda, respectively. At each site, sampling was performed at two different areas: at impacted areas, i.e., within Souda Port, within Agios Nikolaos Bay, and underneath the fish farm cages at Sitia, and at control areas, i.e., outside Souda Port, outside Agios Nikolaos Bay, and approximately 500 m upstream of the cages at Sitia (Fig. 1B, C, and D, respectively). Two liters of water (3 m deep) was collected in triplicate at each area with the aid of a Niskin bottle and filtered for DNA extraction, and the dissolved nutrient, organic carbon, and chlorophyll α (Chl-α) concentrations were determined (see below). Thus, a total of 18 samples were collected: 6 samples (3 impacted samples and 3 control samples) from each site. Two milliliters of each water sample was also fixed with glutaraldehyde for later use in flow cytometry.
FIG 1.

Sampling map showing the locations of all three sampling sites across the north coast of Crete, the locations of the control and impacted sites, and the codes for the sampling locations at each site. (A) The three sampling sites; (B) impacted (SdI) and control (SdC) sites at Souda; (C) impacted (AgI) and control (AgC) sites at Agios Nikolaos; (D) impacted (StI) and control (StC) sites at Sitia. All images were captured and modified using Google Earth.
DNA extraction and PCR.
Total genomic DNA extraction was performed as described previously (47) with the modification described elsewhere (48). We modified the protocol in the following manner: lysis buffer was not added to the filters prior to storage at −80°C. The DNA yield was quantified using a NanoDrop spectrophotometer (Thermo Scientific, Wilmington, DE), and the DNA quality was visualized through agarose gel electrophoresis with 5 μl of DNA extract. The DNA extracts were stored at 4°C until further use.
PCR was performed using a T-personal thermocycler (Biometra, Goettingen, Germany) under aseptic conditions in a laminar flow chamber to avoid contamination with environmental bacteria. Sterile ultrapure water was used as negative control in all PCRs.
A ∼200-bp fragment of the V3 region of the bacterial 16S rRNA locus was amplified from total genomic DNA using the universal bacterial primers 329F [5′-ACGGNCCAGACTCCTAC-3′] and 518R (5′-ATTACCGCGGCTGCTGG-3′) (49). Each PCR mixture (50 μl) contained 0.3 mM each primer, 50 ng of template DNA, 1× KAPA HiFi fidelity buffer (Kapa Biosystems, Wilmington, MA) containing 2 mM MgCl2, 1 unit of KAPA HiFi HotStart DNA polymerase (Kapa), and 0.3 mM each deoxynucleoside triphosphate. The PCR conditions were 95°C for 4 min, followed by 25 cycles of 98°C for 20 s, 55°C for 15 s, and 72°C for 30 s, with a final extension step at 72°C for 5 min.
Environmental parameters.
The water temperature was measured on-site using a regular Hg thermometer. Water pH, salinity, and conductivity were measured using an HQ40d multiparameter meter (Hach, Loveland, CO).
The total number of heterotrophic bacteria was determined using a Becton, Dickinson FACSCalibur flow cytometer (Becton, Dickinson, Franklin Lakes, NJ) equipped with an air-cooled laser at 488 nm and standard filters, and Milli-Q water was used as the sheath fluid. The samples were run at high speed for 1 min. The exact flow rate for high-speed performance was measured on a daily basis. The abundance was calculated using the acquired cell counts and the respective flow rates. Heterotrophic bacterial cell counts were acquired using CellQuest software and analyzed using the Paint-A-Gate software package (Becton, Dickinson). The samples (2 ml) were fixed on-site using 25% glutaraldehyde (final concentration, 0.5%; Sigma-Aldrich, St. Louis, MO) which had previously been filtered through a 0.2-μm pore-size filter. After fixation, the samples were deep frozen in liquid nitrogen and stored at −80°C until counting. After thawing at room temperature, the samples were stained with SYBR green I (4 × 10⁻⁴ of the commercial dilution) and incubated for 10 min in the dark.
For the determination of total Chl-α, water (0.5 liter) was filtered through glass fiber filters (diameter, 47 mm; pore size, 0.7 μm; Whatman GF/F) under low vacuum pressure (<200 mm Hg) on-site. The filters were kept frozen until Chl-α extraction. The chlorophyll concentration was determined according to the method described previously (50) using a Turner fluorometer, following extraction in 10 ml acetone (90%) at 4°C for 16 h.
The dissolved nitrogen (DN) and dissolved phosphorus (DP) concentrations in the water column were determined through Kjeldahl digestion, using Hach methods 8075, 8039, and 8048 and reagent kits from the same company according to the manufacturer's instructions. The measurements were performed using a DR 2800 spectrophotometer (Hach). The DN concentration was determined as the sum of the nitrate content (N-NO3, measured using Hach method 8039 before Kjeldahl digestion) and total Kjeldahl nitrogen (ammonia and organically bound nitrogen in the trinegative state, measured using Hach method 8075 after Kjeldahl digestion). The DP concentration was measured using Hach method 8048 after Kjeldahl digestion. The detection limit for both DN and DP was 0.02 mg liter−1, while the quantitation limits were 0.07 mg liter−1 for DN and 0.05 mg liter−1 for DP.
The dissolved organic carbon (DOC) concentration was measured in a TOC-Vcpn analyzer (Shimadzu, Duisburg, Germany) according to the manufacturer's instructions. For the removal of inorganic C, the water samples were first acidified to pH 2 using 2 N HCl, and the resulting CO2 was removed through N2 gas sparging for 10 min per sample.
The analyses described above were conducted in triplicate for each sample to determine standard errors. For the DN, DP, and DOC analyses, water was first filtered through a 0.22-μm-pore-size filter (Millipore, Billerica, MA) to exclude the measurement of the N, P, and organic C resulting from cell lysis.
454 sequencing.
Pyrosequencing was performed partly in the Institute of Marine Biology and Genetics (IMBG) of the Hellenic Center for Marine Research and partly in the High-Throughput Sequencing and Genotyping Unit, R. J. Carver Biotechnology Center, University of Illinois. The amplicon pools were amplified through emulsion PCR and sequenced on a Roche GS FLX pyrosequencer (Roche, Basel, Switzerland) using adaptors A and B, standard Roche Titanium system protocols and supplies, and the amplicon base-calling pipeline.
The AmpliconNoise (v1.4) algorithm package (51) was used for correcting the pyrosequencing reads from too short and/or noisy reads, sequencing errors, PCR single base substitutions, and PCR chimeras. The clean sequences were assigned to samples according to their bar codes. All sequences were subsequently trimmed at the reverse or forward primer sequence (on the basis of the originating adaptor sequences), and reverse sequences were reverse complemented using a custom RealBasic script (release 7; Real Software Inc., Austin, TX). An abundance matrix (operational taxonomic unit [OTU] table) was formed after clustering the clean sequences into OTUs of 97% or more sequence similarity using the UClust algorithm (52).
The phylogenetic affiliation of the OTUs was performed in the QIIME software package (v1.8) (53) using UClust and comparing the consensus sequences with the sequences in the latest (May 2013) release of the Greengenes reference data set (54). The OTUs affiliated with the SAR86 clade were manually reassigned due to a known problem in the donor taxonomy in this version of the Greengenes data set (Phil Hugenholtz, personal communication). The OTUs matching diatom plastids and those represented by only one sequence in the whole data set (singletons) were identified at this stage and removed before further analysis. Using the appropriate QIIME algorithm (which uses an implementation of the Mersenne twister pseudo-random-number generator), the OTU table was subsequently rarefied down to the smallest sample size to achieve identical sample sizes. The resulting OTU table was subsequently transformed to a pairwise distance matrix using the Bray-Curtis (BC) similarity index, after a square root transformation.
Statistical analyses.
For α-diversity estimates, Shannon's index (H′log 2), Pielou's evenness indicator (J′), and the observed number of OTUs (S; at a rarefied sample size of 4,217) were calculated using Primer 6 software for Windows (Primer-E Ltd., Plymouth, United Kingdom). Similarity percentage (SIMPER) analysis and analysis of similarity (ANOSIM) tests were also performed using Primer 6 software. Box plots of 25 to 75% quartiles, nonparametric t tests for α-diversity parameters (Shannon's index, Pielou's evenness indicator, and the observed number of OTUs), and Spearman rank correlations between the abundances of the most abundant bacterial groups and the environmental parameters were performed using the PAST software package (v2.17c) (55). The P values were corrected using the false detection rate (FDR) method (56) for multiple comparisons. The graphical representation of the rarefaction curves, the principal coordinates analysis (PCoA) biplot, and the unweighted-pair group method with arithmetic mean (UPGMA) tree with jackknife support (resulting from 100 rarefied OTU tables at 4,217 sequences each) were performed in QIIME.
Nucleotide sequence accession number.
The raw sequence files for every sample have been deposited in the NCBI SRA database as an .sff file with accession number SRP016044 for the whole experiment.
RESULTS
The water temperature ranged from 17 to 17.6°C among the sites, the salinity ranged from 38 to 38.6 g NaCl liter−1, and the conductivity ranged from 57.1 to 57.9 mS cm−1. The pH varied from 7.96 to 8.14 among all samples except the impacted samples obtained from Sitia, where the pH was lower (pH 7.58). The DP and DN concentrations were similar among the control samples (0.54 to 0.57 mg liter−1 and 3.2 to 3.81 mg liter−1, respectively). The concentration of DP was similar among the impacted samples (0.53 to 0.56 mg liter−1), but this should be expected since the eastern Mediterranean Sea is P starved (16). The concentration of DN was increased from 32 to 45% (4.63 to 5.03 mg liter−1) in the impacted samples compared with that in the control samples. The DOC concentration varied among the control samples (1.4 to 2.4 mg liter−1). In the impacted samples, the DOC concentration increased by 49 to 233% compared with that in the control samples. Similarly, the concentration of Chl-α and the number of heterotrophic bacterial cells in the impacted samples increased by 54.2 to 80.3% and 111.1 to 423.8%, respectively. A summary of the environmental parameters is presented in Table S1 in the supplemental material.
A summary of the sequencing/noise removal results is presented in Table S2 in the supplemental material. The clean sequences were clustered into 3,275 OTUs. Seventy-eight of these OTUs resembled plastid sequences and were removed from further analyses. The proportions of plastid sequences in the samples varied from 0.5 to 7.3%, except for the samples from Agios Nikolaos Bay, where the percentages varied from 12.7 to 15.8%, likely reflecting the presence of high ratios of diatom DNA in the original solution. Rarefaction curves were constructed on the basis of the number of OTUs observed after the removal of plastid OTUs (see Fig. S1 in the supplemental material). A total number of 2,043 singleton OTUs (0.2 to 3.8% of reads per sample) were further removed from the OTU table.
After phylogenetic classification, the majority of the OTUs (>99.6%) were assigned to 328 genera, 198 families, 108 orders, 55 classes, and 28 phyla belonging to the bacterial kingdom (Table 1). Three major phyla comprised 93.4 to 99.5% of the total community in each sample: Proteobacteria (67 to 84% per sample), Bacteroidetes (6 to 32% per sample), and Cyanobacteria (1 to 14% per sample). Alphaproteobacteria (44.6%, on average), Gammaproteobacteria (28.7%, on average), Flavobacteria (11.4%, on average), and Synechococcophycideae (6.5%, on average) were the major classes. The most abundant groups within each class were the Rickettsiales-Rhodobacterales, Alteromonadales-Oceanospirillales-SAR86, Flavobacteriales, and Synechococcales, respectively. Subsequently, the most abundant families were the Pelagibacteraceae, Rhodobacteraceae, Alteromonadaceae-Colwelliaceae-OM60, Cryomorphaceae-Flavobacteriaceae, and Synechococcaceae. A more detailed description of the community, including the less abundant families and groups, can be found in Data Set S1 in the supplemental material.
TABLE 1.
Phylogroup distribution in impacted and control samples at different sitesa
| Sample | Mean no. of: |
||||
|---|---|---|---|---|---|
| Genera | Families | Orders | Classes | Phyla | |
| AgI | 99.33 | 70.33 | 44.3 | 19 | 8.33 |
| AgC | 90.33 | 68.66 | 44 | 21.33 | 11.66 |
| StI | 79.66 | 60 | 39.33 | 20 | 9.66 |
| StC | 84.33 | 70 | 44 | 21.66 | 11 |
| SdI | 126 | 90.33 | 52.33 | 24 | 12 |
| SdC | 136.33 | 102.33 | 62 | 30.66 | 15.66 |
| Total | 328 | 198 | 108 | 55 | 28 |
The samples are labeled as described in the legend to Fig. 1. The total number of phylogroups is shown at the bottom. The data for three replicates were pooled.
Community variation among all samples.
We calculated the Bray-Curtis similarity index among all samples and subsequently examined significant groupings using ANOSIM tests. All control samples formed a distinct group (ANOSIM test, global R = 0.615, P = 0.016), while each triplicate of impacted samples from every site formed a separate cluster (ANOSIM test, global R = 1, P = 0.004), indicating that the three groups of impacted samples differed both from the controls and from each other. A UPGMA tree with jackknife support, which illustrates the relationships among samples, is shown in Fig. 2.
FIG 2.

UPGMA tree with jackknife support. Samples are named as described in the legend to Fig. 1. The number after the sample name indicates the replicate number. Nodes with more than 75% jackknife support are colored black, while nodes with less than 75% jackknife support are colored gray.
Changes in OTU richness and evenness at each site.
Shannon's index (H′log 2), the observed number of OTUs (S), and Pielou's evenness indicator (J′) were used to assess diversity, OTU richness at the rarefied sample size, and evenness, respectively. At Agios Nikolaos, OTU richness remained unchanged, while evenness and diversity increased in the impacted samples (Table 2; see Fig. S2 in the supplemental material). OTU richness, evenness, and diversity were reduced in the impacted samples from Sitia. At Souda, the OTU richness decreased in the impacted samples and the evenness increased, while the diversity remained unchanged.
TABLE 2.
Number of observed OTUs, Piellou's evenness indicator, and log 2-based Shannon index for each samplea
| Sample | Agios Nikolaos |
Sitia |
Souda |
||||||
|---|---|---|---|---|---|---|---|---|---|
| S | J′ | H′log 2 | S | J′ | H′log 2 | S | J′ | H′log 2 | |
| Impacted 1 | 222 | 0.6529 | 5.089 | 172 | 0.5396 | 4.042 | 250 | 0.6670 | 5.313 |
| Impacted 2 | 231 | 0.6591 | 5.175 | 145 | 0.4742 | 3.428 | 245 | 0.6591 | 5.231 |
| Impacted 3 | 208 | 0.6546 | 5.041 | 142 | 0.4291 | 2.954 | 268 | 0.6602 | 5.325 |
| Control 1 | 221 | 0.6212 | 4.838 | 186 | 0.6750 | 5.089 | 337 | 0.6296 | 5.286 |
| Control 2 | 194 | 0.6181 | 4.697 | 202 | 0.6472 | 4.956 | 318 | 0.6212 | 5.164 |
| Control 3 | 209 | 0.6306 | 4.861 | 197 | 0.6485 | 4.943 | 289 | 0.6215 | 5.081 |
| Increase or decrease | Increase | Increase | Decrease | Decrease | Decrease | Decrease | Increase | ||
Significant changes for each of these parameters between impacted and control samples at each site are indicated on the bottom line. S, number of observed OTUs; J′, Piellou's evenness indicator; H′log 2, log 2-based Shannon index.
Community changes of the most abundant phylogenetic groups.
We examined the changes in the abundances of the most abundant phylogenetic groups, i.e., the eight most abundant bacterial families and the SAR86 clade, between the impacted and control samples within each site. For five groups, the trend was similar at each site: the abundances of the Rhodobacteraceae, Alteromonadaceae, and Cryomorphaceae increased but the abundances of the Pelagibacteraceae and SAR86 decreased in the impacted samples compared to the control samples (Table 3). Changes in the abundances of these groups accounted for the majority of the community variation between impacted and control samples at each site (SIMPER [n = 6], 55.96, 59.81, and 73.04% of the total variation in Souda, Agios Nikolaos, and Sitia, respectively). A PCoA biplot illustrating the abundances of these five groups with respect to the ordination of the samples is shown in Fig. 3. The pattern of change was different for the other four groups within each site: the abundance of the Flavobacteriaceae and OM60 increased in Souda and Agios Nikolaos but decreased in Sitia, the abundance of the Synechococcaceae increased in Souda but decreased in Agios Nikolaos and Sitia, and the abundance of the Colwelliaceae decreased in Souda but increased in Agios Nikolaos and Sitia (Table 3).
TABLE 3.
Average relative abundances of the nine most abundant groups for each impacted and control sitea
| Group | Souda |
Agios Nikolaos |
Sitia |
||||||
|---|---|---|---|---|---|---|---|---|---|
| Avg relative abundance |
% changeb | Avg relative abundance |
% change | Avg relative abundance |
% change | ||||
| Control | Impacted | Control | Impacted | Control | Impacted | ||||
| Pelagibacteraceae | 46.2 | 31.3 | −32.4 | 55.2 | 15.6 | −71.7 | 47.2 | 7.6 | −83.9 |
| SAR86 | 9.7 | 8.5 | −12.7 | 9.6 | 5.21 | −45.7 | 11.7 | 2.0 | −82.8 |
| Rhodobacteraceae | 6.8 | 11.0 | +60.9 | 3.9 | 25.8 | +565 | 2.8 | 12.5 | +346 |
| Alteromonadaceae | 1.3 | 4.4 | +246 | 1.0 | 8.5 | +745 | 1.3 | 46.2 | +3,532 |
| Cryomorphaceae | 0.8 | 1.4 | +74.3 | 0.8 | 3.0 | +278 | 0.5 | 12.4 | +2,315 |
| Flavobacteriaceae | 3.7 | 6.7 | +79.5 | 5.3 | 22.2 | +319 | 6.3 | 3.2 | −50.0 |
| Synechococcaceae | 7.1 | 12.1 | +70.3 | 6.3 | 0.7 | −88.5 | 11.4 | 1.6 | −85.7 |
| OM60 | 1.9 | 2.6 | +34.1 | 1.3 | 2.0 | +56.9 | 0.2 | 0.1 | −50.0 |
| Colwelliaceae | 0.1 | 0.06 | −38.5 | 0.06 | 0.1 | +114 | <0.01 | 8.5 | +108,000 |
Replicate data were pooled. The samples are labeled as described in the legend to Fig. 1.
Average percent change of the relative abundance of each group in impacted samples compared to that in the control samples at each site.
FIG 3.
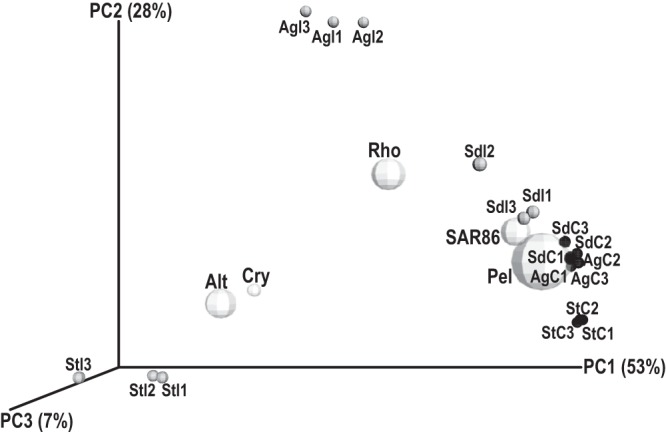
PCoA biplot of samples containing the bacterial groups Pelagibacteraceae (Pel), SAR86, Rhodobacteraceae (Rho), Alteromonadaceae (Alt), and Cryomorphaceae (Cry). Samples are named as described in the legend to Fig. 1. The number after the sample name indicates the replicate number. Black spheres, control samples; gray spheres, impacted samples; white spheres, bacterial groups. The diameters of the spheres are analogous to the group's mean abundance among all samples.
We further examined the potential association between the changes in the abundance of each of the nine most abundant groups and the environmental parameters that are related to nutrient enrichment, i.e., the number of heterotrophic bacteria and the amounts of Chl-α, DP, DN, and DOC. The abundances of the Alteromonadaceae and Rhodobacteraceae were positively correlated with the number of heterotrophic bacteria and Chl-α, DN, and DOC concentrations (n = 18, 0.884 > rho > 0.552, 0.04 > P > 3E−06) (Table 4). The abundance of the Cryomorphaceae was positively correlated with the number of heterotrophic bacteria and the Chl-α and DOC concentrations (n = 18, 0.697 > rho > 0.556, 0.04 > P > 0.003) (Table 4). The abundance of the Pelagibacteraceae was negatively correlated with the number of heterotrophic bacteria and the amounts of Chl-α, DN, and DOC (n = 18, −0.705 > rho > −0.917, 0.003 > P > 2E−07) (Table 4). The abundance of SAR86 was negatively correlated with the number of heterotrophic bacteria and the amounts of DN and DOC (n = 18, −0.613 > rho > −0.670, 0.017 > P > 0.006) (Table 4). The abundance of the Colwelliaceae was positively correlated with the amount of DOC (n = 18, rho = 0.624, P = 0.014) (Table 4), and the abundances of the Flavobacteriaceae, Synechococcaceae, and OM60 were not significantly correlated with any of the environmental parameters (n = 18, 0.461 > rho > −0.463, 1 > P > 0.08) (Table 4).
TABLE 4.
Spearman rank correlations among abundances of the nine most abundant bacterial groups and the dissolved nutrients and eutrophication indicatorsa
| Group | Correlationa |
||||
|---|---|---|---|---|---|
| Heter. bact. | Chl-α concn | DP concn | DN concn | DOC concn | |
| Pelagibacteraceae | −0.917** | −0.705** | NS | −0.793** | −0.766** |
| SAR86 | −0.670** | NS | NS | −0.613* | −0.653** |
| Alteromonadaceae | 0.884** | 0.737** | NS | 0.745** | 0.697** |
| Rhodobacteraceae | 0.693** | 0.552* | NS | 0.721** | 0.556* |
| Cryomorphaceae | 0.697** | 0.556* | NS | NS | 0.585* |
| Flavobacteriaceae | NS | NS | NS | NS | NS |
| Synechococcaceae | NS | NS | NS | NS | NS |
| OM60 | NS | NS | NS | NS | NS |
| Colwelliaceae | NS | NS | NS | NS | 0.624* |
Heter. bact., number of heterotrophic bacteria; Chl-α, chlorophyll alpha; DP, DN, and DOC, dissolved phosphorus, nitrogen, and organic carbon, respectively; NS, nonsignificant correlation. Coefficient values of the rho statistic in bold represent significant correlations at the 0.05 (*) or 0.01 (**) level.
DISCUSSION
Changes in both species richness and evenness were different within each of the three sites examined in this study. This indicates that changes in α-diversity may not be consistent among different nutrient-enriched habitats. Other studies have also reported contrasting results for species richness. For instance, species richness was increased with increasing nutrient availability in oligotrophic lakes (57) and was also increased after the addition of dissolved organic matter in continuous seawater cultures (58). On the other hand, it was decreased after phosphate and nitrogen addition in another continuous seawater culture experiment (59) and in a grassland soil study (60), respectively.
To our knowledge, there are currently no studies examining the effect of nutrient enrichment on bacterial community evenness using high-throughput sequencing. In our study, the increase in species evenness in the impacted samples at Souda and Agios Nikolaos could be attributed to the partial replacement of the Pelagibacteraceae and SAR86, which were the most abundant groups in the control samples, by the Rhodobacteraceae, Alteromonadaceae, and Cryomorphaceae. In contrast, the Alteromonadaceae dominated the community in impacted samples at Sitia, resulting in decreased community evenness.
Similarly to changes in the α-diversity components, the changes in the abundances of the most abundant bacterioplankton groups would be expected to differ across the different nutrient-enriched habitats in this study. If nutrient enrichment could be considered a source of disturbance for bacterioplankton communities, then the type of disturbance in this study would be characterized as “press” (i.e., long term) rather than as “pulse” (i.e., short term) (61) with various durations and intensities. That, combined with the different nutrient input sources and landscape morphologies at each site, would be expected to induce different changes in bacterioplankton community composition and structure across the habitats. That was observed when the overall community variation was examined, as each triplicate of impacted samples was significantly different from the triplicate of impacted samples from the other two sites. In contrast, a consistent pattern concerning the changes in the abundances of five of the most abundant bacterial taxonomic groups was observed across the impacted sites. Changes in the abundances of these groups accounted for the majority of the community variation within each site and were significantly correlated with most of the environmental parameters related to nutrient enrichment.
It has been shown in other studies that members of the groups with similar changes in abundance across sites are increased or decreased in abundance in cases of increased amounts of nutrients, Chl-α, or DOC in the water column. Pelagibacteraceae (also known as the SAR11 clade) is a family of extreme oligotrophs that are widely distributed over the Earth's oceans (62). The abundance of the Pelagibacteraceae has been shown to decrease in cases of increasing DOC (63, 64), bacterial cell density (63), and Chl-α fluorescence (65) in the water column, in accordance with our findings. The SAR86 clade is also abundant in the surface ocean and shares many genome-wide characteristics with the Pelagibacteraceae family (66). However, some studies have shown an increase in the abundance and activity of that clade in nutrient-rich or high-Chl-α-content waters (67, 68), while others have shown the opposite (63, 69). Our results agree with the latter, demonstrating a consistent trend toward a decrease in the abundance of the SAR86 clade at the impacted sites, similar to the findings for the Pelagibacteraceae family. The Alteromonadaceae family has been associated with increased organic carbon levels (64, 70, 71), whereas the Rhodobacteraceae and Cryomorphaceae have been associated with phytoplankton-derived organic matter decomposition at the late stages of phytoplankton blooms (68, 70, 72–74). Our findings corroborate these observations, as the abundance of the Alteromonadaceae was mostly increased in the impacted samples from Sitia, where the DOC content was the highest, and the abundance of the Rhodobacteraceae was increased in impacted samples at Agios Nikolaos, where Chl-α levels were the highest and phytoplankton blooms have occurred in the past. Interestingly, the Cryomorphaceae were mostly increased in impacted samples at Sitia, whereas members of another abundant Bacteroidetes family, the Flavobacteriaceae, were mostly increased in Agios Nikolaos. Even though similarities in the genomes of many Bacteroidetes indicate that they have adopted the same life strategy, which is associated with particulate organic matter degradation (75), it remains unclear why in this study different Bacteroidetes groups were increased in abundance in different nutrient-enriched sites. We can only hypothesize that this may be related to the different origins of the alga-derived organic matter in the two sites, possibly due to the degradation of the macroalga Posidonia oceanica near the fish farm in Sitia (76). Another indication for macroalga degradation in Sitia comes from the increased abundance in this site of the Colwelliaceae, a group related to macroalga tissue decomposition (77).
In summary, this study demonstrates that, unlike changes in α-diversity components, changes in the abundances of five abundant bacterioplankton groups were similar across the three nutrient-enriched habitats studied. This in situ pattern is consistent with the known life strategies of each of the five groups, was associated with the environmental parameters related to nutrient enrichment, and accounted for a large part of the community variation between the impacted and the control samples at each site. Future studies, which could be conducted across nutrient-enriched habitats over a broader spatial and/or temporal scale, could determine how general this pattern may be. That may enable the potential use of the abundances of these groups, especially the widespread clades SAR11 and SAR86, as ecological indicators for monitoring nutrient enrichment in the seawater column.
Supplementary Material
ACKNOWLEDGMENTS
We thank Anastasia Tsiola for her assistance with the flow cytometry analyses; Stella Voutsadaki, Nikos Xekoukoulotakis, and Katerina Drosou for their assistance with the nutrient analyses; Aris Moustakas, Greg Caporaso, and Justin Kuczynski for their valuable advice regarding the statistical analyses; and the anonymous reviewers for their constructive comments.
Footnotes
Published ahead of print 18 April 2014
Supplemental material for this article may be found at http://dx.doi.org/10.1128/AEM.00088-14.
REFERENCES
- 1.Allison SD, Martiny JBH. 2008. Resistance, resilience, and redundancy in microbial communities. Proc. Natl. Acad. Sci. U. S. A. 105:11512–11519. 10.1073/pnas.0801925105 [DOI] [PMC free article] [PubMed] [Google Scholar]
- 2.Sogin ML, Morrison HG, Huber JA, Welch DM, Huse SM, Neal PR, Arrieta JM, Herndl GJ. 2006. Microbial diversity in the deep sea and the underexplored “rare biosphere.” Proc. Natl. Acad. Sci. U. S. A. 103:12115–12120. 10.1073/pnas.0605127103 [DOI] [PMC free article] [PubMed] [Google Scholar]
- 3.Venter JC, Remington K, Heidelberg JF, Halpern AL, Rusch D, Eisen JA, Wu D, Paulsen I, Nelson KE, Nelson W, Fouts DE, Levy S, Knap AH, Lomas MW, Nealson K, White O, Peterson J, Hoffman J, Parsons R, Baden-Tillson H, Pfannkoch C, Rogers YH, Smith HO. 2004. Environmental genome shotgun sequencing of the Sargasso Sea. Science 304:66–74. 10.1126/science.1093857 [DOI] [PubMed] [Google Scholar]
- 4.Alonso-Saez L, Balague V, Sa EL, Sanchez O, Gonzalez JM, Pinhassi J, Massana R, Pernthaler J, Pedros-Alio C, Gasol JM. 2007. Seasonality in bacterial diversity in north-west Mediterranean coastal waters: assessment through clone libraries, fingerprinting and FISH. FEMS Microbiol. Ecol. 60:98–112. 10.1111/j.1574-6941.2006.00276.x [DOI] [PubMed] [Google Scholar]
- 5.Gilbert JA, Steele JA, Caporaso JG, Steinbruck L, Reeder J, Temperton B, Huse S, McHardy AC, Knight R, Joint I, Somerfield P, Fuhrman JA, Field D. 2012. Defining seasonal marine microbial community dynamics. ISME J. 6:298–308. 10.1038/ismej.2011.107 [DOI] [PMC free article] [PubMed] [Google Scholar]
- 6.Pommier T, Canbäck B, Riemann L, Boström KH, Simu K, Lundberg P, Tunlid A, Hagström Å. 2007. Global patterns of diversity and community structure in marine bacterioplankton. Mol. Ecol. 16:867–880. 10.1111/j.1365-294X.2006.03189.x [DOI] [PubMed] [Google Scholar]
- 7.Barberán A, Casamayor EO. 2010. Global phylogenetic community structure and β-diversity patterns in surface bacterioplankton metacommunities. Aquat. Microb. Ecol. 59:1–10. 10.3354/ame01389 [DOI] [Google Scholar]
- 8.Morris RM, Vergin KL, Cho JC, Rappé MS, Carlson CA, Giovannoni SJ. 2005. Temporal and spatial response of bacterioplankton lineages to annual convective overturn at the Bermuda Atlantic time-series study site. Limnol. Oceanogr. 50:1687–1696. 10.4319/lo.2005.50.5.1687 [DOI] [Google Scholar]
- 9.Pinhassi J, Hagström Å. 2000. Seasonal succession in marine bacterioplankton. Aquat. Microb. Ecol. 21:245–256. 10.3354/ame021245 [DOI] [Google Scholar]
- 10.Schauer M, Balagué V, Pedrós-Alió C, Massana R. 2003. Seasonal changes in the taxonomic composition of bacterioplankton in a coastal oligotrophic system. Aquat. Microb. Ecol. 31:163–174. 10.3354/ame031163 [DOI] [Google Scholar]
- 11.Andersson AF, Riemann L, Bertilsson S. 2010. Pyrosequencing reveals contrasting seasonal dynamics of taxa within Baltic Sea bacterioplankton communities. ISME J. 4:171–181. 10.1038/ismej.2009.108 [DOI] [PubMed] [Google Scholar]
- 12.Fuhrman JA, Steele JA, Hewson I, Schwalbach MS, Brown MV, Green JL, Brown JH. 2008. A latitudinal diversity gradient in planktonic marine bacteria. Proc. Natl. Acad. Sci. U. S. A. 105:7774–7778. 10.1073/pnas.0803070105 [DOI] [PMC free article] [PubMed] [Google Scholar]
- 13.Hewson I, Steele JA, Capone DG, Fuhrman JA. 2006. Remarkable heterogeneity in meso- and bathypelagic bacterioplankton assemblage composition. Limnol. Oceanogr. 51:1274–1283. 10.4319/lo.2006.51.3.1274 [DOI] [Google Scholar]
- 14.Fortunato CS, Herfort L, Zuber P, Baptista AM, Crump BC. 2012. Spatial variability overwhelms seasonal patterns in bacterioplankton communities across a river to ocean gradient. ISME J. 6:554–563. 10.1038/ismej.2011.135 [DOI] [PMC free article] [PubMed] [Google Scholar]
- 15.Franklin MP, McDonald IR, Bourne DG, Owens NJP, Upstill-Goddard RC, Murrell JC. 2005. Bacterial diversity in the bacterioneuston (sea surface microlayer): the bacterioneuston through the looking glass. Environ. Microbiol. 7:723–736. 10.1111/j.1462-2920.2004.00736.x [DOI] [PubMed] [Google Scholar]
- 16.Thingstad TF, Krom MD, Mantoura RF, Flaten GA, Groom S, Herut B, Kress N, Law CS, Pasternak A, Pitta P, Psarra S, Rassoulzadegan F, Tanaka T, Tselepides A, Wassmann P, Woodward EM, Riser CW, Zodiatis G, Zohary T. 2005. Nature of phosphorus limitation in the ultraoligotrophic eastern Mediterranean. Science 309:1068–1071. 10.1126/science.1112632 [DOI] [PubMed] [Google Scholar]
- 17.Zohary T, Herut B, Krom MD, Fauzi C, Mantoura R, Pitta P, Psarra S, Rassoulzadegan F, Stambler N, Tanaka T, Frede Thingstad T, Woodward EMS. 2005. P-limited bacteria but N and P colimited phytoplankton in the eastern Mediterranean—a microcosm experiment. Deep Sea Res. Part II Top. Stud. Oceanogr. 52:3011–3023. 10.1016/j.dsr2.2005.08.011 [DOI] [Google Scholar]
- 18.Tanaka T, Zohary T, Krom MD, Law CS, Pitta P, Psarra S, Rassoulzadegan F, Thingstad TF, Tselepides A, Woodward EMS, Flaten GAF, Skjoldal EF, Zodiatis G. 2007. Microbial community structure and function in the Levantine Basin of the eastern Mediterranean. Deep Sea Res. Part I Oceanogr. Res. Pap. 54:1721–1743. 10.1016/j.dsr.2007.06.008 [DOI] [Google Scholar]
- 19.Torrent Bravo F, Sánchez Montañéz A. 2001. Aquaculture and environment from the perspective of a Spanish fish farmer. Cah. Options Mediterr. 55:101–109 http://om.ciheam.org/article.php?IDPDF=1600225 [Google Scholar]
- 20.Basurco B, Larrazabal G. 2000. Marine fish farming in Spain. Cah. Options Mediterr. 30:45–56 http://om.ciheam.org/article.php?IDPDF=600647 [Google Scholar]
- 21.Holmer M, Argyrou M, Dalsgaard T, Danovaro R, Diaz-Almela E, Duarte CM, Frederiksen M, Grau A, Karakassis I, Marbà N, Mirto S, Pérez M, Pusceddu A, Tsapakis M. 2008. Effects of fish farm waste on Posidonia oceanica meadows: synthesis and provision of monitoring and management tools. Mar. Pollut. Bull. 56:1618–1629. 10.1016/j.marpolbul.2008.05.020 [DOI] [PubMed] [Google Scholar]
- 22.Karakassis I, Tsapakis M, Hatziyanni E. 1998. Seasonal variability in sediment profiles beneath fish farm cages in the Mediterranean. Mar. Ecol. Prog. Ser. 162:243–252. 10.3354/meps162243 [DOI] [Google Scholar]
- 23.Shahidul Islam M, Tanaka M. 2004. Impacts of pollution on coastal and marine ecosystems including coastal and marine fisheries and approach for management: a review and synthesis. Mar. Pollut. Bull. 48:624–649. 10.1016/j.marpolbul.2003.12.004 [DOI] [PubMed] [Google Scholar]
- 24.Bissett A, Burke C, Cook PLM, Bowman JP. 2007. Bacterial community shifts in organically perturbed sediments. Environ. Microbiol. 9:46–60. 10.1111/j.1462-2920.2006.01110.x [DOI] [PubMed] [Google Scholar]
- 25.Kawahara N, Shigematsu K, Miyadai T, Kondo R. 2009. Comparison of bacterial communities in fish farm sediments along an organic enrichment gradient. Aquaculture 287:107–113. 10.1016/j.aquaculture.2008.10.003 [DOI] [Google Scholar]
- 26.Vezzulli L, Chelossi E, Riccardi G, Fabiano M. 2002. Bacterial community structure and activity in fish farm sediments of the Ligurian Sea (western Mediterranean). Aquaculture Int. 10:123–141. 10.1023/A:1021365829687 [DOI] [Google Scholar]
- 27.Asami H, Aida M, Watanabe K. 2005. Accelerated sulfur cycle in coastal marine sediment beneath areas of intensive shellfish aquaculture. Appl. Environ. Microbiol. 71:2925–2933. 10.1128/AEM.71.6.2925-2933.2005 [DOI] [PMC free article] [PubMed] [Google Scholar]
- 28.McCaig AE, Phillips CJ, Stephen JR, Kowalchuk GA, Martyn Harvey S, Herbert RA, Embley TM, Prosser JI. 1999. Nitrogen cycling and community structure of proteobacterial β-subgroup ammonia-oxidizing bacteria within polluted marine fish farm sediments. Appl. Environ. Microbiol. 65:213–220 [DOI] [PMC free article] [PubMed] [Google Scholar]
- 29.Yoza BA, Harada RM, Nihous GC, Li QX, Masutani SM. 2007. Impact of mariculture on microbial diversity in sediments near open ocean farming of Polydactylus sexfilis. Ecol. Indicators 7:108–122. 10.1016/j.ecolind.2005.11.001 [DOI] [Google Scholar]
- 30.Teramoto M, Queck SY, Ohnishi K. 2013. Specialized hydrocarbonoclastic bacteria prevailing in seawater around a port in the Strait of Malacca. PLoS One 8:e66594. 10.1371/journal.pone.0066594 [DOI] [PMC free article] [PubMed] [Google Scholar]
- 31.Zhang R, Liu B, Lau SC, Ki JS, Qian PY. 2007. Particle-attached and free-living bacterial communities in a contrasting marine environment: Victoria Harbor, Hong Kong. FEMS Microbiol. Ecol. 61:496–508. 10.1111/j.1574-6941.2007.00353.x [DOI] [PubMed] [Google Scholar]
- 32.Lindholm T, Svartström M, Spoof L, Meriluoto J. 2001. Effects of ship traffic on archipelago waters off the Långnäs Harbour in Åland, SW Finland. Hydrobiologia 444:217–225. 10.1023/A:1017518131889 [DOI] [Google Scholar]
- 33.Cury JC, Araujo FV, Coelho-Souza SA, Peixoto RS, Oliveira JAL, Santos HF, Dávila AMR, Rosado AS. 2011. Microbial diversity of a Brazilian coastal region influenced by an upwelling system and anthropogenic activity. PLoS One 6:e16553. 10.1371/journal.pone.0016553 [DOI] [PMC free article] [PubMed] [Google Scholar]
- 34.Iannelli R, Bianchi V, Macci C, Peruzzi E, Chiellini C, Petroni G, Masciandaro G. 2012. Assessment of pollution impact on biological activity and structure of seabed bacterial communities in the Port of Livorno (Italy). Sci. Total Environ. 426:56–64. 10.1016/j.scitotenv.2012.03.033 [DOI] [PubMed] [Google Scholar]
- 35.Ma Y, Xiong H, Tang S, Yang Q, Li M. 2009. Comparison of the community structure of planktonic bacteria in ballast water from entry ships and local sea water in Xiamen Port. Prog. Nat. Sci. 19:946–953. 10.1016/j.pnsc.2008.09.007 [DOI] [Google Scholar]
- 36.McGlathery KJ, Sundbäck K, Anderson IC. 2007. Eutrophication in shallow coastal bays and lagoons: the role of plants in the coastal filter. Mar. Ecol. Prog. Ser. 348:1–18. 10.3354/meps07132 [DOI] [Google Scholar]
- 37.Boynton WR, Murray L, Hagy JD, Stokes C, Kemp WM. 1996. A comparative analysis of eutrophication patterns in a temperate coastal lagoon. Estuaries 19:408–421. 10.2307/1352459 [DOI] [Google Scholar]
- 38.Cloern JE. 2001. Our evolving conceptual model of the coastal eutrophication problem. Mar. Ecol. Prog. Ser. 210:223–253. 10.3354/meps210223 [DOI] [Google Scholar]
- 39.Valette-Silver NJ. 1993. The use of sediment cores to reconstruct historical trends in contamination of estuarine and coastal sediments. Estuaries 16:577–588. 10.2307/1352796 [DOI] [Google Scholar]
- 40.Scavia D, Justić D, Bierman VJ., Jr 2004. Reducing hypoxia in the Gulf of Mexico: advice from three models. Estuaries 27:419–425. 10.1007/BF02803534 [DOI] [Google Scholar]
- 41.Scavia D, Kelly ELA, Hagy JD., III 2006. A simple model for forecasting the effects of nitrogen loads on Chesapeake Bay hypoxia. Estuaries Coasts 29:674–684. 10.1007/BF02784292 [DOI] [Google Scholar]
- 42.Celussi M, Pugnetti A, Del Negro P. 2009. Structural dynamics of bacterioplankton assemblages in the Lagoon of Venice. Estuarine Coastal Shelf Sci. 84:154–160. 10.1016/j.ecss.2009.05.028 [DOI] [Google Scholar]
- 43.Piccini C, Conde D, Alonso C, Sommaruga R, Pernthaler J. 2006. Blooms of single bacterial species in a coastal lagoon of the southwestern Atlantic Ocean. Appl. Environ. Microbiol. 72:6560–6568. 10.1128/AEM.01089-06 [DOI] [PMC free article] [PubMed] [Google Scholar]
- 44.Benlloch S, Rodríguez-Valera F, Martinez-Murcia AJ. 1995. Bacterial diversity in two coastal lagoons deduced from 16S rDNA PCR amplification and partial sequencing. FEMS Microbiol. Ecol. 18:267–280. 10.1111/j.1574-6941.1995.tb00183.x [DOI] [Google Scholar]
- 45.Simonato F, Gómez-Pereira PR, Fuchs BM, Amann R. 2010. Bacterioplankton diversity and community composition in the southern Lagoon of Venice. Syst. Appl. Microbiol. 33:128–138. 10.1016/j.syapm.2009.12.006 [DOI] [PubMed] [Google Scholar]
- 46.Taketani RG, de Araújo FV, de Cannavan FS, Tsai SM, Rosado AS. 2010. Influence of the bacterioplankton community of a tropical eutrophic lagoon on the bacterial community of its neighbouring ocean. World J. Microbiol. Biotechnol. 26:1865–1873. 10.1007/s11274-010-0368-9 [DOI] [Google Scholar]
- 47.Massana R, Murray AE, Preston CM, DeLong EF. 1997. Vertical distribution and phylogenetic characterization of marine planktonic Archaea in the Santa Barbara Channel. Appl. Environ. Microbiol. 63:50–56 [DOI] [PMC free article] [PubMed] [Google Scholar]
- 48.Tzahor S, Man-Aharonovich D, Kirkup BC, Yogev T, Berman-Frank I, Polz MF, Béjà O, Mandel-Gutfreund Y. 2009. A supervised learning approach for taxonomic classification of core-photosystem-II genes and transcripts in the marine environment. BMC Genomics 10:229. 10.1186/1471-2164-10-229 [DOI] [PMC free article] [PubMed] [Google Scholar]
- 49.Sánchez O, Gasol JM, Massana R, Mas J, Pedrós-Alió C. 2007. Comparison of different denaturing gradient gel electrophoresis primer sets for the study of marine bacterioplankton communities. Appl. Environ. Microbiol. 73:5962–5967. 10.1128/AEM.00817-07 [DOI] [PMC free article] [PubMed] [Google Scholar]
- 50.Holm-Hansen O, Lorenzen CJ, Holmes RW, Strickland JDH. 1965. Fluorometric determination of chlorophyll. J. Cons. Int. Explor. Mer 30:3–15. 10.1093/icesjms/30.1.3 [DOI] [Google Scholar]
- 51.Quince C, Lanzen A, Davenport RJ, Turnbaugh PJ. 2011. Removing noise from pyrosequenced amplicons. BMC Bioinformatics 12:38. 10.1186/1471-2105-12-38 [DOI] [PMC free article] [PubMed] [Google Scholar]
- 52.Edgar RC. 2010. Search and clustering orders of magnitude faster than BLAST. Bioinformatics 26:2460–2461. 10.1093/bioinformatics/btq461 [DOI] [PubMed] [Google Scholar]
- 53.Caporaso JG, Kuczynski J, Stombaugh J, Bittinger K, Bushman FD, Costello EK, Fierer N, Peña AG, Goodrich JK, Gordon JI, Huttley GA, Kelley ST, Knights D, Koenig JE, Ley RE, Lozupone CA, McDonald D, Muegge BD, Pirrung M, Reeder J, Sevinsky JR, Turnbaugh PJ, Walters WA, Widmann J, Yatsunenko T, Zaneveld J, Knight R. 2010. QIIME allows analysis of high-throughput community sequencing data. Nat. Methods 7:335–336. 10.1038/nmeth.f.303 [DOI] [PMC free article] [PubMed] [Google Scholar]
- 54.McDonald D, Price MN, Goodrich J, Nawrocki EP, Desantis TZ, Probst A, Andersen GL, Knight R, Hugenholtz P. 2012. An improved Greengenes taxonomy with explicit ranks for ecological and evolutionary analyses of bacteria and archaea. ISME J. 6:610–618. 10.1038/ismej.2011.139 [DOI] [PMC free article] [PubMed] [Google Scholar]
- 55.Hammer Ø, Harper DAT, Ryan PD. 2001. PAST: paleontological statistics software package for education and data analysis. Palaeontol. Electronica 4:XIX–XX http://palaeo-electronica.org/2001_1/past/issue1_01.htm [Google Scholar]
- 56.Benjamini Y, Hochberg Y. 1995. Controlling the false discovery rate: a practical and powerful approach to multiple testing. J. R. Stat. Soc. Series B Stat. Methodol. 57:289–300 [Google Scholar]
- 57.Logue JB, Langenheder S, Andersson AF, Bertilsson S, Drakare S, Lanzen A, Lindstrom ES. 2012. Freshwater bacterioplankton richness in oligotrophic lakes depends on nutrient availability rather than on species-area relationships. ISME J. 6:1127–1136. 10.1038/ismej.2011.184 [DOI] [PMC free article] [PubMed] [Google Scholar]
- 58.Landa M, Cottrell MT, Kirchman DL, Blain S, Obernosterer I. 2013. Changes in bacterial diversity in response to dissolved organic matter supply in a continuous culture experiment. Aquat. Microb. Ecol. 69:157–168. 10.3354/ame01632 [DOI] [Google Scholar]
- 59.Sjöstedt J, Pontarp M, Tinta T, Alfredsson H, Turk V, Lundberg P, Hagström Å, Riemann L. 2013. Reduced diversity and changed bacterioplankton community composition do not affect utilization of dissolved organic matter in the Adriatic Sea. Aquat. Microb. Ecol. 71:15–24. 10.3354/ame01660 [DOI] [Google Scholar]
- 60.Coolon JD, Jones KL, Todd TC, Blair JM, Herman MA. 2013. Long-term nitrogen amendment alters the diversity and assemblage of soil bacterial communities in tallgrass prairie. PLoS One 8:e67884. 10.1371/journal.pone.0067884 [DOI] [PMC free article] [PubMed] [Google Scholar]
- 61.Shade A, Peter H, Allison SD, Baho DL, Berga M, Burgmann H, Huber DH, Langenheder S, Lennon JT, Martiny JB, Matulich KL, Schmidt TM, Handelsman J. 2012. Fundamentals of microbial community resistance and resilience. Front. Microbiol. 3:417. 10.3389/fmicb.2012.00417 [DOI] [PMC free article] [PubMed] [Google Scholar]
- 62.Rappe MS, Connon SA, Vergin KL, Giovannoni SJ. 2002. Cultivation of the ubiquitous SAR11 marine bacterioplankton clade. Nature 418:630–633. 10.1038/nature00917 [DOI] [PubMed] [Google Scholar]
- 63.Teira E, Martinez-Garcia S, Lonborg C, Alvarez-Salgado XA. 2009. Growth rates of different phylogenetic bacterioplankton groups in a coastal upwelling system. Environ. Microbiol. Rep. 1:545–554. 10.1111/j.1758-2229.2009.00079.x [DOI] [PubMed] [Google Scholar]
- 64.Dinasquet J, Kragh T, Schroter ML, Sondergaard M, Riemann L. 2013. Functional and compositional succession of bacterioplankton in response to a gradient in bioavailable dissolved organic carbon. Environ. Microbiol. 15:2616–2628. 10.1111/1462-2920.12178 [DOI] [PubMed] [Google Scholar]
- 65.Williams TJ, Wilkins D, Long E, Evans F, DeMaere MZ, Raftery MJ, Cavicchioli R. 2013. The role of planktonic flavobacteria in processing algal organic matter in coastal East Antarctica revealed using metagenomics and metaproteomics. Environ. Microbiol. 15:1302–1317. 10.1111/1462-2920.12017 [DOI] [PubMed] [Google Scholar]
- 66.Dupont CL, Rusch DB, Yooseph S, Lombardo MJ, Richter RA, Valas R, Novotny M, Yee-Greenbaum J, Selengut JD, Haft DH, Halpern AL, Lasken RS, Nealson K, Friedman R, Venter JC. 2012. Genomic insights to SAR86, an abundant and uncultivated marine bacterial lineage. ISME J. 6:1186–1199. 10.1038/ismej.2011.189 [DOI] [PMC free article] [PubMed] [Google Scholar]
- 67.Alonso-Gutiérrez J, Lekunberri I, Teira E, Gasol JM, Figueras A, Novoa B. 2009. Bacterioplankton composition of the coastal upwelling system of ‘Ría de Vigo,' NW Spain. FEMS Microbiol. Ecol. 70:493–505. 10.1111/j.1574-6941.2009.00766.x [DOI] [PubMed] [Google Scholar]
- 68.Tada Y, Taniguchi A, Nagao I, Miki T, Uematsu M, Tsuda A, Hamasaki K. 2011. Differing growth responses of major phylogenetic groups of marine bacteria to natural phytoplankton blooms in the western North Pacific Ocean. Appl. Environ. Microbiol. 77:4055–4065. 10.1128/AEM.02952-10 [DOI] [PMC free article] [PubMed] [Google Scholar]
- 69.Morris RM, Frazar CD, Carlson CA. 2012. Basin-scale patterns in the abundance of SAR11 subclades, marine Actinobacteria (OM1), members of the Roseobacter clade and OCS116 in the South Atlantic. Environ. Microbiol. 14:1133–1144. 10.1111/j.1462-2920.2011.02694.x [DOI] [PubMed] [Google Scholar]
- 70.Allers E, Gomez-Consarnau L, Pinhassi J, Gasol JM, Simek K, Pernthaler J. 2007. Response of Alteromonadaceae and Rhodobacteriaceae to glucose and phosphorus manipulation in marine mesocosms. Environ. Microbiol. 9:2417–2429. 10.1111/j.1462-2920.2007.01360.x [DOI] [PubMed] [Google Scholar]
- 71.McCarren J, Becker JW, Repeta DJ, Shi Y, Young CR, Malmstrom RR, Chisholm SW, DeLong EF. 2010. Microbial community transcriptomes reveal microbes and metabolic pathways associated with dissolved organic matter turnover in the sea. Proc. Natl. Acad. Sci. U. S. A. 107:16420–16427. 10.1073/pnas.1010732107 [DOI] [PMC free article] [PubMed] [Google Scholar]
- 72.Grossart HP, Levold F, Allgaier M, Simon M, Brinkhoff T. 2005. Marine diatom species harbour distinct bacterial communities. Environ. Microbiol. 7:860–873. 10.1111/j.1462-2920.2005.00759.x [DOI] [PubMed] [Google Scholar]
- 73.Pinhassi J, Sala MM, Havskum H, Peters F, Guadayol O, Malits A, Marrase C. 2004. Changes in bacterioplankton composition under different phytoplankton regimens. Appl. Environ. Microbiol. 70:6753–6766. 10.1128/AEM.70.11.6753-6766.2004 [DOI] [PMC free article] [PubMed] [Google Scholar]
- 74.Tada Y, Taniguchi A, Sato-Takabe Y, Hamasaki K. 2012. Growth and succession patterns of major phylogenetic groups of marine bacteria during a mesocosm diatom bloom. J. Oceanogr. 68:509–519. 10.1007/s10872-012-0114-z [DOI] [Google Scholar]
- 75.Fernandez-Gomez B, Richter M, Schuler M, Pinhassi J, Acinas SG, Gonzalez JM, Pedros-Alio C. 2013. Ecology of marine Bacteroidetes: a comparative genomics approach. ISME J. 7:1026–1037. 10.1038/ismej.2012.169 [DOI] [PMC free article] [PubMed] [Google Scholar]
- 76.Apostolaki ET, Holmer M, Marbà N, Karakassis I. 2010. Degrading seagrass (Posidonia oceanica) ecosystems: a source of dissolved matter in the Mediterranean. Hydrobiologia 649:13–23. 10.1007/s10750-010-0255-2 [DOI] [Google Scholar]
- 77.Fernandes N, Steinberg P, Rusch D, Kjelleberg S, Thomas T. 2012. Community structure and functional gene profile of bacteria on healthy and diseased thalli of the red seaweed Delisea pulchra. PLoS One 7:e50854. 10.1371/journal.pone.0050854 [DOI] [PMC free article] [PubMed] [Google Scholar]
Associated Data
This section collects any data citations, data availability statements, or supplementary materials included in this article.